Abstract
Purpose
To apply resting-state functional magnetic resonance (MR) imaging to map functional connectivity of the human spinal cord.
Materials and Methods
Studies were performed in nine self-declared healthy volunteers with informed consent and institutional review board approval. Resting-state functional MR imaging was performed to map functional connectivity of the human cervical spinal cord from C1 to C4 at 1 × 1 × 3-mm resolution with a 3.0-T clinical MR imaging unit. Independent component analysis (ICA) was performed to derive resting-state functional MR imaging z-score maps rendered on two-dimensional and three-dimensional images. Seed-based analysis was performed for cross validation with ICA networks by using Pearson correlation.
Results
Reproducibility analysis of resting-state functional MR imaging maps from four repeated trials in a single participant yielded a mean z score of 6 ± 1 (P < .0001). The centroid coordinates across the four trials deviated by 2 in-plane voxels ± 2 mm (standard deviation) and up to one adjacent image section ± 3 mm. ICA of group resting-state functional MR imaging data revealed prominent functional connectivity patterns within the spinal cord gray matter. There were statistically significant (z score > 3, P < .001) bilateral, unilateral, and intersegmental correlations in the ventral horns, dorsal horns, and central spinal cord gray matter. Three-dimensional surface rendering provided visualization of these components along the length of the spinal cord. Seed-based analysis showed that many ICA components exhibited strong and significant (P < .05) correlations, corroborating the ICA results. Resting-state functional MR imaging connectivity networks are qualitatively consistent with known neuroanatomic and functional structures in the spinal cord.
Conclusion
Resting-state functional MR imaging of the human cervical spinal cord with a 3.0-T clinical MR imaging unit and standard MR imaging protocols and hardware reveals prominent functional connectivity patterns within the spinal cord gray matter, consistent with known functional and anatomic layouts of the spinal cord.
The spinal cord is organized with white matter in the periphery and gray matter centrally. The white matter comprises myelinated motor and sensory axons. The gray matter has a butterfly structure and can be subdivided into dorsal (sensory nuclei) and ventral (motor nuclei) horns. There are also interneurons that form ascending and descending tracts, making connections within and between different segments of the cord, which play an important role in spinal reflexes.
While functional magnetic resonance (MR) imaging has been used to study spinal cord functions (1), the tasks used to evoke functional changes in the spinal cord are limited in the MR imaging environment. Resting-state functional MR imaging, which maps the spontaneous temporal correlations of spontaneous low-frequency fluctuations (<0.1 Hz) of the brain (ie, at rest), could potentially offer an alternative approach to study intrinsic functional connectivity in the spinal cord without external stimuli. Resting-state functional MR imaging has opened up new avenues for mapping functional connectivity in the healthy brain (2,3) as well as in many brain disorders and injuries (4–6). With the exception of two studies (7,8) demonstrating its technical feasibility, spinal resting-state functional MR imaging, however, has not been widely explored, likely owing to technical challenges. The spinal cord (a) has a small cross-sectional area that demands high spatial resolution; (b) is located in regions that are susceptible to physiologic noise and motion artifacts; (c) is composed of mostly white matter, which yields weak resting-state functional MR imaging signals; and (d) has a length that limits efficient coverage.
Building on these previous works, we investigated intrinsic functional connectivity by using a clinical 3.0-T MR imaging unit at 1 × 1 × 3-mm resolution. The novelties of our study are that independent component (IC) analysis (ICA) was used to analyze the spinal resting-state functional MR imaging data, with corroboration with seed-based analysis. Three-dimensional (3D)-rendered resting-state functional MR imaging maps facilitated visualization of functional connectivity along the length of the spinal cord. Results were interpreted with respect to known anatomic and functional structures of the cord.
Materials and Methods
Studies were performed with informed consent and approval of the institutional review board. We included self-declared healthy adult men and women. Exclusion criteria were claustrophobia and cardiovascular, neurologic, and psychiatric diseases. Self-declared healthy human volunteers were examined (nine men [eight of whom were right handed]; mean age, 29 years ± 4). Two female participants were excluded because of claustrophobia and motion. Participants showed no structural MR imaging abnormalities in the spinal cord (F.Y., a radiology resident). The majority of the data acquisition and data analysis was performed by O.S.E.N. (3rd-year PhD student with 5-year MR imaging research experience) and C.G.F. (a research scientist with more than 10 years of relevant experience), with guidance from J.L.L. and T.Q.D. (professors, each with more than 20 years of relevant experience).
MR imaging was performed with a 3.0-T/90-cm TIM Trio unit (Siemens, Erlangen, Germany) by using a transmit body radiofrequency coil and a 12-channel receive head coil. Subjects were placed in the supine position while wearing a padded neck brace and were instructed to close their eyes, relax, and not to fall asleep. The top image section was positioned to bisect the odontoid process at the bottom of the C1 vertebra and extend inferiorly to the C4 vertebra. Blood oxygen level-dependent resting-state functional MR imaging data were acquired by using echoplanar imaging with a 128 × 128-mm field of view, a 128 × 128 matrix (1 ×1 × 3 mm), a 2-second repetition time, a 26-msec echo time, a 3-mm section thickness, 23 axial sections, and 300 time points (10 minutes). T2-weighted MR imaging was performed by using a turbo spin-echo sequence with a 128 ×128 field of view, a 128 × 128 matrix (1 × 1 × 3 mm), a 6.9-second repetition time, a 70-msec echo time, and nine echo-train lengths. Susceptibility-weighted images were acquired by using a 61-msec repetition time, 12 equally spaced echoes with echo times from 4.51 to 49.59 msec, a 128 × 128 field of view, and a 320 × 320 matrix (0.4 × 0.4 × 3 mm). Quantitative susceptibility mapping was used to overlay the resting-state functional MR imaging maps because of its high gray-white matter contrast.
Blood oxygen level-dependent time-series images were corrected for motion (MCFLIRT tool in FSL, version 5.0.6) and were coregistered manually to individual T2-weighted MR images (MANGO, version 3.11) and then to a reference template from one subject for group analysis. Noise was removed from individual resting-state functional MR imaging data by using ICA (MELODIC, version 3.14; FSL) (9), in which the number of ICs was set to automatic dimensionality estimation (ranging from 20 to 30). These components were filtered out by using the fsl_regfilt function in FSL. A mask of the spinal cord was applied for display.
For resting-state functional MR imaging analysis, a high-pass filter with a 100-second cutoff and 16 ICs was used. This was chosen on the basis of human brain resting-state functional MR imaging analysis (typically set to 20) (10) and by using a trial-and-error process that maximized the clustering of subcomponents. Group resting-state functional MR imaging maps were overlaid on two-dimensional (2D) and 3D reference templates (MANGO, version 3.11). In addition, four repeated resting-state functional MR imaging trials in a single session were performed to enable the evaluation of within-subject reproducibility by using the z score.
Seed-based resting-state functional MR imaging was used for comparison. Clusters from the ICA thresholded with z scores greater than 3 were used as seed regions of interest (ROIs). The time course of each ROI was compared with that of all other ROIs to derive a correlation matrix, and Pearson correlation was performed.
Results
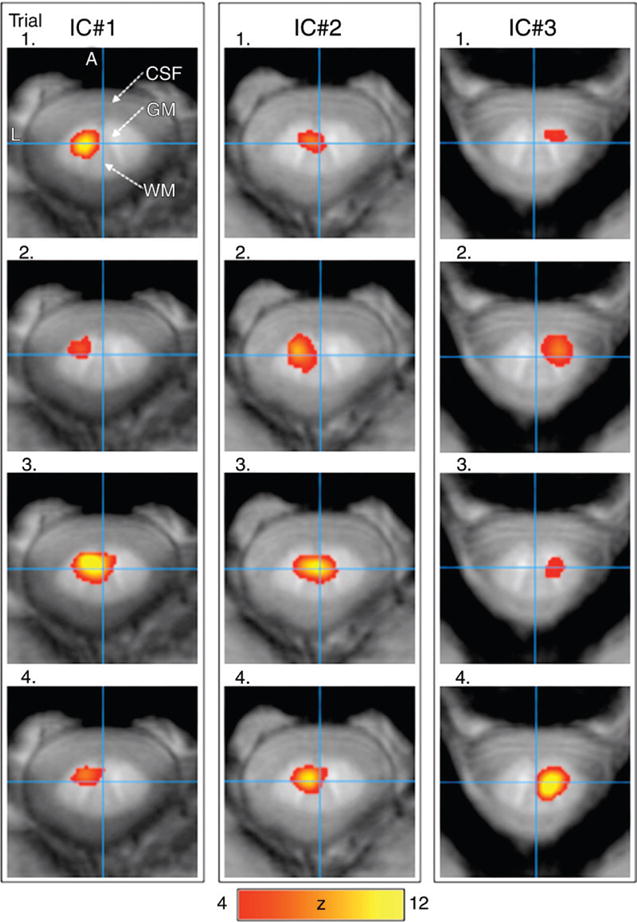
Four repeat trials in a single subject and MR imaging session (Fig 1) showed consistent resting-state functional MR imaging patterns predominantly localized to gray matter, albeit with some partial-volume effect. Reproducibility analysis yielded a mean z score of 6 ± 1 (P <.0001) for the three components. The centroid coordinates across the four trials deviated by 2 in-plane voxels ± 2 mm (standard deviation) and up to one adjacent image section ± 3 mm.
Figure 1.

Three ICs of the resting-state functional MR imaging maps from four repeated trials in one subject were overlaid on susceptibility images of the C1—C4 vertebrae. The maps were consistent across four trials. Scale bar = z scores. A = anterior, CSF = cerebrospinal fluid, GM = gray matter, L = left, S = superior, and WM = white matter.
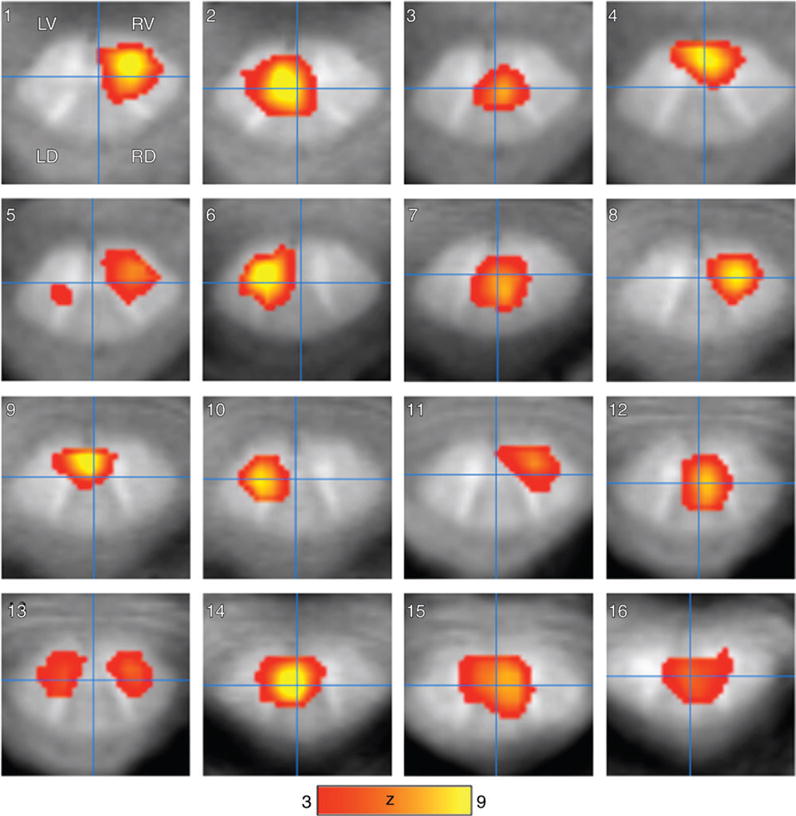
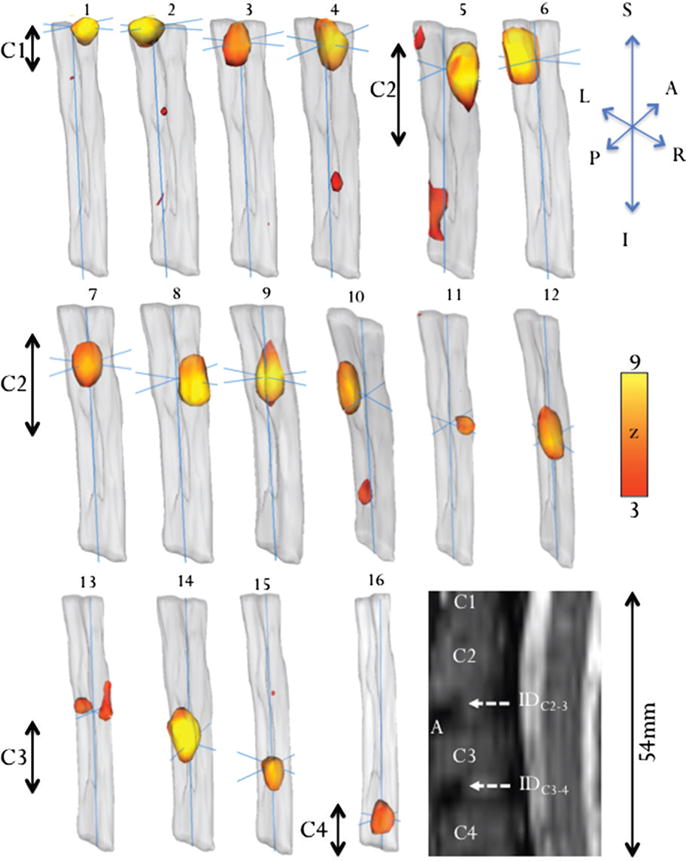
Sixteen independent components of the resting-state functional MR imaging group data on 2D images (Fig 2) and 3D surface images (Fig 3) showed multiple unilateral, bilaterial, and intra- and intersegmental resting-state functional MR imaging correlations localized to the ventral horns, dorsal horns, and central spinal cord. Three-dimensional rendering enabled visualization of functional connectivity patterns along the spinal cord. Some ICs (1, 2, 5, and 13) had bilateral and intersegmental patterns, while others (4, 10, and 15) showed unilateral and intersegmental activation. Only ICs 6, 8, and 11 showed definite unilateral patterns, while ICs 3, 7, 9, 12, 14, and 16 showed mainly centralized coherence with some bilateral patterns. The Table lists the locations, vertebra level, and craniocaudal dimensions of the resting-state functional MR imaging patterns.
Figure 2.

Group resting-state functional MR imaging maps show 16 ICA components (n = 9). The resting-state functional MR imaging maps were ordered anatomically from superior to inferior from the C1 to the C4 vertebra level. Intrinsic functional connectivity activations are primarily localized to gray matter in the spinal cord. The four quadrants (LD = left dorsal, LV = left ventral, RD = right dorsal, and RV = right ventral) are denoted for reference in discussion. Scale bar = z scores.
Figure 3.

Three-dimensional surface rendering of 16 ICA components shows the location and extent of each ICA component. The anatomic image (sagittal view) shows the corresponding positions of the vertebral (C1, C2, C3, and C4) bodies. Scale bar = z scores.
Table.
Intrinsic Connectivity Networks Observed by Using Resting-State Functional MR Imaging
| ICA | Vertebra Level | Quadrants or Center | Craniocaudal Length (mm) |
|---|---|---|---|
| 1 | C1 | RV/RD | 3 |
| 2 | C1 | LV/LD | 6 |
| 3 | C1/C2 | CC | 9 |
| 4 | C1/C2, C3 | RV/RD, CC | 9, 3 |
| 5 | C1, C2, IDC3–4 | RV, RD, LD | 9, 6, 15 |
| 6 | C2 | LV/LD | 9 |
| 7 | C2 | CC | 9 |
| 8 | C2 | RV/RD | 9 |
| 9 | C2 | LV/CC | 12 |
| 10 | C2, IDC3–4 | LV, LD | 9, 3 |
| 11 | C2 | RV | 3 |
| 12 | C3 | RV/RD/CC | 9 |
| 13 | C2 | RV/LV | 9, 3 |
| 14 | IDC2–3 | LV/LD | 12 |
| 15 | C3 | CC | 6, 3 |
| 16 | C4 | CC | 3 |
Note.—The spinal cord is subdivided into five regions (the center of the cord [CC], the left and right dorsal horns [LD and RD], and the left and right ventral horns [LV and RV]). IDC2–3 and IDC3–4 are the intervertebral disks between C2 and C3 and between C3 and C4. The vertebra level and craniocaudal length of the spinal cord networks are listed.
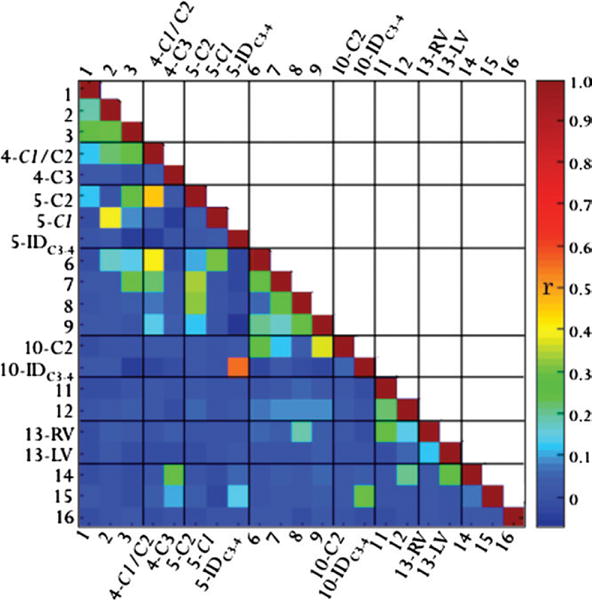
The results of the seed-based resting-state functional MR imaging analysis are shown as a correlation coefficient matrix in Figure 4. The diagonal elements in dark red correspond to the correlation with itself and has an r of +1. Statistically significant correlation was achieved when r > 0.037 (P < .05). There were strong and significant correlations (r > 0.3, P < <0.05, green to red) among the immediate neighboring clusters 1–4, 7–10, and 11–14, as well as between some more distant clusters (1–3 with five clusters, 4 with six or seven clusters, and 5 with six to nine clusters. Weak correlations (in cyan) were observed in some clusters, while no significant correlations were observed for most of the distant clusters (P > .05, blue). Seed-based analysis confirmed correlation of the ICs.
Figure 4.

Correlation (r) matrix of the seed-based analysis performed by using the ICA clusters as seeds with z > 3 as a threshold. The diagonal line in red that corresponds to the correlation of a time series with itself has r = +1. The results typically showed strong correlations among immediate neighboring clusters and among more distant clusters. Weak or no correlations were observed for some distant clusters. Note that the IC region-of-interest seeds were obtained with a z > 3 threshold, resulting in only a subset of the pixels of each IC, not all ICs; thus, there is no contradiction that the ICs showed correlations. r > 0.037 Yields P < .05, and r > 0.049 yields P < .01.
Discussion
This study demonstrates resting-state functional MR imaging application in the human cervical spinal cord with a widely available 3.0-T clinical MR imaging unit and the use of standard MR imaging protocols and hardware at 1 × 1 × 3-mm resolution. ICA and 3D rendering of the resting-state functional MR imaging data identified several functional connectivity clusters that were localized within as well as between contralateral ventral and dorsal horns, within the central cord, and across different cord levels. These components are qualitatively consistent with known neuroanatomic and functional structures in the spinal cord. The ICA results were also corroborated by seed-based analyses. The significance of these results is that functional connectivity within the cross-sectional area, as well as along the spinal cord, can be imaged, which could have potential application in the evaluation of pathological conditions of the spinal cord.
Two prior studies (7,8) have investigated spinal resting-state functional MR imaging. Wei et al reported resting-state functional MR imaging of the spinal cord in individual subjects (as opposed to group analysis) from C5 to T1 at 1.5 T with 1.25 × 1.25 × 5-mm resolution. They did not delve into details regarding the functional importance of the resting-state functional MR imaging networks. Barry et al used seed-based resting-state functional MR imaging analysis to investigate C3 to C5 at 7.0 T and 0.91 × 0.91 × 4-mm resolution. They found correlations between the left and right ventral as well as dorsal horns. Correlations between ventral and dorsal gray matter were also observed at the individual-subject level but were not statistically significant at the group level. Both studies analyzed resting-state functional MR imaging connectivity on 2D axial images. Using ICA and 3D rendering, we were able to detect additional functional connectivity clusters, particularly those across different image sections. This approach may correlate better with known neuroanatomic and functional structures in the spinal cord, as detailed below.
We found that connectivity clusters were localized to the ventral (ICs 1–6 and 8–13) and dorsal (ICs 4–8, 10, and 14) horns. The ventral horn consists of lateral and medial motor neurons, which relay information to the extremities and the viscera (11). Many of the functions supported by these structures are essential for life and occur without conscious input. The dorsal horns consist of sensory nuclei that receive and process incoming somatosensory information and have also been shown to be involved in unconscious proprioception. In addition, we detected intrasegmental correlations between the ipsilateral as well as the contralateral ventral and dorsal horns. There are known anatomic connections between ventral and dorsal horn nuclei, as seen in the spinal reflex pathways. Individual interneurons are known to traverse in ipsilateral as well as contralateral fashion, interacting with different regions of the spinal gray matter (12). These interneurons are associated with a diverse array of functions, including the modulation of various afferent and efferent signals (13).
Spinal resting-state functional MR imaging clusters were also identified in the central spinal cord, which is comprised of cell bodies within the Rexed lamina X. The role of this “centromedullary” activity may be attributed to midline interneuronal synapses, which have been implicated in mediating autonomic signals (13–16). There may also be contributions from the medial aspect of the nearby ventral horns, which are involved in reflex and posture maintenance. Another pattern that has not been identified in prior resting-state functional MR imaging studies are the intersegmental clusters along the length of the cord (ie, ICs 4, 5, and 10). These may represent synapses of collateral fibers from ascending and descending white-matter tracts. Among the interneurons, there is a subpopulation referred to as propriospinal neurons, or “fasciculi proprii,” which are unique in that they project to cord segments beyond where their cell bodies reside. Although some of these fibers are extensive, traversing more than six vertebral levels, the majority are short fibers terminating in the ipsilateral as well as contralateral gray matter (17).
The major limitation of this study was that there was no independent validation of the resting-state functional MR imaging networks. Other limitations include low spatial resolution relative to the small cross-sectional area of the spinal cord and the limited coverage along the length the cord. Future studies will focus on cross validation, improving spatial resolution, and coverage along the length of the spinal cord.
In conclusion, this study demonstrated resting-state functional MR imaging intrinsic functional connectivity in the human cervical spinal cord using ICA and 3D surface rendering. This approach could have potential clinical applications in normal aging, spinal cord injuries, and neurodegenerative diseases.
Advances in Knowledge.
-
■
Reproducibility analysis of resting-state functional MR imaging maps from four repeated trials in a single participant yielded a mean z score of 6 ± 1 (P < .0001).
-
■
Independent component analysis (ICA) of group data showed spinal resting-state functional MR imaging connectivity localized to the gray matter of the central spinal cord and ventral and dorsal horns.
-
■
Three-dimensional rendering of resting-state functional MR imaging maps showed bilateral, unilateral, and intersegmental resting-state functional MR imaging connectivity networks (z score > 3, P < .001).
-
■
Seed-based analysis showed that many ICA components exhibited strong and significant correlation (P < .05), corroborating the ICA results.
-
■
These resting-state functional MR imaging functional connectivity networks are consistent with neuroanatomic and functional layouts in the human spinal cord.
Abbreviations
- IC
independent component
- ICA
IC analysis
- 3D
three-dimensional
- 2D
two-dimensional
Footnotes
Supported in part by NIGMS MBRS-RISE GM060655 fellowship.
Author contributions:
Guarantors of integrity of entire study, O.S.E.N., FY, T.Q.D.; study concepts/study design or data acquisition or data analysis/interpretation, all authors; manuscript drafting or manuscript revision for important intellectual content, all authors; manuscript final version approval, all authors; agrees to ensure any questions related to the work are appropriately resolved, all authors; literature research, O.S.E.N., FY, E.R.M., T.Q.D.; clinical studies, O.S.E.N., T.Q.D.; experimental studies, O.S.E.N., FY, W.L., J.L., J.L.L., T.Q.D.; statistical analysis, O.S.E.N., E.R.M., C.G.F, T.Q.D.; and manuscript editing, O.S.E.N., FY, E.R.M., C.B., C.G.F, J.L., J.L.L., T.Q.D.
Disclosures of Conflicts of Interest: O.S.E.N. disclosed no relevant relationships. F.Y. disclosed no relevant relationships. E.R.M. disclosed no relevant relationships. C.B. disclosed no relevant relationships. C.G.F. disclosed no relevant relationships. W.L. disclosed no relevant relationships. J.L. disclosed no relevant relationships. J.L.L. disclosed no relevant relationships. T.Q.D. disclosed no relevant relationships.
References
- 1.Cadotte DW, Stroman PW, Mikulis D, Fehlings MG. A systematic review of spinal fMRI research: outlining the elements of experimental design. J Neurosurg Spine. 2012;17(1 Suppl):102–118. doi: 10.3171/2012.5.AOSPINE1278. [DOI] [PubMed] [Google Scholar]
- 2.Biswal B, Yetkin FZ, Haughton VM, Hyde JS. Functional connectivity in the motor cortex of resting human brain using echo-planar MRI. Magn Reson Med. 1995;34(4):537–541. doi: 10.1002/mrm.1910340409. [DOI] [PubMed] [Google Scholar]
- 3.Raichle ME. The restless brain. Brain Connect. 2011;1(1):3–12. doi: 10.1089/brain.2011.0019. [DOI] [PMC free article] [PubMed] [Google Scholar]
- 4.Rosazza C, Minati L. Resting-state brain networks: literature review and clinical applications. Neurol Sci. 2011;32(5):773–785. doi: 10.1007/s10072-011-0636-y. [DOI] [PubMed] [Google Scholar]
- 5.Lee MH, Smyser CD, Shimony JS. Resting-state fMRI: a review of methods and clinical applications. AJNR Am J Neuroradiol. 2013;34(10):1866–1872. doi: 10.3174/ajnr.A3263. [DOI] [PMC free article] [PubMed] [Google Scholar]
- 6.Heine L, Soddu A, Gómez F, et al. Resting state networks and consciousness: alterations of multiple resting state network connectivity in physiological, pharmacological, and pathological consciousness states. Front Psychol. 2012;3:295. doi: 10.3389/fpsyg.2012.00295. [DOI] [PMC free article] [PubMed] [Google Scholar]
- 7.Wei P, Li J, Gao F, Ye D, Zhong Q, Liu S. Resting state networks in human cervical spinal cord observed with fMRI. Eur J Appl Physiol. 2010;108(2):265–271. doi: 10.1007/s00421-009-1205-4. [DOI] [PubMed] [Google Scholar]
- 8.Barry RL, Smith SA, Dula AN, Gore JC. Resting state functional connectivity in the human spinal cord. eLife. 2014;3:e02812. doi: 10.7554/eLife.02812. [DOI] [PMC free article] [PubMed] [Google Scholar]
- 9.Beckmann CF, Smith SM. Probabilistic independent component analysis for functional magnetic resonance imaging. IEEE Trans Med Imaging. 2004;23(2):137–152. doi: 10.1109/TMI.2003.822821. [DOI] [PubMed] [Google Scholar]
- 10.Smith SM, Fox PT, Miller KL, et al. Correspondence of the brain’s functional architecture during activation and rest. Proc Natl Acad Sci U S A. 2009;106(31):13040–13045. doi: 10.1073/pnas.0905267106. [DOI] [PMC free article] [PubMed] [Google Scholar]
- 11.Appel NM, Elde RP. The intermediolateral cell column of the thoracic spinal cord is comprised of target-specific subnuclei: evidence from retrograde transport studies and immunohistochemistry. J Neurosci. 1988;8(5):1767–1775. doi: 10.1523/JNEUROSCI.08-05-01767.1988. [DOI] [PMC free article] [PubMed] [Google Scholar]
- 12.Matsuyama K, Nakajima K, Mori F, Aoki M, Mori S. Lumbar commissural interneurons with reticulospinal inputs in the cat: morphology and discharge patterns during fictive locomotion. J Comp Neurol. 2004;474(4):546–561. doi: 10.1002/cne.20131. [DOI] [PubMed] [Google Scholar]
- 13.Conta AC, Stelzner DJ. The propriospinal system. In: Watson C, Paxinos G, Kayalioglu G, editors. The spinal cord. London, England: Academic Press; 2009. pp. 180–190. [Google Scholar]
- 14.Alstermark B, Isa T, Ohki Y, Saito Y. Disynaptic pyramidal excitation in forelimb motoneurons mediated via C(3)-C(4) propriospinal neurons in the Macaca fuscata. J Neurophysiol. 1999;82(6):3580–3585. doi: 10.1152/jn.1999.82.6.3580. [DOI] [PubMed] [Google Scholar]
- 15.Alstermark B, Johannisson T, Lundberg A. The inhibitory feedback pathway from the forelimb to C3–C4 propriospinal neurones investigated with natural stimulation. Neurosci Res. 1986;3(5):451–456. doi: 10.1016/0168-0102(86)90037-4. [DOI] [PubMed] [Google Scholar]
- 16.Pierrot-Deseilligny E. Propriospinal transmission of part of the corticospinal excitation in humans. Muscle Nerve. 2002;26(2):155–172. doi: 10.1002/mus.1240. [DOI] [PubMed] [Google Scholar]
- 17.Nathan PW, Smith MC. Fasciculi proprii of the spinal cord in man. Brain. 1959;82:610–668. doi: 10.1093/brain/82.4.610. [DOI] [PubMed] [Google Scholar]


