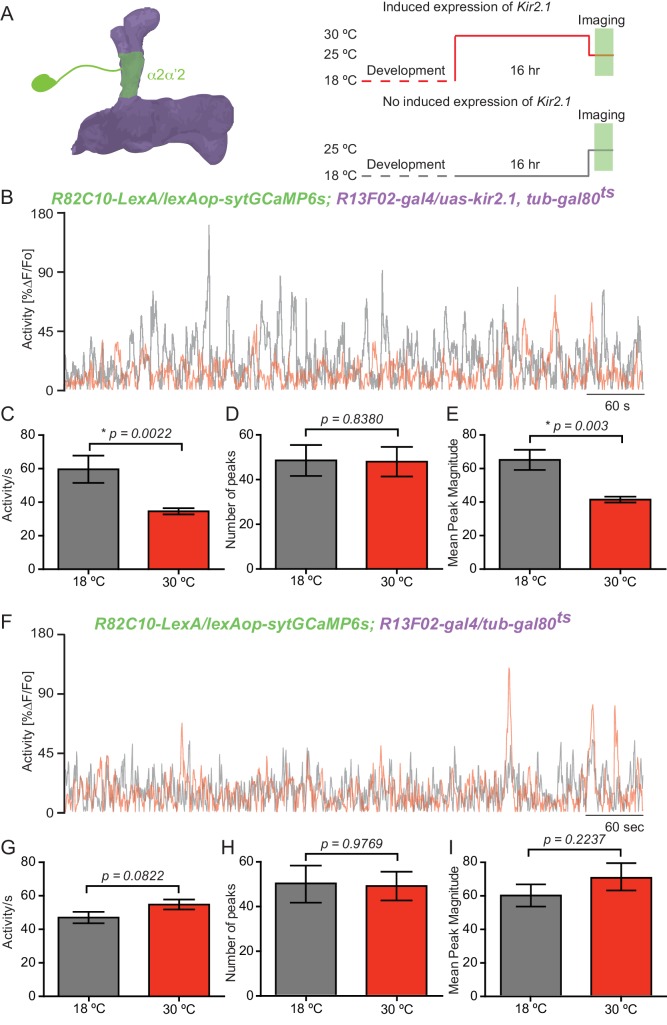
Figure 5. KC input shapes DAn ongoing activity.
(A) Diagram of the experimental setup. Flies of the indicated genotype were reared at 18°C and 1–2 day old adults were then switched to 30°C to induce kir2.1 channel expression in KC for 16 hr. The flies were then returned to room temperature and prepared for functional imaging. Control flies remained at 18°C until removing them to room temperature for functional imaging. (B) Representative 10 min recording of calcium ongoing activity in α2α’2 DA axon terminals in flies with (red) or without (black) kir2.1 expression in the KC. (C) Mean of total activity per sec during 10 min of recording of ongoing activity in α2α’2 DAn axon terminals in flies with (red) or without (black) kir2.1 expression in the KC. N = 10–12. Data were analyzed using Mann-Whitney U non-parametric test. Bars represent the mean ± SEM. (D) Mean number of peaks of the same 10 min recordings of ongoing activity in α2α’2 DAn axon terminals in flies with (red) or without (black) kir2.1 expression in the KC. Data were analyzed using Mann-Whitney U non-parametric test. Bars represent the mean ± SEM. (E) Mean peak magnitude of ongoing activity in α2α’2 DAn in flies with (red) or without (black) kir2.1 expression in the KC. Data were analyzed using Mann-Whitney U non-parametric test. Bars represent the mean ± SEM. (F–I) Parallel data to panels B–E but using flies without the kir2.1 transgene. These control data show that the decrease in total activity and mean peak magnitude observed in panels B and E require the kir2.1 expression. N = 11–13. Data were analyzed using Mann-Whitney U non-parametric test.

