

Abstract
Objective
Appropriate delivery of Emergency Department (ED) treatment to children with acute asthma requires clinician assessment of acute asthma severity. Various clinical scoring instruments exist to standardize assessment of acute asthma severity in the ED, but their selection remains arbitrary due to few published direct comparisons of their properties. Our objective was to test the feasibility of directly comparing properties of multiple scoring instruments in a pediatric ED.
Methods
Using a novel approach supported by a composite data collection form, clinicians categorized elements of 5 scoring instruments before and after initial treatment for 48 patients 2–18 years of age with acute asthma seen at the emergency department of a tertiary care pediatric hospital ED from August to December 2014. Scoring instruments were compared for inter-rater reliability between clinician types and their ability to predict hospitalization.
Results
Inter-rater reliability between clinician types was not different between instruments at any point and was lower (weighted kappa range 0.21 – 0.55) than values reported elsewhere. Predictive ability of most instruments for hospitalization was higher after treatment than before treatment (p<0.05) and may vary between instruments after treatment (p=0.054).
Conclusions
We demonstrate the feasibility of comparing multiple clinical scoring instruments simultaneously in ED clinical practice. Scoring instruments had higher predictive ability for hospitalization after treatment than before treatment and may differ in their predictive ability after initial treatment. Definitive conclusions about the best instrument or meaningful comparison between instruments will require a study with a larger sample size.
Keywords: Asthma, Child, Emergency Service (Hospital), Hospitalization, Decision Making, Validation Studies
Introduction
In 2013, acute asthma resulted in 679,643 ED visits and 70,429 hospitalizations in children 2–17 years old.[1] Hospitalization is a primary driver of direct costs for asthma in children,[2] contributing $3.4 billion of the $9.3 billion in total pediatric asthma costs in 2008.[3] A child’s risk of hospitalization is directly influenced by the selection and timing of ED treatments, such as the administration of ipratropium bromide,[4] intravenous magnesium sulfate,[5] the timely administration of a systemic steroid,[6] and use of continuous vs. intermittent albuterol.[7] However, ED delivery of these treatments is variable without explanation by patient factors[8, 9] and treatment delays in the ED are common[10] and affect a child’s risk of hospitalization.[6] For ED care to be delivered reliably and minimize hospitalization, treatment must be tailored to patient-specific levels of acute asthma severity and risk of hospitalization, as recommended in asthma guidelines.[11, 12] Pulmonary function testing and peak expiratory flow rate (PEFR) are proposed in guidelines to standardize assessment of acute asthma severity, but are not feasible for children in the ED,[13] necessitating alternate methods of patient assessment focusing primarily on clinical findings.
Unstructured assessments of acute asthma severity using clinical findings (e.g. without a scoring instrument) are too variable between ED clinicians (with low inter-rater reliability) to reliably discriminate clinically significant differences in patient’s acute asthma severity and guide treatment, determine risk of hospitalization, or determine response to treatment.[14] Structured scoring instruments have higher inter-rater reliability[14, 15] and can help categorize clinical findings into different categories of acute asthma severity and hospitalization risk.[16]
Dozens of scoring instruments have been developed for research and clinical use in pediatric acute asthma.[17] However, direct comparison of instruments is rare and challenging to accomplish in clinical settings. Prior studies have relied on sequential (e.g. one after the other) completion of different instruments on one patient by one clinician. Sequential completion is time-consuming, limiting direct comparisons during acute treatment to three instruments at most.[18] Also, clinicians were not sufficiently blinded to avoid bias affecting results (e.g. prior assessments influencing results of subsequent measurement of the same instrument or sequential measurement of other instruments).[16, 18] As a result of these limitations, the optimal instrument to reliably assess acute asthma severity is not known.[19] Direct and blinded comparison of existing scoring instruments is critical to guide evidence-based selection of instruments to reliably guide not only clinical care delivery, but also future quality improvement and research efforts in acute asthma care.[20] We have developed and implemented a novel approach using a composite data collection form to facilitate direct comparison of multiple scoring instruments in a clinical setting. Our objective is to demonstrate the feasibility of the novel approach to directly compare properties of multiple scoring instruments in a pediatric ED.
Methods
Definitions of Measurement Properties
Clinically important properties that determine an instrument’s ability to guide treatment include reliability and validity. Inter-rater reliability is a scoring instrument’s ability to produce a similar result in the same patient regardless of the clinician performing the assessment. Validity refers to an instrument’s ability to measure what it intends to measure. Criterion validity is the extent to which an instrument relates to a standard of measurement.[21] In the absence of a standard, criterion validity is replaced by criterion-concurrent validity, or the degree to which an instrument relates to other measurements.[17] In our study, criterion-concurrent validity includes the degree to which a score (1) correlates with clinical markers of severity such as hospitalization versus ED discharge and (2) compares with scores from other instruments.
Selection of scoring instruments for comparison
From a recent systematic review of 36 published pediatric acute asthma scoring instruments by Bekhof et al,[17] we selected instruments for comparison meeting three a priori criteria: 1) developed in an ED setting, 2) validated in children ages 2–17 years with acute asthma, and 3) previously evaluated for prediction of hospitalization, a measure of criterion-concurrent validity. Of the 36 scoring instruments, 22 were developed in an ED setting but only 3 met all our criteria: the Pediatric Respiratory Assessment Measure (PRAM), Pediatric Asthma Severity Score (PASS), and Pulmonary Index (PI). Each of these instruments was found in the systematic review to have 5 adequately tested elements of validity (of a possible 15). While the Clinical Asthma Score (CAS) did not meet our a priori criteria because it was developed in an inpatient setting, respiratory therapists at our ED use a local variant of the CAS for assessment of children with asthma. The CAS was also found by Bekhof et al. to have 5 adequately tested elements of validity. We also performed a literature search for instruments directly derived from those selected, resulting in discovery of a PRAM derivative, the Acute Asthma Intensity Research Score (AAIRS). We incorporated the CAS and AAIRS into the comparison tool. Because the CAS and AAIRS did not meet our a priori criteria but had relevance to local practice and tested instruments, we analyzed and reported results including these two instruments separately as a secondary analysis from our primary analysis comparing the PRAM, PASS, and PI.
Characteristics of selected instruments
Each instrument presents the clinician with a set of descriptors for a number of elements describing clinical findings, with each descriptor assigned a numerical value. The clinician selects descriptors and numerical values are summed to give the overall score. A reproduction of the selected instruments is presented in Table 1.
Table 1.
Included instruments
| Pediatric Respiratory Assessment Measure (PRAM) | |||||
|---|---|---|---|---|---|
| score | suprasternal retractions | scalene muscle contraction | air entry | wheezing | O2 saturation |
| 0 | absent | absent | normal | absent | ≥95% |
| 1 | decreased at bases | expiratory only | 92–94% | ||
| 2 | present | present | widespread decrease | inspiratory and expiratory | <92% |
| 3 | absent/minimal | audible without stethoscope/silent chest with minimal air entry | |||
| Acute Asthma Intensity Research Score (AAIRS) | |||||||
|---|---|---|---|---|---|---|---|
| score | sternocleidomastoid muscle retractions | intercostal muscle retractions | subcostal muscle retractions | air entry | wheezing | O2 saturation | expiratory phase |
| 0 | absent | absent | absent | normal | absent | ≥95 % | normal |
| 1 | decreased at bases | expiratory only | 92–94% | prolonged | |||
| 2 | present | present | present | widespread decrease | inspiratory and expiratory | <92 % | severely prolonged |
| 3 | absent/minimal | audible without stethoscope/silent chest with minimal air entry | |||||
| Pediatric Asthma Severity Score (PASS) | |||
|---|---|---|---|
| score | work of breathing | wheezing | prolongation of expiration |
| 0 | none or mild | none or mild | normal or mildly prolonged |
| 1 | moderate | moderate | moderately prolonged |
| 2 | severe | severe wheezing or absent wheezing due to poor air exchange | severely prolonged |
| Pulmonary Index (PI) | ||||
|---|---|---|---|---|
| score | accessory muscle use | wheezing | respiratory rate | inspiratory/expiratory ratio |
| 0 | 0 | none | ≤30 | “5:2” |
| 1 | “+/−” questionable increase | end expiration | 31–45 | “5:3–5:4” |
| 2 | “++” apparent increase | entire expiration | 46–60 | “1:1” |
| 3 | “+++” maximal increase | inspiration and expiration without stethoscope, or no wheezing due to minimal air entry | >60 | “<1:1” |
| Clinical Asthma Score (CAS) | |||||
|---|---|---|---|---|---|
| score | indrawing | wheezing | respiratory rate | Inspiratory - to- expiratory ratio | observed dyspnea |
| 0 | none | none | <40 | I>E | none |
| 1 | subcostal only | expiratory only | 40–60 | I=E | mild |
| 2 | subcostal and intercostal | inspiratory and expiratory | >60 | I<E | marked |
PRAM
The PRAM is a 13 point scale (0–12) originally tested and validated as the Preschool Respiratory Assessment Measure in children ages 3–6.[22] Further validation of the PRAM in 782 children ages 2–17 was published as the Pediatric Respiratory Assessment Measure[23] with measurement of inter-rater reliability, predictive ability for hospitalization before initial treatment (c statistic 0.78), after initial bronchodilation (c statistic 0.84), and using a combination of the initial PRAM and change in PRAM after initial treatment (c statistic 0.86). The PRAM has been shown in other populations to be predictive of hospitalization[24] and has been compared directly to PASS,[16] a Bayesian predictive model, clinician prediction,[25] and spirometry.[26]
PASS
The PASS is a 7 point (0–6) scale developed in 1,221 children ages 1–18 at two ED study sites.[27] Disposition, oxygen saturation, and peak expiratory flow rate were used as measures of criterion validity. AUC at the time of disposition at the two study sites was 0.83 and 0.85 for predicting actual admission, and 0.82 and 0.89 for predicting necessary hospital admission (by expert determination in retrospective chart review).
PI
The PI is a 13 point (0–12) scale modeled on an 11 point (0–10) retraction score devised in 1956 with the help of Virginia Apgar to measure respiratory distress in premature infants.[28] The PI was adapted and expanded in 1966 for bronchiolitis,[29] for pediatric asthma in 1971,[30] and further adapted as a 13 point (0–12) scale in 1974 for pediatric status asthmaticus.[31] Further validation in pediatric asthma in 1984 showed correlation with spirometry measures and hospital admission,[32] though a single investigator performed all ratings. The PI underwent further modification in 1990[33] and 1993,[34] and was compared to a comprehensive assessment of severity from a national asthma guideline in children 1–12 (AUC of 0.874).[35] In the current study, we use the version validated in pediatric acute asthma in 1984,[32] as further modifications did not undergo similar validation studies.
AAIRS
The AAIRS is a 17 point (0–16) derivative of the PRAM constructed to enable increased discrimination for research purposes.[36] It was shown in 661 children (mean age 8.8 years) to have greater variability than the PRAM (SD 3.53 versus 2.32) but inter-rater reliability and prediction for hospitalization has not been reported.
CAS
The CAS is an 11 point (0–10) scale developed in 58 children age 1–5 hospitalized for asthma.[37] Inter-rater reliability between two pediatricians and between one of those pediatricians and a research nurse demonstrated weighted kappa of 0.82 and 0.89 respectively. Validity was tested between CAS at hospital admission and length of stay (Spearman’s rank correlation 0.47) and each measurement of CAS with concurrent drug-dosing interval (−0.58).
Construction of the composite data collection form
We constructed a composite form to facilitate rapid and simultaneous collection of all elements of the 5 selected scoring instruments by different clinician types (e.g. physicians, nurses, respiratory therapists etc.), allowing direct comparison and blinding of clinicians to the numerical scores of each instrument. Text for elements and descriptors was transcribed verbatim from publications while avoiding duplication of identical elements, resulting in 20 unique findings and their descriptors. Elements and their descriptors were disassociated from the original instrument, stripped of numeric assignments, then grouped by types of clinical assessment (vital signs, retractions, air entry, wheezing, expiratory phase, dyspnea), and arranged on the front and back of a 2-sided composite data collection form. The front of the form included instructions for completion, areas to record the assessor’s clinical role, such as nurse (RN), physician (MD), nurse practitioner (NP), or respiratory therapist (RT), and the child’s age in years (Figure 1). The front of the form was completed before initial ED treatment, with the reverse of the form completed 15 minutes after initial ED treatment, including a data field for the child’s disposition (hospital admission or discharge home). In testing prior to actual data collection, clinicians completed one side of the form in less than 60 seconds.
Figure 1.

Composite data collection form
Study Setting and Population
The study was conducted at a 289 bed freestanding children’s hospital with an annual ED volume of approximately 1,000 encounters having a primary diagnosis of asthma. The hospital is affiliated with the Department of Pediatrics of the local University’s School of Medicine and serves as a tertiary care pediatric referral hospital for 5 states. The institutional review boards of the university and hospital approved this study with a waiver of informed consent.
Participants included members of the ED care team and a convenience sample of children ages 2–17 years presenting to the ED from August to December 2014 with a primary diagnosis of acute asthma defined as having the following:
a chief complaint of cough, difficulty breathing, chest pain, bronchospasm, asthma exacerbation, or reactive airways disease AND
a history of asthma or previous bronchospasm or prior response to albuterol AND
clinical evidence of decreased respiratory function, defined as: persistent cough, abdominal work of breathing, retractions, decreased air entry, wheezing, or breathlessness.
Data collection
Clinician participants were trained using an introductory video, online information, and in-person instruction by the principal investigator in staff meetings. Composite forms were stocked in all patient care areas of the ED and deposited in a locked box upon completion. Participating clinicians circled a single descriptor fitting their observation of the child during assessment for each of the form’s 20 elements. Multiple clinicians could complete a form on the same patient both before and after treatment. When using the form, clinicians were blinded to the numerical score of each instrument. Usual clinical care was not otherwise modified. Study forms were dropped by clinicians in a locked box for later data entry by the study team into a secure database.[38] The study principal investigator validated the accuracy of data entry by duplicate entry of 10% of fields, showing a 0.16% error rate, which was considered acceptable. After entry into the database, the original numerical value for each descriptor was reassigned, numerical values for each selected descriptor of each element summed for each instrument, and the resulting instrument score used in analysis. All reference to ‘instrument’ and ‘score’ in analysis, results, and discussion refer to values produced through this extraction of data collected with the composite data collection form.
Data Analysis
As a preliminary quantification of the ability of each instrument to detect change in patient status above measurement variation (a ratio of signal to noise) we calculated the effect size of each instrument, defined as the difference in mean score before and after treatment divided by the standard deviation of the score before treatment.[39] We used Cohen’s weighted kappa[40] to assess inter-rater reliability between clinician types for each instrument, and Fleiss’ kappa[41] to assess overall inter-rater reliability for instruments across all clinician types. Analysis was performed separately for scores obtained before and after treatment, avoiding any need to account for repeated measures in analysis. For weighted kappa and Fleiss’ kappa, bootstrap resampling was utilized to compare reliability between instruments using 1,000 bootstrap samples without replacement. To reduce the risk of a type 2 error due to small sample sizes, we assessed inter-rater reliability between clinician types who returned forms on 10 or more patients. The area under the receiver operating characteristic curve (AUC) was used to compare instruments’ prediction for hospitalization, using the average score of raters analyzed separately for scores before treatment, scores after treatment, and change in score divided by score after treatment. Primary analysis included PRAM, PASS, and PI, with secondary analysis adding AAIRS and CAS. For all comparisons, p<0.05 was considered significant following either Bonferroni adjustment for 3 pairwise comparisons (primary analysis), 10 pairwise comparisons (secondary analysis) or an omnibus F test for evaluation of simultaneous agreement.
Results
203 forms were returned for 48 patients during the study period. Mean patient age was 7.6 years (SD 3.9), median 6.5 years (IQR 4.75–10), and range 2–16 years. Hospitalization was the outcome of ED treatment in 45% of patients. On 11 of the 48 patients, only one clinician type completed forms, resulting in their exclusion from calculation of inter-rater reliability, though they were included in calculation of AUC for hospitalization. Disposition (hospitalization or discharge home) was unavailable for 6 patients, excluding them from calculation of AUC for hospitalization. Nurses, physicians, and respiratory therapists returned 54, 65, and 77 forms respectively. An insufficient number of forms were returned by nurse practitioners (7) to be analyzed as a separate clinician type. Median time between assessment before and after treatment was 87 minutes (mean 87 minutes, SD 31 minutes, range 20–165). Mean instrument scores and ranges are summarized in Table 2.
Table 2.
Description of raters and scores
| Before Treatment | ||||||
|---|---|---|---|---|---|---|
| All | PRAM | AAIRS | PI | PASS | CAS | |
| N (range) | 101 (1–11) |
102 (1–15) |
98 (0–11) |
102 (0–6) |
97 (1–9) |
|
| Frequency | Mean (SD) | |||||
| All Raters | 108 | 5.92 (2.42) |
8.45 (3.41) |
6.17 (2.13) |
2.73 (1.44) |
5.65 (1.84) |
| Nurse | 30 | 5.75 (2.44) |
8.04 (3.54) |
5.71 (2.07) |
2.50 (1.30) |
5.75 (1.94) |
| MD | 35 | 6.28 (2.67) |
8.64 (3.77) |
6.38 (2.09) |
2.83 (1.40) |
5.77 (2.00) |
| NP | 4 | 5.00 (1.83) |
7.75 (2.99) |
4.50 (1.29) |
2.00 (2.16) |
4.00 (0.82) |
| RT | 39 | 5.84 (2.27) |
8.66 (3.11) |
6.47 (2.20) |
2.86 (1.51) |
5.66 (1.70) |
| After Treatment | ||||||
| All | PRAM | AAIRS | PI | PASS | CAS | |
| N (range) | 89 (0–9) |
90 (0–13) |
88 (0–9) |
91 (0–4) |
93 (0–9) |
|
| Frequency | Mean (SD) | |||||
| All Raters | 95 | 2.64 (2.42) |
4.17 (3.15) |
3.59 (2.24) |
0.63 (1.08) |
3.00 (2.12) |
| Nurse | 24 | 2.90 (2.49) |
4.29 (3.18) |
3.62 (2.27) |
0.59 (0.96) |
3.38 (2.00) |
| MD | 30 | 2.64 (2.66) |
3.76 (3.50) |
3.74 (2.19) |
0.76 (1.18) |
2.93 (2.42) |
| NP | 3 | 1.33 (1.15) |
1.33 (1.15) |
0.67 (1.15) |
0.00 (0.00) |
1.00 (0.00) |
| RT | 38 | 2.59 (2.29) |
4.65 (2.88) |
3.70 (2.22) |
0.59 (1.11) |
2.97 (1.98) |
| Pooled Before and After Treatment | ||||||
| All | PRAM | AAIRS | PI | PASS | CAS | |
| N (range) | 190 (0–11) |
192 (0–15) |
186 (0–11) |
193 (0–6) |
190 (0–9) |
|
| Effect Size | −1.36 | −1.26 | −1.21 | −1.46 | −1.44 | |
| Frequency | Mean (SD) | |||||
| All Raters | 203 | 4.38 (2.92) |
6.44 (3.92) |
4.95 (2.53) |
1.74 (1.66) |
4.35 (2.38) |
| Nurse | 54 | 4.53 (2.82) |
6.40 (3.84) |
4.73 (2.39) |
1.63 (1.50) |
4.56 (2.29) |
| MD | 65 | 4.58 (3.21) |
6.35 (4.37) |
5.17 (2.50) |
1.89 (1.66) |
4.38 (2.62) |
| NP | 7 | 3.43 (2.44) |
5.00 (4.08) |
2.86 (2.34) |
1.14 (1.86) |
2.71 (1.70) |
| RT | 77 | 4.22 (2.79) |
6.68 (3.60) |
5.11 (2.60) |
1.73 (1.75) |
4.35 (2.27) |
PRAM = Pediatric Respiratory Assessment Measure; AAIRS = Acute Asthma Intensity Research Score; PASS = Pediatric Asthma Severity Score, PI = Pulmonary Index (PI); CAS = Clinical Asthma Score
For overall agreement among three raters, Fleiss’ kappa did not vary significantly among all instruments either before or after treatment in primary or secondary analysis. Inter-rater reliability was not significantly different between all instruments in any clinician pairings either before or after treatment in primary or secondary analysis (Table 3). After multiple comparison adjustment, inter-rater reliability was significantly different for MD and RT clinicians between PASS and PI (p=0.04).
Table 3.
Inter-rater reliability
| Fleiss’ kappa (95% CI) | Weighted Kappa (95% CI) | |||||||
|---|---|---|---|---|---|---|---|---|
| Overall | MD vs Nurse | MD vs RT | Nurse vs RT | |||||
|
Before treatment (overall p = 0.3957 |
After treatme nt (overall p = 0.8143) |
Before treatment (overall p = 0.9115) |
After treatment (overall p = 0.6976) |
Before treatment (overall p = 0.6106) |
After treatment (overall p = 0.1016) |
Before treatment (overall p = 0.7904) |
After treatment (overall p =) 0.4649 |
|
| PRA M | 0.3452 (0.2291, 0.4613) | 0.4026 (0.2657, 0.5394) | 0.5507 (0.4084, 0.6931) | 0.5155 (0.3532, 0.6778) | 0.4060 (0.2241, 0.5879) | 0.4511 (0.2712, 0.6310) | 0.3538 (0.1771, 0.5305) | 0.4807 (0.2713, 0.6901) |
| PI | 0.3451 (0.2146, 0.4756) | 0.3976 (0.2545, 0.5407) | 0.5391 (0.3834, 0.6949) | 0.4279 (0.1854, 0.6704) | 0.3487 (0.1908, 0.5066) | 0.5046 (0.3150, 0.6942) | 0.4300 (0.2655, 0.5945) | 0.4500 (0.2363, 0.6637) |
| PASS | 0.4157 (0.2808, 0.5507) | 0.4523 (0.2381, 0.6664) | 0.5023 (0.294, 0.7106) | 0.3632 (−0.0288, 0.7551) | 0.2956 (0.1004, 0.4908) | 0.2757 (0.0088, 0.5425) | 0.3681 (0.1384, 0.5978) | 0.5941 (0.2867, 0.9015) |
| Including CAS and AAIRS | Including CAS and AAIRS | Including CAS and AAIRS | Including CAS and AAIRS | |||||
| (overall p = 0.6074) | (overall p = 0.1505) | (overall p = 0.9923) | (overall p = 0.4945) | (overall p = 0.6192) | (overall p = 0.2173) | (overall p = 0.9570) | (overall p = 0.3781) | |
| CAS | 0.3355 (0.2020, 0.4691) | 0.2604 (0.1284, 0.3924) | 0.5168 (0.3531, 0.6806) | 0.2551 (0.0461, 0.4640) | 0.4459 (0.2444, 0.6474) | 0.3850 (0.2153, 0.5546) | 0.3991 (0.2172, 0.5809) | 0.3733 (0.1575, 0.5892) |
| AAIRS | 0.3885 (0.2694, 0.5077) | 0.3356 (0.2055, 0.4658) | 0.5359 (0.3591, 0.7127) | 0.4358 (0.2419, 0.6297) | 0.4123 (0.2184, 0.6063) | 0.4654 (0.2476, 0.6831) | 0.4234 (0.2237, 0.6231) | 0.5143 (0.3451, 0.6836) |
PRAM = Pediatric Respiratory Assessment Measure; AAIRS = Acute Asthma Intensity Research Score; PASS = Pediatric Asthma Severity Score, PI = Pulmonary Index (PI); CAS = Clinical Asthma Score
In primary analysis, predictive ability did not differ significantly between all instruments before (p=0.748) or after (p=0.054) initial treatment, a finding unchanged in secondary analysis both before (p=0.751, Table 4 and Figure 2) and after (p=0.059, Table 5 and Figure 3) initial treatment or when considering change in score divided by score after initial treatment. (Table 6 and Figure 4). In secondary analysis, the difference in AUC after treatment between the lowest performing (PASS) and highest performing instrument (AAIRS) was 0.2093 (95% CI 0.0753–0.3434, p=0.02) using Bonferroni multiple comparison adjustment. Predictive ability was significantly higher after initial treatment than before treatment in all instruments (p<0.05) but PASS (p=0.5). Considering change in score divided by score after initial treatment did not improve predictive ability.
Table 4.
Area Under ROC Curve predicting hospitalization after treatment
| ROC Model | Area | Standard Error | 95% Wald Confidence Limits | |
|---|---|---|---|---|
| PRAM | 0.8923 | 0.0472 | 0.7998 | 0.9849 |
| PI | 0.8361 | 0.0619 | 0.7147 | 0.9575 |
| PASS | 0.7213 | 0.0738 | 0.5767 | 0.8659 |
| P = 0.0541 | ||||
| Including CAS and AAIRS | ||||
| CAS | 0.8337 | 0.0624 | 0.7114 | 0.9560 |
| AAIRS | 0.9306 | 0.0362 | 0.8597 | 1.0000 |
| p = 0.0593 | ||||
Figure 2.
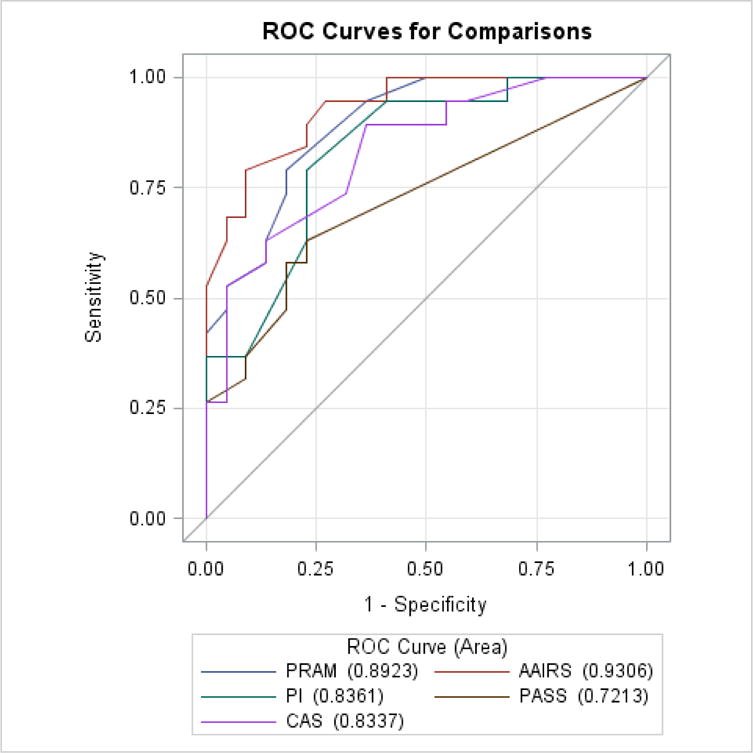
Area Under ROC Curve predicting hospitalization after treatment
Table 5.
Area Under ROC Curve predicting hospitalization before treatment
| ROC Model | Area | Standard Error | 95% Wald Confidence Limits | |
|---|---|---|---|---|
| PRAM | 0.7310 | 0.0864 | 0.5616 | 0.9004 |
| PI | 0.6754 | 0.0889 | 0.5011 | 0.8497 |
| PASS | 0.6769 | 0.0928 | 0.4950 | 0.8588 |
| P = 0.7480 | ||||
| Including CAS and AAIRS | ||||
| CAS | 0.6784 | 0.0949 | 0.4924 | 0.8643 |
| AAIRS | 0.7500 | 0.0838 | 0.5858 | 0.9142 |
| p = 0.7506 | ||||
Figure 3.

Area Under ROC Curve predicting hospitalization before treatment
Table 6.
Area Under ROC Curve predicting hospitalization for change in score relative to score after treatment
| ROC Model | Area | Standard Error | 95% Wald Confidence Limits | |
|---|---|---|---|---|
| PRAM | 0.8763 | 0.0536 | 0.7713 | 0.9813 |
| PI | 0.8500 | 0.0613 | 0.7299 | 0.9701 |
| PASS | 0.7987 | 0.0698 | 0.6619 | 0.9355 |
| p = 0.3560 | ||||
| Including CAS and AAIRS | ||||
| CAS | 0.8316 | 0.0650 | 0.7041 | 0.9591 |
| AAIRS | 0.9342 | 0.0364 | 0.8628 | 1.0000 |
| p = 0.1141 | ||||
Figure 4.
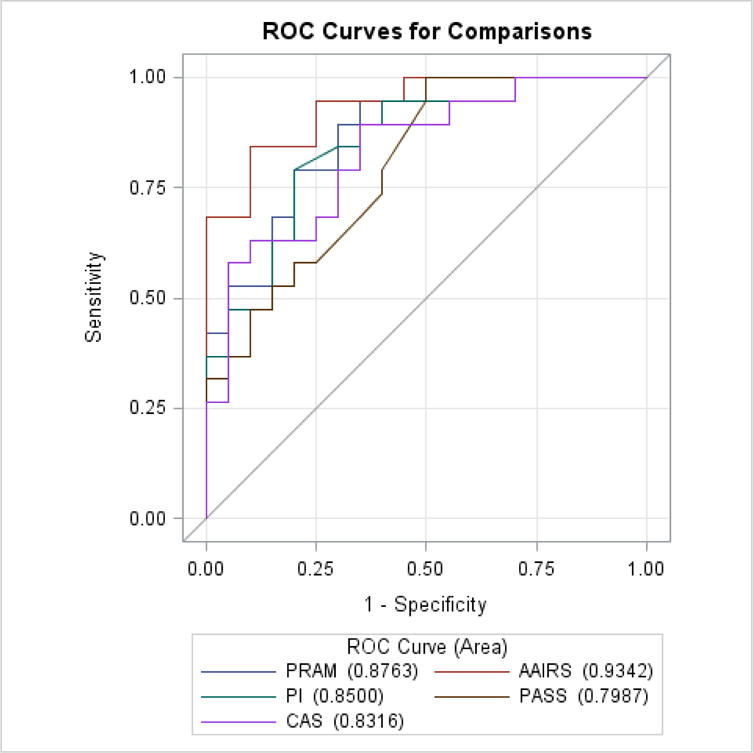
Area Under ROC Curve predicting hospitalization for change in score divided by score after treatment
Discussion
Our study demonstrates that concurrent comparison of multiple pediatric acute asthma scoring instruments in a busy ED setting is feasible using a composite data collection form that reduces bias described in previous studies by enabling simultaneous rather than sequential collection of instrument elements. Overall, we found a similar inter-rater reliability between all tested instruments both before and after treatment. However, there was a statistical difference in inter-rater reliability between MD and RT clinicians. Though all tested instruments did not show statistical differences (p<0.05) in their predictive ability for hospitalization, our evaluation of difference between instruments after initial treatment was near our stated threshold for statistical significance (p=0.054).
Predictive ability for hospitalization is an important clinical property of a scoring instrument and guides timely and appropriate delivery of ED asthma care to children at risk of hospitalization. Timely and appropriate delivery of ED treatment for acute asthma not only hastens symptom relief but also reduces the need for hospitalization.[5–7, 42] An instrument with higher predictive ability will help direct intensive treatment to children at higher risk of hospitalization and avoid over-treating those at lower risk. Similar to our finding of pairwise difference between AAIRS and PASS, Gouin et al.[16] reported significantly different AUC for prediction of hospitalization between PRAM and PASS 90 minutes after arrival in a sample of 283 patients. Though the size of our study sample was smaller, we anticipate finding similar differences between all tested instruments with a larger sample size.
Our finding that predictive ability was better after treatment than before treatment for most tested instruments support previous findings.[16, 23] Change in score divided by score after treatment did not improve prediction in our study, while this combination did show better predictive ability for hospitalization than scores after treatment in original validation of the PRAM.[23] Our study, the original validation of the PRAM,[23] and the comparison of instruments by Gouin et al.[16] highlight the importance of using scores after treatment to guide interventions aimed at avoiding hospitalization.
In our study, inter-rater reliability was not different between tested instruments. Overall, we found a moderate (kappa ranging between 0.26–0.59) inter-rater reliability, which is lower than reported for different clinician types in validation of the PASS (kappa 0.72, 95% CI 0.60–0.83)[27] and PRAM (kappa 0.78, 95% CI 0.74–0.83),[23] and much lower than reported for the PI (kappa 0.83 between similar raters)[34] and CAS (kappa 0.89 between two raters).[37] Compared to previous studies, blinding in our study may have produced low but more accurate measurements of inter-rater reliability, as does a broad pool of nurses and physicians naïve to selected instruments, similar to original validation of the PASS.[27] Low reliability of some of these same instruments has been reported recently in a video-based comparison of instruments by Eggink et al..[43] Our results may be more accurate as they reflect performance of these instruments under actual clinical practice in an academic pediatric emergency department.
Dozens of scoring instruments for pediatric acute asthma exist.[17] However, direct comparison of instruments remains rare and challenging to accomplish in clinical settings. Prior studies have primarily focused on sequential completion of different instruments but sequential completion is time-consuming, limiting direct comparisons to few instruments. The only previous direct comparison of the predictive ability of two instruments by Gouin et al.[16] did not blind the research participants (RT), which allowed prior instrument scores to influence subsequent scores. Scores were determined by sequential application of instruments (PASS and PRAM) individually, an approach that makes it challenging to compare multiple instruments simultaneously. Our approach with use of the composite data collection form addresses limitations of prior studies by allowing blinded, rapid, and concurrent collection of key elements of various scoring instruments at any time point by a variety of clinician types on the same patient in a clinical setting. This method is not limited to the instruments evaluated in this study, and may accommodate more than 5 instruments for comparison.
Limitations
Our study has several limitations. First, our study was conducted in a single site with a small sample size and multiple comparisons, limiting our estimates’ precision. However, our study was intended to evaluate feasibility of comparing multiple scoring instruments simultaneously and to provide preliminary findings to inform a larger study. Studies with larger sample size are needed to confirm our findings and more precisely determine the actual performance of scoring instruments, and that our results could help facilitate the design and planning of future studies. Second, we did not measure inter-rater reliability within clinician types, an important factor to reduce unnecessary variation in care delivery. Our study focused only on measuring inter-rater reliability between clinician types, reflecting collaborative care delivery and a setting where agreement in severity assessment between different clinician types is necessary to direct care. Assessment of inter-rater reliability within clinician types would be valuable in future studies. Third, inter-rater reliability testing between clinician types was limited to clinician types with at least 10 assessments (excluding those with less than 10 assessments). Therefore, inter-rater reliability testing of the same instruments at non-academic centers including smaller centers and rural facilities staffed with fewer clinicians who share a homogenous approach to assessment, could yield different results. Similar to our study which involved a single academic center, prior reliability testing of these instruments has been conducted only in academic medical centers and generalizations of findings beyond academic centers need to be taken with caution. Validation of the reliability of these instruments in individual clinical settings prior to implementation is reasonable. Fourth, our data was collected using a convenience sample, possibly introducing selection bias in the population assessed. However, the percent of studied patients hospitalized, 45%, was similar to the overall percentage of children with asthma hospitalized from the PCH ED over the study period, 47%, suggesting a similar patient mix. Fifth, our use of hospitalization as a target for prediction accuracy introduces an outcome that is a decision known to be widely variable between pediatric EDs[44] and between individual ED physicians, regardless of disease severity.[45] The original validation of the PASS determined appropriateness of hospitalization decisions by expert review,[27] which we did not use. Future studies to determine which instruments provide early prediction of necessary hospitalization (a marker of severe patient physiology) versus prediction of actual hospitalization (influenced by physician decision-making) are warranted. Sixth, in our study, we deconstructed individual elements of various scoring instruments to create the composite form. Deconstruction of instrument elements may introduce unrecognized biases, such as unintentional priming from early elements influencing response to later elements, although such effects have not been described in the literature for asthma scoring instruments. Seventh, while our method improves on the blinding of prior studies, we cannot conclude that clinicians were completely blinded from the influence of study procedures. The mere act of categorizing elements of a physical exam may have altered perception of the patients’ physiologic state, influencing clinicians’ treatment and disposition decisions. Last, due to the nature of our study design, we are unable to assess the time needed to complete individual instruments or the impact of instrument completion on the timeliness of care delivery or patient outcomes. Future study is needed to determine the impact of asthma scoring instruments on the delivery of acute asthma care in the ED and whether they help decrease the need for hospitalization.
Conclusion
We demonstrated the feasibility of comparing multiple asthma scoring instruments in clinical practice using a composite data collection form that allows direct and simultaneous comparison while minimizing bias due to unblinding. Scoring instruments have higher predictive ability for hospitalization after initial treatment and may differ in their predictive ability after initial treatment. This composite form can be used to facilitate further research to determine the best instrument to support delivery of consistent and optimal ED asthma care across institutions.
What’s Known on This Subject
Numerous scoring instruments of acute asthma severity are used in emergency departments to assess children with acute asthma and deliver treatment. However, selection of instruments for clinical care remains arbitrary and the optimal instrument is unknown.
What this Study Adds
We report a method that facilitates direct, blinded comparison of multiple scoring instruments of acute asthma severity. Using this method, tested scoring instruments are shown to vary in their predictive ability for hospitalization.
Acknowledgments
Funding source
This investigation was supported by the University of Utah Study Design and Biostatistics Center, with funding in part from the National Center for Research Resources and the National Center for Advancing Translational Sciences, National Institutes of Health, through Grant 5UL1TR001067-02 (formerly 8UL1TR000105 and UL1RR025764).
Abbreviations
- ED
Emergency Department
- AUC
Area Under the Receiver-Operating Curve
- PRAM
Pediatric Respiratory Assessment Measure
- PASS
Pediatric Asthma Severity Score
- PI
Pulmonary Index
- CAS
Clinical Asthma Score
- AAIRS
Acute Asthma Intensity Research Score
Footnotes
Contributor’s Statement:
Dr. Johnson conceptualized and designed the study, drafted all data collection instruments, directed all aspects of data collection, verified the fidelity of data entry, contributed substantially to analysis planning, assisted with analysis, wrote the first and subsequent drafts of the manuscript, and approved the final manuscript submitted.
Dr. Nkoy contributed substantially to the conceptualization and design of the study and critically revised manuscript drafts.
Dr. Sheng contributed substantially to analysis planning, analyzed study data, drafted portions of the manuscript, and reviewed and refined manuscript drafts.
Dr. Greene contributed substantially to the design of the study and to analysis planning, and reviewed and refined manuscript drafts.
Dr. Stone contributed substantially to the conceptualization and design of the study and critically revised manuscript drafts.
Dr. Garvin contributed substantially to the conceptualization and design of the study and critically revised manuscript drafts.
Declaration of interest
The authors report no conflicts of interest. The authors alone are responsible for the content and writing of the paper
Financial Disclosure
There are no financial relationships relevant to this work for any authors.
References
- 1.Agency for Healthcare Research and Quality. HCUPnet, Healthcare Cost and Utilization Project. Rockville, MD: [Google Scholar]
- 2.Bahadori K, Doyle-Waters MM, Marra C, et al. Economic burden of asthma: a systematic review. BMC Pulm Med. 2009;9:24. doi: 10.1186/1471-2466-9-24. [DOI] [PMC free article] [PubMed] [Google Scholar]
- 3.Roemer M. Health Care Expenditures for the Five Most Common Children’s Conditions, 2008: Estimates for U.S Civilian Noninstitutionalized Children, Ages 0–17. 2011 [Google Scholar]
- 4.Griffiths B, Ducharme F. Combined inhaled anticholinergics and short-acting beta-agonists for initial treatment of acute asthma in children (Review) Cochrane database Syst Rev. 2013 doi: 10.1002/14651858. [DOI] [PMC free article] [PubMed] [Google Scholar]
- 5.Shan Z, Rong Y, Yang W, et al. Intravenous and nebulized magnesium sulfate for treating acute asthma in adults and children: a systematic review and meta-analysis. Respir Med. 2013;107:321–30. doi: 10.1016/j.rmed.2012.12.001. [DOI] [PubMed] [Google Scholar]
- 6.Bhogal SK, McGillivray D, Bourbeau J, et al. Early administration of systemic corticosteroids reduces hospital admission rates for children with moderate and severe asthma exacerbation. Ann Emerg Med. 2012;60:84–91.e3. doi: 10.1016/j.annemergmed.2011.12.027. [DOI] [PubMed] [Google Scholar]
- 7.Camargo CA. Continuous versus intermittent beta-agonists for acute asthma. Cochrane Database Syst Rev. doi: 10.1002/14651858.CD001115. [DOI] [PMC free article] [PubMed] [Google Scholar]
- 8.Cheung CRLH, Gray JaM. Unwarranted variation in health care for children and young people. Arch Dis Child. 2013;98:60–5. doi: 10.1136/archdischild-2012-302041. [DOI] [PubMed] [Google Scholar]
- 9.Kharbanda AB, Hall M, Shah SS, et al. Variation in resource utilization across a national sample of pediatric emergency departments. J Pediatr. 2013;163:230–6. doi: 10.1016/j.jpeds.2012.12.013. [DOI] [PubMed] [Google Scholar]
- 10.Bhogal SK. A question of time: systemic corticosteroids in managing acute asthma in children. Curr Opin Pulm Med. 2013;19:73–8. doi: 10.1097/MCP.0b013e32835b590a. [DOI] [PubMed] [Google Scholar]
- 11.Global Initiative for Asthma. Global Strategy for Asthma Management and Prevention. 2014 www.ginasthma.org.
- 12.National Asthma Education and Prevention Program. Guidelines for the Diagnosis and Management of Asthma. National Heart Lung and Blood Institue, National Institutes of Health, U.S. Department of Health and Human Services; Oct, 2007. [Google Scholar]
- 13.Gorelick MH, Stevens MW, Schultz T, et al. Difficulty in obtaining peak expiratory flow measurements in children with acute asthma. Pediatr Emerg Care. 2004;20:22–6. doi: 10.1097/01.pec.0000106239.72265.16. [DOI] [PubMed] [Google Scholar]
- 14.Bekhof J, Reimink R, Bartels I-M, et al. Large observer variation of clinical assessment of dyspnoeic wheezing children. Arch Dis Child. 2015;0:1–5. doi: 10.1136/archdischild-2014-307143. [DOI] [PubMed] [Google Scholar]
- 15.Stevens MW, Gorelick MH, Schultz T. Interrater Agreement in the Clinical Evaluation of Acute Pediatric Asthma. J Asthma. 2003;40:311–315. doi: 10.1081/jas-120018630. [DOI] [PubMed] [Google Scholar]
- 16.Gouin S, Robidas I, Gravel J, et al. Prospective evaluation of two clinical scores for acute asthma in children 18 months to 7 years of age. Acad Emerg Med. 2010;17:598–603. doi: 10.1111/j.1553-2712.2010.00775.x. [DOI] [PubMed] [Google Scholar]
- 17.Bekhof J, Reimink R, Brand PLP. Systematic review: Insufficient validation of clinical scores for the assessment of acute dyspnoea in wheezing children. Paediatr Respir Rev. 2014;15:98–112. doi: 10.1016/j.prrv.2013.08.004. [DOI] [PubMed] [Google Scholar]
- 18.Arnold DH, Gebretsadik T, Abramo TJ, et al. The RAD score: a simple acute asthma severity score compares favorably to more complex scores. Ann Allergy Asthma Immunol. 2011;107:22–8. doi: 10.1016/j.anai.2011.03.011. [DOI] [PMC free article] [PubMed] [Google Scholar]
- 19.Fuhlbrigge A, Peden D, Apter AJ, et al. Asthma outcomes: exacerbations. J Allergy Clin Immunol. 2012;129:S34–48. doi: 10.1016/j.jaci.2011.12.983. [DOI] [PMC free article] [PubMed] [Google Scholar]
- 20.Birken CS, Parkin PC, Macarthur C. Asthma severity scores for preschoolers displayed weaknesses in reliability, validity, and responsiveness. J Clin Epidemiol. 2004;57:1177–81. doi: 10.1016/j.jclinepi.2004.02.016. [DOI] [PubMed] [Google Scholar]
- 21.Guyatt GH, Kirshner B, Jaeschke R. Measuring health status: What are the necessary measurement properties? J Clin Epidemiol. 1992;45:1341–1345. doi: 10.1016/0895-4356(92)90194-r. [DOI] [PubMed] [Google Scholar]
- 22.Chalut DS, Ducharme FM, Davis GM. The Preschool Respiratory Assessment Measure (PRAM): a responsive index of acute asthma severity. J Pediatr. 2000;137:762–8. doi: 10.1067/mpd.2000.110121. [DOI] [PubMed] [Google Scholar]
- 23.Ducharme FM, Chalut D, Plotnick L, et al. The Pediatric Respiratory Assessment Measure: a valid clinical score for assessing acute asthma severity from toddlers to teenagers. J Pediatr. 2008;152:476–80. 480.e1. doi: 10.1016/j.jpeds.2007.08.034. [DOI] [PubMed] [Google Scholar]
- 24.Alnaji F, Zemek R, Barrowman N, et al. PRAM score as predictor of pediatric asthma hospitalization. Acad Emerg Med. 2014;21:872–8. doi: 10.1111/acem.12422. [DOI] [PubMed] [Google Scholar]
- 25.Farion KJ, Wilk S, Michalowski W, et al. Comparing Predictions Made by a Prediction Model, Clinical Score, and Physicians: Pediatric asthma exacerbations in the emergency department. Appl Clin Inform. 2013;4:376–91. doi: 10.4338/ACI-2013-04-RA-0029. [DOI] [PMC free article] [PubMed] [Google Scholar]
- 26.Arnold DH, Gebretsadik T, Hartert TV. Spirometry and PRAM severity score changes during pediatric acute asthma exacerbation treatment in a pediatric emergency department. J Asthma. 2013;50:204–8. doi: 10.3109/02770903.2012.752503. [DOI] [PMC free article] [PubMed] [Google Scholar]
- 27.Gorelick M, Stevens M. Performance of a novel clinical score, the Pediatric Asthma Severity Score (PASS), in the evaluation of acute asthma. Acad Emerg Med. 2004:10–18. doi: 10.1197/j.aem.2003.07.015. [DOI] [PubMed] [Google Scholar]
- 28.Silverman WA, Andersen DH. A controlled clinical trial of effects of water mist on obstructive respiratory signs, death rate and necropsy findings among premature infants. Pediatrics. 1956;17:1–10. [PubMed] [Google Scholar]
- 29.Dabbous IA, Tkachyk JS, Stamm SJ. A double blind study on the effects of corticosteroids in the treatment of bronchiolitis. Pediatrics. 1966;37:477–484. [PubMed] [Google Scholar]
- 30.Pierson WE, Bierman CW, Stamm SJ, et al. Double-blind trial of aminophylline in status asthmaticus. Pediatrics. 1971;48:642–646. [PubMed] [Google Scholar]
- 31.Shapiro GG, Eggleston PA, Pierson WE, et al. Double-blind study of the effectiveness of a broad spectrum antibiotic in status asthmaticus. Pediatrics. 1974;53:867–872. [PubMed] [Google Scholar]
- 32.Becker A, Nelson N, Simons F. The Pulmonary Index Assessment of a Clinical Score for Asthma. Am J Dis Child. 1984;138:11–13. doi: 10.1001/archpedi.1984.02140440058015. [DOI] [PubMed] [Google Scholar]
- 33.Tal A, Levy N, Bearman JE. Methylprednisolone therapy for acute asthma in infants and toddlers: a controlled clinical trial. Pediatrics. 1990;86:350–356. [PubMed] [Google Scholar]
- 34.Scarfone R, Fuchs S, Nager A, et al. Controlled Trial of Oral Prednisone in the Emergency Department Treatment of Children With Acute Asthma. Pediatrics. 1993;92:513–518. [PubMed] [Google Scholar]
- 35.Hsu P, Lam LT, Browne G. The pulmonary index score as a clinical assessment tool for acute childhood asthma. Ann Allergy Asthma Immunol. 2010;105:425–9. doi: 10.1016/j.anai.2010.10.009. [DOI] [PubMed] [Google Scholar]
- 36.Arnold D, Saville B. Performance of the Acute Asthma Intensity Research Score (AAIRS) for acute asthma research protocols. Ann allergy, asthma Immunol. 2012;109:78–79. doi: 10.1016/j.anai.2012.05.007. [DOI] [PMC free article] [PubMed] [Google Scholar]
- 37.Parkin PC, Macarthur C, Saunders NR, et al. Development of a clinical asthma score for use in hospitalized children between 1 and 5 years of age. J Clin Epidemiol. 1996;49:821–825. doi: 10.1016/0895-4356(96)00027-3. [DOI] [PubMed] [Google Scholar]
- 38.Harris PA, Taylor R, Thielke R, et al. Research electronic data capture (REDCap) - A metadata-driven methodology and workflow process for providing translational research informatics support. J Biomed Inform. 2009;42:377–381. doi: 10.1016/j.jbi.2008.08.010. [DOI] [PMC free article] [PubMed] [Google Scholar]
- 39.Kazis LE, Anderson JJ, Meenan RF. Effect sizes for interpreting changes in health status. Med Care. 1989;27:S178–89. doi: 10.1097/00005650-198903001-00015. [DOI] [PubMed] [Google Scholar]
- 40.Cohen J. Weighted kappa: Nominal scale agreement provision for scaled disagreement or partial credit. Psychol Bull. 1968;70:213–220. doi: 10.1037/h0026256. [DOI] [PubMed] [Google Scholar]
- 41.Fleiss JL, Levin B, Paik MC. The measurement of interrater agreement. Statistical Methods for Rates and Proportions. 2003:598–626. [Google Scholar]
- 42.Zorc JJ, Pusic MV, Ogborn CJ, et al. Ipratropium bromide added to asthma treatment in the pediatric emergency department. Pediatrics. 1999;103:748–752. doi: 10.1542/peds.103.4.748. [DOI] [PubMed] [Google Scholar]
- 43.Bourgeois FT, Monuteaux MC, Stack AM, et al. Variation in Emergency Department Admission Rates in US Children’s Hospitals. Pediatrics. 2014;134:539–545. doi: 10.1542/peds.2014-1278. [DOI] [PMC free article] [PubMed] [Google Scholar]
- 44.Dean NC, Jones JP, Aronsky D, et al. Hospital admission decision for patients with community-acquired pneumonia: Variability among physicians in an emergency department. Ann Emerg Med. 2012;59:35–41. doi: 10.1016/j.annemergmed.2011.07.032. [DOI] [PMC free article] [PubMed] [Google Scholar]