

Abstract
Despite longstanding interest in the evolution and maintenance of discrete phenotypic polymorphisms, the molecular genetic basis of such polymorphism in the wild is largely unknown. Female sex-associated blotched color polymorphisms found in cichlids of Lake Malawi, East Africa represent a highly successful polymorphic phenotype, found and maintained in four genera across the geographic expanse of the lake. Previously, we identified an association with an allelic variant of the paired-box transcription factor gene pax7a and blotched color morphs in Lake Malawi cichlid fishes. Though a diverse range of blotched phenotypes are present in Lake Malawi cichlid species, they all appeared to result from an allele of pax7a that produces increased levels of transcript. Here, we examine the developmental and genetic basis of variation among blotched morphs. First, we confirm that pax7a-associated blotch morphs result primarily from modulation of melanophore development and survival. From lab crosses and natural population studies, we identify at least three alleles of pax7a associated with discrete subtypes of blotched morphs, in addition to the ancestral pax7a allele. Genotypes at pax7a support initial evolution of a novel pax7a allele to produce the blotched class of morphs, followed by subsequent evolution of that pax7a blotched allele to produce additional alleles associated with discrete color morphs. Variant alleles of pax7a produce different levels of pax7a transcript, correlating with pigmentation phenotype at the cellular level. This naturally selected allelic series should serve as a case study for understanding the molecular genetic control of pax7a expression and the evolution of sex-associated alleles.
Keywords: cichlid fish, allelic series, pax7, pigmentation, color morphs
Background
The evolution of novel adaptive phenotypes ultimately relies on the evolution of new alleles. Numerous studies have identified alleles underlying pigmentation patterns, a class of phenotypes that are both charismatic and readily apparent, and which provide an adaptive benefit to organisms (Hubbard et al. 2010). Where discrete pigment patterns segregate in a single population, the maintenance of multiple morphs is referred to as color polymorphism. Classic examples include light and melanic morphs in the peppered moth, diverse male nuptial color in guppies, and multiple mimicry morphs in butterflies (van’t Hof et al. 2011; Winge 1927; Joron et al. 2011). Color polymorphism is fascinating in part because it runs counter to immediate evolutionary expectations - that one morph should have the highest fitness and be fixed in populations by outcompeting other variants (Fisher 1931). Maintenance of color polymorphisms can be explained as the outcome of phenomena such as heterosis or frequency-dependent selection, yet the genetic basis underlying most cases of multiple discrete morphs is poorly understood.
Color polymorphism occurs routinely in populations of cichlid fish from Lake Malawi, East Africa. Diversity of pigment pattern is a hallmark of the highly speciose radiation of East African cichlid fish, with striking variation below the species level both between and within populations (Allender et al. 2003; Konings 2007). One level of diversity is contributed by sexual dimorphism of pigmentation, which in turn reflects the interplay of sexual and natural selection. Male nuptial color is bright, gaudy, and species-specific for attracting mates (van Oppen et al. 1998; Knight et al. 1998), but appears to incur higher predation risk (Trewavas, 1938). Female color is generally drab and cryptic (Konings 2007; Dalton et al. 2010), likely reducing aggression and predation, especially important during mouth-brooding when females are relatively defenseless for long periods of time. In both sexes, pigmentation appears to be a key fitness component.
In Lake Malawi cichlids, overall pigmentation color and patterning result from the interaction of three chromatophore cell populations. Melanophores produce melanin for dark black color, xanthophores concentrate dietary carotenoids to produce yellows and reds, and iridophores use light-reflecting guanine platelets to create blues and whites (Kelsh 2004). While most pigmentation characters are specific and uniform within species, morphs with random melanic blotching also occur. These blotched pigment morphs are found in numerous species and populations of East African cichlid fish in Lake Malawi and Lake Victoria, as well as in many of Lake Victoria's satellite lakes (Lande et al. 2001). In an overt sense, dark blotches result from clustering of melanophores, with the amelanic spaces between blotches revealing background body coloration that is produced by xanthophores and iridophores. Blotched morphs are sex-associated and generally found only in females, though rare blotched males exist (Lande et al. 2001; Holzberg 1978). In populations where they occur, one or more blotched morphs usually segregate with the ancestral plain (P) female morph, thus resulting in color polymorphism.
In Lake Malawi, blotched color polymorphisms are found in species across four genera: Metriaclima, Labeotropheus, Tropheops, and Genyochromis (Konings 2007). Within Lake Malawi cichlids, the putative genetic basis of blotched pigmentation is a dominant allele of the paired-box transcription factor pax7a that has no protein-coding polymorphism, but does produce higher levels of transcript than the ancestral pax7a allele (Roberts et al. 2009). The pax7ablotch allele is in tight genetic linkage with a female sex determination locus, explaining the strong phenotypic association between blotched pigmentation and sex (Ser et al. 2010). Across several species and four genera, and the entire geographic expanse of the lake, the same single nucleotide polymorphism (SNP) haplotype was found at the pax7ablotch allele, indicating a single evolutionary origin for the pax7ablotch allele, followed by subsequent spread of the allele via phylogenetic sorting and/or hybridization during speciation (Roberts et al. 2009).
Significant variation in inter- and intra-population phenotypic expression of the blotched trait occurs along several axes, including degree of blotching, size of blotches, and background body color (Fig. 1). Dark, melanic morphs are found (Fig. 1C), as are essentially non-blotched morphs (Fig. 1D) with only sparse and scattered melanophores. Additionally, background body coloration can range from white through yellow to intense orange, depending on contributions from iridophore and xanthophore cell populations. This diversity has often been subdivided into "orange blotch", "orange", "white blotch", and "white" (OB, O, WhB, and Wh, respectively) morphs by cichlid researchers. Genetic evidence in Lake Malawi cichlids supports that the primary genetic basis for the presence of all of these morphs is heterozygosity for the pax7ablotch allele (Roberts et al. 2009; Ser et al. 2010). This runs counter to previous hypotheses that nearly amelanic O and Wh morphs simply result from homozygosity for an OB or WhB allele (Lande et al. 2001); however, OB homozygous individuals or populations may remain unstudied. In some populations multiple morphs can be found in a single species, recapitulating variation in blotching found across species (Fig. 1 B–E vs. H–J). In cases of intrapopulation variation in blotching, there appears to be discrete classes of morphs based on degree of blotching (Fig. S1, Supporting Information).
Figure 1. Phenotypic diversity within the blotched class of pigment morphs.

(A, F) Representative male nuptial coloration, (B–E, H–J) Diversity of morph phenotypes in females, (A, B) M. tarakiki Mbamba Bay, (C) M. xanstomachus Maleri Island, (D) M. pyrsonotus Nakantenga Island, (E) M. callainos Nankoma Island, (F–J) L. trewavasae Thumbi West. (A, F, G) P morph, (B, C, H) OB morph, (D, E, I) OL morph, (J) OE morph. See Table 1 for additional details.
Here, we examine more closely the basis for additional phenotypic diversity within the blotched class of pigment morphs, where there is clear variation in the degree of blotching and relative numbers of melanophores and other pigment cell types (Fig. 1). We describe the developmental progression of blotched pigmentation at the cellular level, and provide evidence for tuning of pax7a gene expression by allelic evolution. Based on population genetic studies, we suggest a model whereby an initial pax7ablotch allele evolved to produce a heavily blotched color morph, and subsequent evolution of that allele resulted in additional alleles producing low- and non-blotched morphs.
Materials and Methods
Animals
Fish were sampled directly from Lake Malawi. Live fish collected at the lake were used to establish breeding lines of seven species (Table 1) at the University of Maryland, and were maintained and euthanized according to IACUC guidelines. Species were sampled opportunistically at the lake, given practical limitations relating to the proximity of fish populations to research station and export operation. Labeotropheus trewavasae from Thumbi West Island was chosen as a focal population for study due to the apparent presence of four discrete female morphs. The lines represent three of the four genera segregating the blotch polymorphism (the fourth, Genyochromis, is specialized to eat the fins of other fish, making it problematic to keep in captivity). Additional population surveys were made of Metriaclima zebra at Makonde and M. zebra ‘blaze’ at Manda due to the presence of three female morphs in each, though it was not possible to export live fish from these populations. All species studied are mouth-brooders, thus maternity was readily determined by collecting embryos from the mouth of the dam a few days post-fertilization. Laboratory Labeotropheus trewavasae breeding lines were structured in multiple breeding groups containing a dominant plain morph male and females of all four pigmentation morphs. Larval fish were maintained in circulating water flasks until yolk absorption. Broods segregating blotch morph alleles were examined weekly by eye for overt appearance of blotching, with divergence time indicating when siblings could be readily sorted by plain versus blotch morph. Fin samples taken in the lab or at the lake were stored in high-salt DNA preservation buffer until DNA extraction with standard Proteinase K digestion protocols.
Table 1.
Laboratory lines by species, location, and blotch color morph.
| species | location | morph1 | onset2 | image3 |
|---|---|---|---|---|
| Labeotropheus trewavasae | Thumbi West Island | OE | 1 | J |
| Labeotropheus trewavasae | Mpanga Reef | OL | 6 | - |
| Labeotropheus trewavasae | Thumbi West Island | OL | 6 | I |
| Metriaclima callainos | Nankoma Island | OL (Wh) | 5 | E |
| Metriaclima pyrsonotus | Nakantenga Reef | OL | 3 | D |
| Labeotropheus trewavasae | Thumbi West Island | OB | 10 | H |
| Metriaclima fainzilberi | Lundo Island | OB | 10 | - |
| Metriaclima tarakiki | Mbamba Bay | OB | 10 | B |
| Metriaclima mbenjii | Mbenjii Island | OB | 10 | - |
| Tropheops sp. ‘red cheek’ | Thumbi West Island | OB | 10 | - |
Adult blotched morph appearance: OE, orange-early; OL, orange-late; OB, orange blotched.
Time of overt blotched morph divergence from P morph sibs, weeks post-fertilization.
Panel in Fig. 1 for representative image.
Chromatophore analysis
Live fish were placed in a solution of 0.25 mg/ml norepinephrine (Sigma) and 0.2 mg/ml MS-222 (Tricaine methanesulfonate, Argent Chemical Labs) for five minutes to induce melanophore contraction and sedation, respectively. Photographs of splayed tailfin were taken using a Leica dissection microscope with transmitted light. Melanophore counts were performed from images in 1.6 mm2 fields, with representative regions normalized across individuals using fin ray segments as landmarks. The ‘Analyze Particles’ function in Image/J was used to measure melanophore number and size in fields following uniform thresholding of raw images (Abramoff et al. 2004). Particle count results were visually inspected to correct for artifacts resulting from overlapping melanophores. We were unable to directly count xanthophores in juvenile cichlids due to extensive cell overlap and inconsistent xanthophore response to epinephrine. We thus used a proxy yellow score determined as follows: A CMYK histogram was created for representative fields from caudal fin images in Adobe Photoshop, and the mean yellow (Y) value was measured. The yellow value is output on a scale of 0 to 255, with lower values corresponding to more yellow. This was subtracted from 255 to give more biologically interpretable results, with higher values corresponding to more yellow in the image. It should be noted that this is an imperfect measure for xanthophores, since melanophore and iridophore cell populations can affect the yellow value.
Genotyping
Microsatellites were identified near pax7a using the Metriclima zebra genome (Brawand et al. 2014). Primer sequences for the microsatellite markers are included in Table S1, Supporting Information. Microsatellite markers were genotyped using PCR amplification with fluorescently labeled primers, with products separated by size on an ABI3730 DNA Analyzer (Applied Biosystems). Raw fragment size outputs from Genemapper (Applied Biosystems) were converted to valid integer sizes using the program Tandem (Matschiner & Salzburger 2009). Observed allele counts were tested for deviation from expected using Chi-square tests.
Nested primers were designed using the M. zebra reference sequence to amplify 5 kb on either side of one of the microsatellite makers identified for further investigation (µsat2), as well as partial exonic sequence from the gene for the ERBB receptor feedback inhibitor 1 (errfi1), immediately upstream of pax7a. Amplified PCR fragments from a preliminary panel of 8 individuals (Table S2, Supporting Information) were sequenced using Big Dye Terminator chemistry on an ABI3730xl DNA Analyzer (Applied Biosystems). Sequences were mapped to the M. zebra reference genome using Geneious software (ver6.1.8, Biomatters), allowing for manual curation of polymorphism. Four of the successful primer pairs (noted in Table S1, Supporting Information) were chosen for further Sanger sequencing in an additional 48 individuals.
Tree generation
Unphased SNP genotypes from population samples and M. zebra and Oreochromis niloticus reference genomes (Table S2, Supporting Information) were analyzed for population differentiation in Arlequin v3.5.1.3 (Excoffier and Lischer 2010). From 42 SNPs identified with the above method, we generated a pairwise distance matrix in Arlequin using corrected Nei’s distance (DA), which accounts for diversity within groups in addition to diversity between groups (Excoffier and Lischer 2010). From this matrix, we created a tree with the Fitch package in Phylip v3.965 (Felsenstein 2005), using Fitch-Margoliash least-squares method, rooted by outgroup (O. niloticus) with global rearrangements. The distance matrix used to create this tree was tolerant of missing data, and allowed us to estimate branch lengths, but was not amenable to bootstrap methods for assessing the robustness of particular clades, so we created an additional tree based on allele frequencies that could be bootstrapped for additional rigor. For µsat2, and a subset of 11 of the 42 SNPs (only those that were successfully genotyped in all morphs of all three populations), we used SeqBoot (Felsenstein 2005) to create 100 resampled allele frequency data sets, and used GenDist to generate distance matrices with Nei’s distance. These were used to generate trees in Fitch. Bootstrap support for branches were generated by the Consense package in Phylip. All trees were visualized in Mesquite v0.1 (Maddison and Maddison 2011).
Allelic expression analysis
The pax7a allele-specific expression analysis takes advantage of a pax7a 5’ untranslated region (UTR) size polymorphism to distinguish transcripts by allele in tissue from a single individual. The polymorphism is variation in two short, adjacent mononucleotide tracts (GnTn), with the G3T8 variant marking blotched class alleles of pax7a. Because different polymorphisms produce the same fragment length (i.e., a P morph G4T7 allele size-matches the blotched allele), not all individuals were informative in the assay.
Three-month-old juvenile cichlids were sib-paired across morphs and placed under MS-222 anesthesia. The posterior half of caudal fin was removed and preserved in RNAlater (Ambion). RNA was isolated using the RNeasy kit with Qiashredder (Qiagen), and quantified by absorbance. Normalized RNA was used as template for reverse transcription by Superscript III (Invitrogen), using a poly-T primer. A 5’ fluor-labeled primer in the 5’UTR and a 5’ GTTTCTT- “pigtailed” primer in exon 2 (Table S1, Supporting Information) of pax7a were used to PCR amplify across the polymorphism from the cDNA template described above. PCR products were size separated on an ABI3730 DNA analyzer (Applied Biosystems), and the area under each amplicon peak was measured using Genemapper (Applied Biosystems) software. Relative expression was quantified from relative amplicon peak area in each individual.
Results
Blotch morphs arise from changes in melanophore development
In most of the laboratory lines segregating blotched morphs, blotched and plain siblings are indistinguishable as uniformly melanic larvae until divergence in pigmentation occurs after the first few weeks of development, but with considerable variation in timing by species and morph (Table 1). One exception is an orange morph found in Labeotropheus trewavasae, in which larval melanophores fail to develop. These “orange-early” (OE) morph individuals are readily distinguishable with the naked eye at one week post-fertilization, when the plain morph individuals develop early larval melanophores; the result is distinct all orange (OE) and all brown (P) larvae. In the other morphs, the blotched phenotype emerges as a result of melanophore loss during post-larval and juvenile development, while melanophore numbers increase in plain morphs (Fig. 2A). Individual melanophore death is occasionally seen in the blotched morphs (Fig. 2C–E), as melanophores become less contractile in response to epinephrine treatment (Fig. 2D) and are cleared from the tissue the following day (Fig. 2E). As melanophore number decreases during juvenile development in blotched individuals, the size of individual contracted melanophores increases (Fig. 2B, Fig. 3D, E). In plain morphs, contracted melanophore size remains fairly uniform through juvenile development. Surviving melanophores in the blotched morphs ultimately cluster to form irregular dark patches on the body and fins (Fig. 3B,C), whereas melanophores in plain morphs are more uniformly distributed (Fig. 3A), or contribute to specifically patterned characters (e.g., bars on the body).
Figure 2. Emergence of the OB phenotype via progressive loss of melanophores.
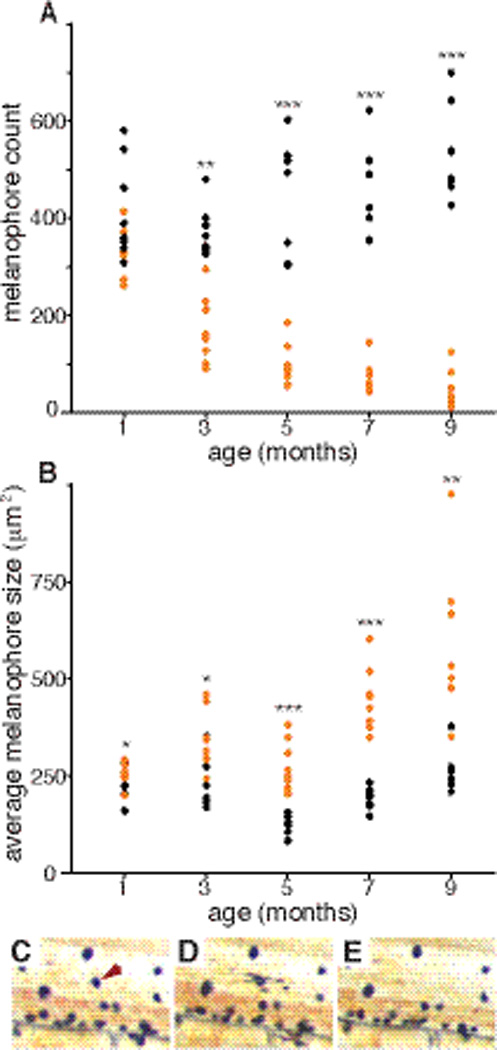
(A) Melanophore number and (B) contracted melanophore size were measured in the caudal fin of the same M. tarakiki individuals through juvenile development. Black and orange symbols indicate P and OB morph individuals, respectively (n = 8 each P and OB morph individuals; by morph t-test p values: *<0.05, **<0.01, ***<0.001). (C–E) Images of the same area of caudal fin in an M. tarakiki OB morph juvenile. On day 1 (C), a melanophore (arrowhead) is responsive to contraction by epinephrine. On day 2 (D) the melanophore responds abnormally with a partially contracted, blebbed appearance, and is cleared from the tissue by day 3 (E).
Figure 3. Phenotypic comparison of discrete morphs within a single population.

Representative caudal fin images of six-month old (A) P, (B) OB, and (C) OE morph individuals from the population of L. trewavasae at Thumbi West (Scale bar, 1 mm). (D) Melanophore number, (E) contracted melanophore size, and (F) mean yellow value from representative caudal fin fields in six-month old individuals from the same population (n = 10 P, 8 OB, and 6 OE morph individuals; p values from ANOVA and t-tests).
Heterozygosity for the pax7ablotch allele clearly alters the development and survival of melanophores, yet its effects on xanthophore development are less clear. OB and O morph individuals certainly appear to be more orange, but it is difficult to distinguish and count individual xanthophore cells due to extensive cell overlap and inconsistent xanthophore morphology. We thus used a field yellow value as a proxy measure of the xanthophore cell lineage (see Methods). OB and O morph individuals have significantly higher yellow scores for caudal fin than P morph individuals (Fig. 3F, p=0.022, t-test), suggesting some modulation of xanthophore development towards more and/or larger xanthophore cells by the pax7ablotch allele.
Variation in blotch phenotype is associated with different alleles
In order to compare different blotched morphs in a relatively uniform context, we collected individuals of the species L. trewavasae from a single population at Thumbi West Island that exhibits discrete blotched morphs (Fig. 1, Table 1). One morph (OB) exhibits small blotches across its entire body. The other two morphs appear similarly orange as adults, though one (described above) lacks larval melanophores, and the other develops larval melanophores and then loses them during juvenile development. We term these two morphs “orange-early” (OE) and “orange-late” (OL), respectively. Adult OL individuals have a few small blotches on their flanks and OE individuals do not, allowing the two morphs to be somewhat distinguished without following development (Fig. 1; Fig. S1, Supporting Information). At a cellular level, phenotypic variability between blotched morphs appears to result from differences in melanophore number, as no significant difference in melanophore size was found (Fig. 3D, E). When bred in the lab, females only produced offspring of the plain morph and of the same blotched morph as themselves, in the expected 1:1 Mendelian ratio for segregation of a single dominant allele (Table 2). By creating mixed breeding groups where females of different blotched morph classes could mate with the same dominant male, we controlled for any potential effect of the sire’s alleles, and found no influence of sire on blotch morph. These results confirm the presence of three discrete blotched-class morphs, and strongly support allelism as the genetic basis of the intrapopulation morph diversity, as opposed to unlinked genetic modifiers modulating the blotched phenotype. In addition to the ancestral pax7a allele, we suggest the presence of at least three derived alleles that produce blotch class morphs: pax7aOB, pax7aOL, and pax7aOE.
Table 2.
Labeotropheus trewavasae (Thumbi West) offspring by color morph of dam.
| color morph of dam |
n (broods) |
average offspring per brood (±SD) |
total offspring by color morph | |||
|---|---|---|---|---|---|---|
| P | OB | O (late) | O (early) | |||
| P | 5 | 17 ± 6 | 84 | 0 | 0 | 0 |
| OB | 8 | 15 ± 8 | 63 | 56 | 0 | 0 |
| O (late) | 2 | 27 ± 3 | 28 | 0 | 26 | 0 |
| O (early) | 12 | 23 ± 5 | 139 | 0 | 0 | 138 |
Variation in pax7a expression correlates with blotch phenotype
We previously developed an assay to quantify allelic expression of pax7a in order to identify whether differences in transcript levels were associated with the blotched class of phenotypes (Roberts et al. 2009); here we apply the assay to compare pax7a expression among blotch morphs. The assay compares transcript levels of the two pax7a alleles in a single individual. In plain morph individuals, the level of transcript from each allele is roughly the same; in any of the blotched individuals the level of a pax7ablotch allele transcript is roughly 1.5 to 2 times higher than that of the ancestral pax7a allele (Fig. 4). Comparing the ratio of allelic expression among morphs within the blotched class reveals differences in relative pax7a transcript level; morphs with fewer melanophores (O, W) have higher relative pax7ablotch transcript levels than those with more melanophores (OB, WB), that is, the orange morphs show a greater difference in transcript level between their two pax7a alleles than is seen in the relatively more melanic orange blotch morphs (Fig. 4). This relationship is perhaps most clear in the L. trewavasae from Thumbi West, where two blotched class morphs from the same species and population were used for melanophore counts (Fig. 3D) and allelic expression analysis (Fig. 4).
Figure 4. Differences in pax7a transcript level among discrete morphs.

Relative transcript level of two pax7a alleles within individual caudal fin tissue. In blotched class morphs, the ratio of the pax7ablotch allele to the ancestral pax7a allele is used. Letters above bars indicate statistical groups by pairwise t-tests; groups sharing a letter are not significantly different from one another. (n = 8 P, 8 OB, and 5 Wh, Metriaclima individuals, and 8 OB and 10 OE morph Labeotropheus individuals).
Widespread color polymorphism by pax7a allelic series
Breeding experiments clearly support an allelic basis for discrete blotch morphs found in the L. trewavasae at Thumbi West. To confirm allelism as the genetic basis of morph differences in other populations, we turned to DNA samples from field collections. Two populations sampled from the northern end of Lake Malawi were identified as each segregating the ancestral morph and two blotched morphs: Metriaclima zebra at Makonde (P, WhB, and W morphs), and M. zebra ‘blaze’ at Manda (P, OB, and O morphs). These two populations are approximately 55 km apart along the Tanzanian shore of the lake. Blotched class individuals from these two Metriaclima populations and the Thumbi West Labeotropheus population are heterozygous for the same SNP haplotype across three genes at the pax7a locus, regardless of the degree of blotching, timing of onset, or background coloration (Table 3, Fig. 5, Table S1, Supporting Information). This SNP haplotype is stable across blotched morphs in all populations tested throughout the lake (Roberts et al. 2009), and thus does not provide resolution to examine potential genetic divergence between morphs. We identified additional polymorphic markers to look for this divergence, including two simple sequence repeats at the locus: one 740 bp upstream of the pax7a start codon (µsat1) and another approximately 60 kb upstream of pax7a (µsat2) (Fig. 5). Genotypes at these markers in the three multi-morph populations above demonstrate that specific microsatellite alleles are associated with specific blotched color morphs (Table 3; see also Table S3, Supporting Information, for complete allele counts).
Table 3.
Alleles with significant associations with blotched color morphs in natural populations1.
| L. trewavasae Thumbi West | M. zebra Makonde | M. zebra 'blaze' Manda | ||||||||||||
|---|---|---|---|---|---|---|---|---|---|---|---|---|---|---|
| counts by morph2 | counts by morph | counts by morph | ||||||||||||
| Marker | Allele | P | OB | OL | OE | p3 | P | WhB | Wh | p | P | OB | O | p |
| µsat 2 | 186 | 1 | 0 | 0 | 0 | n.s. | 2 | 14 | 0 | < 0.0001 | 0 | 11 | 0 | < 0.0001 |
| 188 | 5 | 16 | 2 | 1 | 0.0146 | - | - | - | - | - | - | - | - | |
| 190 | 3 | 14 | 1 | 1 | 0.0092 | - | - | - | - | 0 | 1 | 0 | n.s. | |
| 192 | 6 | 12 | 7 | 20 | < 0.0001 | - | - | - | - | 0 | 1 | 0 | n.s. | |
| 198 | 7 | 3 | 0 | 0 | n.s. | 8 | 0 | 15 | < 0.0001 | 0 | 0 | 5 | < 0.0001 | |
| µsat 1 | 240 | 19 | 15 | 2 | 3 | n.s. | 2 | 0 | 11 | < 0.0001 | 1 | 0 | 5 | < 0.0001 |
| 244 | 5 | 4 | 0 | 5 | n.s. | 0 | 12 | 0 | < 0.0001 | - | - | - | - | |
| 276 | 1 | 8 | 2 | 7 | 0.0236 | 1 | 1 | 2 | n.s. | 3 | 3 | 1 | n.s. | |
| SNP pax7a | C | 72 | 35 | 7 | 18 | 0.001 | 48 | 12 | 12 | 0.0183 | 48 | 11 | 5 | 0.0498 |
| T | 0 | 35 | 7 | 18 | < 0.0001 | 0 | 12 | 12 | < 0.0001 | 0 | 11 | 5 | < 0.0001 | |
| SNP park7 | G | 2 | 35 | 7 | 17 | < 0.0001 | 0 | 12 | 12 | < 0.0001 | 0 | 11 | 4 | < 0.0001 |
| T | 70 | 35 | 7 | 19 | 0.0026 | 48 | 12 | 12 | 0.0183 | 48 | 11 | 6 | n.s. | |
| SNP kcnab2 | A | 69 | 35 | 7 | 18 | 0.0028 | 47 | 12 | 12 | 0.0241 | 44 | 11 | 5 | n.s. |
| G | 3 | 35 | 7 | 18 | < 0.0001 | 1 | 12 | 12 | < 0.0001 | 4 | 11 | 5 | 0.0013 | |
| n (individuals): | 36 | 35 | 7 | 18 | 24 | 12 | 12 | 24 | 11 | 5 | ||||
See Table S3, Supporting Information for complete counts.
Boldface indicates counts for alleles in high association with specific color morphs.
p values from chi-square test of observed allele counts by morph vs. expected counts based on proportion of color morphs in population (bottom row of table). Dashes indicate absence of allele in sampled individuals.
Figure 5. Association of pigment morphs and specific haplotypes in natural populations.
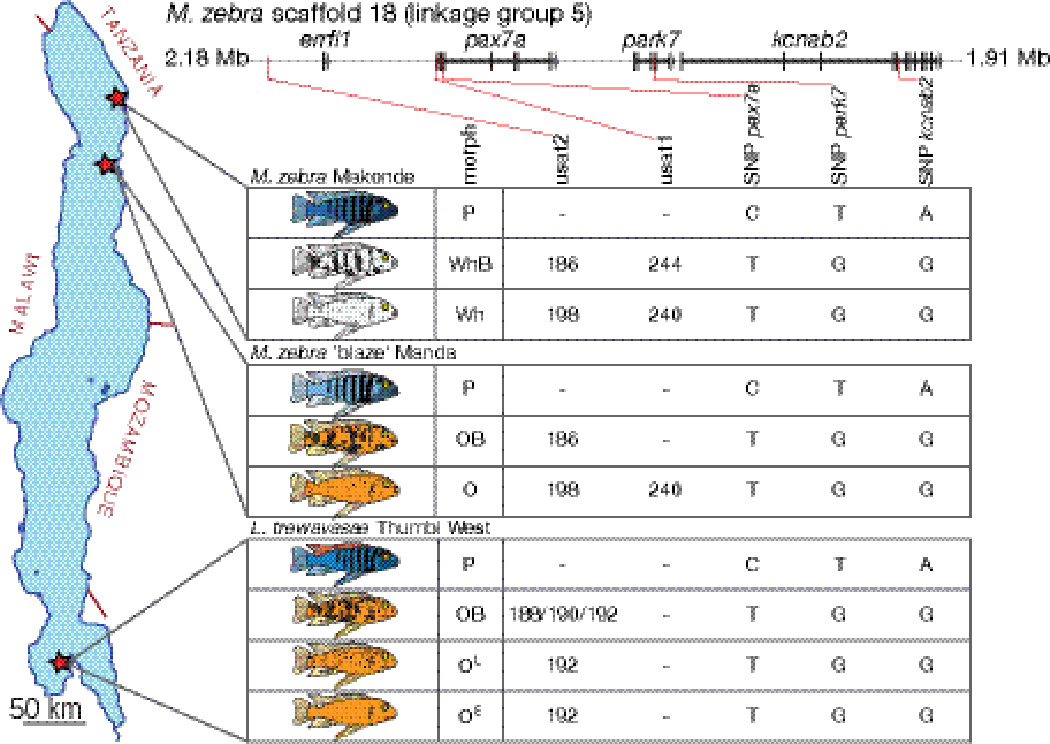
(Top) Genomic locations of tested microsatellite and SNP markers relative to genes on M. zebra genome scaffold 18 (part of linkage group 5). (Left) Location within Lake Malawi of the tested populations with multiple blotched class morphs, and (right) inferred haplotypes associated with each morph. Alleles in complete or highly significant association with a color morph (see Table 3) are inferred to be part of the haplotype across the locus for that morph. Dashes indicate no clear association with specific alleles.
Since all blotched class individuals are heterozygous for a pax7ablotch allele, it is difficult to definitively identify haplotypes associated with each morph. However, for many allele-morph associations all individuals of a particular morph in a population carry the same allele. For example, at the µsat2 marker in the Labeotropheus populations, all OL and OE individuals carry a 192 allele (Table 3). From these strong associations we infer common haplotypes for each morph (Fig. 5). It is of note that the two Metriaclima populations appear to share alleles at µsat2, with all WhB and OB individuals having a 186 allele, and all Wh and O individuals a 198 allele (Table 3, Fig. 5). Thus these alleles correlate to degree of blotching, independent of orange and white background coloration, and support a shared origin of these morphs across the two populations.
To further investigate the evolutionary history of the region surrounding µsat2, we sequenced 10 kb surrounding the repeat, as well as coding region of nearby errfi1 in a subset of the above individuals. We identified 42 SNPs in the region, including 11 previously identified as assembly SNPs in the reference genome. A tree created using a distance matrix of corrected average pairwise population differences from the region surrounding pax7a (Fig. 6A) supports grouping by morph, rather than by population. One explanation for the strong split between all P and all OB individuals is that there is more variability within the OB class individuals than the P class individuals (each OB individual is heterozygous for the OB and P alleles, but P individuals are homozygous for the P allele), which results in a reduction of branch lengths when correcting for within-population variability. As expected from the microsatellite data, the O and W M. zebra populations group together, supporting a single origin for the amelanic morphs in the two populations. A replicated tree created from allele frequencies at 13 polymorphic loci further supports allelism within the blotched morph classes (Fig. 6B), with strong bootstrap support for M. zebra Manda O and Makonde W morphs forming a clade (86 of 100), as well as Makonde and Manda P morphs forming a clade (71 of 100). In comparison, a control tree created from microsatellite allele frequencies elsewhere in the genome displays grouping by population, rather than color morph (Fig. 6C). Additionally, in L. trewavasae, the amelanic morphs with different developmental trajectories (OL and OE) do not group together in either region-specific tree (Fig. 6A,B), further supporting their designation as independent alleles in the allelic series. Importantly, the population genetic signatures found in the two northern Metriaclima populations suggest that the allelic inheritance of morphs demonstrated in the southern Labeotropheus population (as seen in Table 2) is a general phenomenon across genera and around the lake.
Figure 6. Gene trees representing the evolutionary history of the pax7a regulatory locus.

Near pax 7a on linkage group 5, trees based on the corrected average pairwise difference distance matrix produced in Arlequin for 42 SNPs (A) and bootstrapped gene frequencies (B) show grouping by color morph rather than by population structure. Branch lengths (A) are relatively short compared to the O. niloticus outgroup, consistant with relatively recent evolutionary origin of the pax7ablotch allele. Bootstrap values are strongest for grouping M. zebra lightly blotched morphs together (86), as well as M. zebra barred morphs (71). In contrast, the control tree (C) has strong support for the L. trewavasae Thumbi West clade (94) and moderate support for the M. zebra Makonde clade (56), consistant with designation of these groups at the genus and population levels.
Discussion
Our results suggest that the pax7a locus has evolved to produce a natural allelic series associated with discrete color morphs segregating within populations. Phenotype and expression data support a role for pax7a transcript dosage in modulating the development and survival of melanophores. Also, while we were unable to directly count xanthophores in juvenile cichlids, a proxy measure suggests modulation of xanthophore development by pax7ablotch alleles to increase overall yellow coloration. In the simplest sense, higher relative pax7a transcript levels correlate with fewer, larger melanophores, and increase in yellow intensity provided by xanthophores. Pax7a is a member of the pax3/pax7 subfamily of paired box transcription factors, and pax3 and pax7 genes have structural and functional similarities (Blake et al., 2014). Notably, in a separate study in the Malawi species flock, we associated interspecific variation in yellow pigmentation with genetic variation at pax3a, where an allele with relatively higher expression is associated with a putative increase in xanthophores and reduction in melanophores along the flank (Albertson et al. 2014). Together, these experiments suggest diversification of pigment pattern in Malawi cichlids via parallel evolution of pax3a and pax7a, where in both cases increases in expression of the pax3/pax7 subfamily members increases yellow and decreases melanophore-based coloration.
Results from our natural experiments are supported by work manipulating dosage of pax3 and pax7 in developing zebrafish (Danio rerio), where evidence suggests overlapping roles of the two transcription factors in modulating melanophore and xanthophore cell lineages (Minchin & Hughes, 2008; Nord et al., 2016). Knockdown of pax3 transcript produces more, but smaller melanophores relative to controls, while changes to either pax3 or pax7 dosage affected the xanthophore cell lineage, and thus degree of yellow pigmentation (Minchin & Hughes 2008). More recently, pax7 activity was shown to be essential for formation of xanthophores in Danio, with depletion of pax7 paralogs producing severe reduction of xanthophores and a concomitant increase in melanophores (Nord, 2016). Of note, this shift in relative numbers of chromatophores also disrupted Danio stripe patterning, resulting in small scattered spots of melanophores along the flank (Nord, 2016), mirroring the disruption of bars into blotches in Lake Malawi cichlids carrying a pax7ablotch allele. The above findings in Danio are consistent with our findings in Malawi cichlids, where evolved differences in pax3a and pax7a dosage appear to tune relative melanophore and xanthophore number, with impacts on overall pattern formation.
Pax7a-associated changes in the xanthophore lineage may be indirect effects of changes in the melanophore lineage, since interaction of these two cell lineages through development is essential to their patterning and survival in other fishes (Parichy et al. 2000, 2003; Maderspacher & Nusslein-Volhard 2003). Another intriguing hypothesis is that pax7a dosage may modulate the differentiation of melanophore and xanthophore lineages from a common chromatophore precursor stem cell population, suggested by studies in Medaka and Danio (Nagao et al. 2014; Nord et.al. 2016). Either way, pax7a may act as a switch, mediating a trade-off between melanophore and xanthophore lineages. In the case of the orange blotch and orange morphs, overall melanophore coloration is decreased and xanthophore coloration is more intense. White blotch and white morphs may represent a switch between melanophore and iridophore lineages, or an overall lack of the xanthophore lineage in some species due to other genetic loci. Such chromatophore lineage trade-offs may represent a more general trend in cichlid color evolution, as suggested by studies of male nuptial coloration in Lake Malawi cichlids (O’Quin et al. 2010; Brzozowski et al. 2012; Albertson et al. 2014).
Though our findings suggest a role for pax7a in cichlid xanthophore pigmentation, we have not found an association between distinct pax7ablotch alleles and discrete whole-organism xanthophore phenotypes (i.e., alleles associated with OB versus WhB morphs). Indeed, genotypes from our Metriaclima population survey support the opposite, with the same alleles of pax7a found associated with the discrete melanophore phenotypes, despite xanthophore-based differences in background coloration (orange versus white) in the blotched morphs. To our knowledge, blotched morphs with different background coloration are not found segregating within populations in Lake Malawi, a scenario that would allow direct association of xanthophore phenotypes with potential allelic diversity at pax7a. Orange blotch and white blotch morphs do segregate within populations of some Lake Victoria cichlid species, and breeding experiments indicate that separate, unlinked loci are responsible for each color morph (Seehausen et al. 1999). In Lake Malawi, interpopulation differences in non-melanic background coloration are likely due to other genetic loci that may contribute to, and be constrained by, population-specific male nuptial or female cryptic coloration.
As no pax7a coding sequence changes have been found across the discrete blotched morphs, we hypothesize that evolution of the morphs has taken place by stepwise changes to cis-regulatory elements of the gene, producing an allelic series. A similar scenario has been demonstrated at the ebony gene in Drosophila, where various combinations of single base differences in a cis-regulatory element correspond to changes in ebony expression that produce abdominal pigmentation differences (Rebeiz et al. 2009). The initial evolutionary origin of the pax7a blotched allele class likely represented the greatest jump in transcript level relative to the ancestral pax7a allele, with subsequent changes tuning transcript level to modulate the degree of melanism. The OE morph found in one population is qualitatively different from the other morphs examined, as it fails to develop early melanophores, and may be the result of a regulatory change affecting timing as well as level of pax7a dosage. Of note, OL and OE pax7a alleles co-segregate within a population, both producing similar adult morphs (Fig. 1,IJ) despite different developmental trajectories. Thus, in some contexts the blotched morphs are also expressed as an ontogenetic color polymorphism. Moreover, these two morphs show that the same genetic locus can act at different stages of development to produce a remarkably similar adult phenotype.
The totality of our population genetic and gene expression data provide strong support for a model of blotch morph evolution via changes to pax7a regulation, particularly within the context of results from pax7 and pax3 manipulation experiments in model fish species (Minchin & Hughes 2008; Nagao et al. 2014; Nord et.al. 2016). However, because we have not identified and confirmed causative polymorphisms underlying pax7a regulation and their impact on phenotype, our results are somewhat circumstantial. One alternative hypothesis is that mutations causing expression or structural changes in nearby genes may cause blotch morphs or contribute to variation among blotched morphs. While other genes in the associated region have not been shown to underlie pigmentation differences, potential links can be made. For example, kcnab2 encodes a potassium channel, and mutation of another potassium channel gene, kcnj13, was shown to be responsible for the jaguar mutant phenotype in zebrafish, involving disruption of stripes (Iwashita 2006). Additionally, the errfi1 gene is a regulator of epidermal growth factor receptor signaling, which is known to impact melanin-producing cells in fish and mammals (Wellbrock et.al. 1997; Fitch 2003). Future studies involving comparative genome sequence analysis of the locus in varied blotch morph individuals from a variety of species and populations should help pinpoint candidate polymorphism for functional confirmation experiments.
The µsat2 marker is roughly 60 kb upstream of the pax7a start codon (Fig. 5), but it displays a stronger and more consistent association with the discrete blotched morphs than µsat1, less than 1 kb from the start of pax7a coding sequence. Such a pattern is consistent with evolution at cis-regulatory elements some distance upstream, as well as studies of adaptive alleles of major developmental genes in fishes (Chan et al. 2010; Roberts et al. 2011). It is likely that large and modular cis-regulatory regions allow evolution of subtle and restricted changes to expression of key genes for adaptive changes without disastrous outcomes during overall development (Carroll 2008).
Though the genetic marker data associated with discrete blotch morphs is minimal, the strong association of certain alleles with each morph allows us to make some initial inferences about their evolutionary history. Overall the blotch class of morphs found across genera does not represent convergent evolution, but rather a single origin of a shared allele carrying a specific SNP haplotype (Fig. 5) (Roberts et al. 2009). Sharing of alleles across multiple populations or species may result from maintenance of the pax7a-associated color polymorphism as two populations diverge from a single one, or invasion of the alleles across populations by rare gene flow, a possibility supported by previous work examining migration in cichlids (Markert et al 1999; Danley et al. 2000; Hey et al. 2004). Subsequent divergence of the pax7ablotch allele after its initial origin appears to have produced at least three distinct blotch alleles and associated submorphs. In the two Metriaclima subspecies studied, the two pax7ablotch alleles segregating in each appear to predate the formation of the allopatric populations (Figs. 5 and 6). While sharing of adaptive polymorphism across genera has been repeatedly documented for genes influencing pigmentation (this study; Roberts et al. 2009, Albertson et al. 2014), it does not appear to be a unique attribute of pigmentation genes, since the same alleles of the ptch1 gene segregate across genera to modulate jaw morphology (Roberts et al. 2011). The repeated sharing of alleles across populations, species, and genera demonstrated in Malawi cichlids stands in contrast to many pigmentation loci identified in other vertebrate populations, where parallel color morphs result from repeated independent mutation of the same gene, rather than a single origin of a shared allele. Examples include oca2 in fish, Agouti in rodents, and Mc1r in rodents, fish, and lizards (Protas et al. 2005; Kingsley et el. 2009; Manceau et al. 2010; Gross et al. 2009; Rosenblum et al. 2010). The sharing of alleles in Lake Malawi cichlids reflects their evolutionary history, with key components likely including relatively recent sorting of ancestral polymorphism and divergence with gene flow (Hey et al. 2004; Joyce et al. 2011). In this regard, the genetic architecture of pigmentation (and other traits) across cichlid species may be more akin to that of dog breeds, where the same alleles are reused to produce similar color patterns across breeds (Clark et al. 2006; Karlsson et al. 2007).
Color polymorphisms such as the pax7a-associated blotch morphs are of particular evolutionary interest since they represent an exception to directional selection. Rather than one morph having a selective advantage and going to fixation, multiple morphs segregate and are apparently maintained by selection. We favor a hypothesis wherein a adaptive benefit of blotch morphs stems from background matching the often mottled and light-colored rock habitat in Lake Malawi, providing alternative forms of crypsis and/or disruptive coloration relative to the plain morph (Greenwood 1956; Konings 2007; Roberts et al. 2009). Indeed, one study demonstrated differential bird predation of plain and blotched morphs in Lake Victoria cichlids, where blotch morph individuals suffered higher predation in a shallow pool experiment designed to favor the plain morph (Maan 2008). In contrast, in New World cichlids with “gold” and “dark” color polymorphism (identical in overall appearance to O and P morphs in Malawi species), bird predation was much lower on the seemingly conspicuous gold morphs when experiments were conducted in the lake (Torres-Dowdall et al. 2014); the authors hypothesize that frequency dependent predation may be involved. Though in different cichlid species than those studied here, both of the above cases demonstrate that differential predation can occur based on color morph and context. In Lake Malawi, multiple morphs providing distinct types of camouflage may be favored in complex habitat backgrounds such as the boulder reefs the rock-dwelling cichlids inhabit. The appearance of rock surfaces is quite variable, determined in part by algal growth and fine debris. Further variation is introduced by differing depth and light exposure, producing a visually mosaic habitat (Dalton et al. 2010). Additionally, work suggests that similar blotch morphs influence behavior in Lake Victoria cichlids, opening up the intriguing possibility that color polymorphism may be supported by frequency-dependent selection related to intraspecific aggression and mate choice (Dijkstra et al. 2008; Pierotti et al. 2008).
If heterozygosity for a dominant allele such as pax7ablotch provides an adaptive benefit over the ancestral allele, but homozygosity for the same allele reduces fitness, polymorphism could be maintained (Fisher 1931). The blotch morphs are to some extent a special case of maintained heterozygosity, since the causative pax7ablotch alleles are tightly linked to a dominant female sex determination gene (W) (Roberts et al. 2009; Ser et al. 2010). Thus, pax7ablotch homozygous individuals may not only be unlikely due to the rarity of successful blotch males (which have disrupted nuptial coloration), but may also suffer a reduction in fitness due to homozygosity for the linked sex determination gene. Despite sex linkage, the pax7ablotch allele could become fixed in females in population. However, P morph females are found in most (if not all) populations segregating blotch morphs, and thus color polymorphism is maintained in females. This polymorphism may be supported by the mode of sex determination in Malawi cichlids, which is multigenic and involves epistatic interaction of both male (XY) and female (ZW) dominant sex determination systems (Ser et al. 2010). Of particular note, the W locus linked to the pax7ablotch allele is not required to determine female sex, and blotched ZW females can produce P morph female daughters with a ZZ genotype depending on genotypes at other sex determination loci (Roberts et al. 2009; Ser et al. 2010). In order for a blotched morph to become fixed in a population, the linked ZW sex determination system would have to also become fixed as the sole sex determination system in that population.
Alleles enhancing male nuptial color or improving female crypsis are likely to create a sexual conflict by decreasing the pigmentation-associated fitness of the alternate sex, but if linked to genetic sex determination loci the alleles will be sexually dimorphic in their phenotypic expression, resolving said conflict (Blaser et al. 2011). Additionally, alleles at a sex determination locus may undergo relatively rapid divergence if recombination is locally reduced during sex chromosome evolution (Charlesworth 1996). This point is especially pertinent in light of studies in Drosophila demonstrating that multiple cis-regulatory differences work in concert to produce adaptive evolution (Rebeiz et al. 2009; Frankel et al. 2011). On the pax7ablotch allele, reduced recombination may have facilitated accumulation of mutations to produce the array of blotch class alleles and associated phenotypic morphs. Interestingly, the genetic basis of extensive male-specific nuptial color polymorphism described in other fishes has been found linked to Y sex determination (Winge 1927; Lindholm et al. 2004; Basolo 2006).
Both the evolution of novel alleles and existence of color polymorphism are areas of intense interest to biologists. Here we described evolution of an allelic series of the pax7a gene associated with a range of discrete color morphs that remain polymorphic in populations of Lake Malawi cichlid fish. Our work supports a single origin of a pax7ablotch allele, followed by subsequent divergent evolution to produce a series of pax7ablotch alleles. In one population we provide evidence for the presence of at least four pax7a alleles (including the ancestral allele), each associated with a discrete color morph, each maintained as segregating color polymorphism. The variant pax7a alleles produce different levels of transcript, correlating to differences in development and survival of melanophore and xanthophore pigment cell lineages. While the precise ecological causes for maintenance of multiple pax7a-associated color morphs within populations are unknown, it is clear that ongoing color polymorphism via pax7a allelic series has been evolutionarily successful in multiple scenarios across genera and geography.
Supplementary Material
Acknowledgments
Funding
We thank Matthew Conte for invaluable bioinformatics support. These studies were supported by NIH fellowship F32HD051383 (RBR) and by NSF grant DEB-0445212 (TDK).
Footnotes
Data accessibility
Full genotype and allele count data are included in Supporting Information.
Authors’ contributions
RBR and ECM carried out phenotypic analysis and molecular experiments. RBR, ECM, and TDK designed experiments, analyzed data, and drafted the manuscript. All authors read and approved the final manuscript.
Supporting Information:
Table S1: Primer and coordinate information for markers used in the study (Microsoft Excel spreadsheet “TableS1.xlsx”).
Table S2: Population genotype data (Microsoft Excel spreadsheet “TableS2.xlsx”).
Table S3: Complete allele counts by color morph for markers tested in populations (Microsoft Excel spreadsheet “TableS3.xlsx”).
Figure S1: Photographs of Labeotropheus trewavasae collections at Thumbi West Island, Lake Malawi, sorted by discrete color morph: (A) side-by-side comparison of ancestral plain (P) morph and three blotch class morphs; representative (B) orange blotch, OB; (C) orange-late, O-late; and (D) orange-early, O-early individuals.
References
- Abramoff MD, Magalhaes PJ, Ram SJ. Image Processing with ImageJ. Biophotonics International. 2004;11:36–42. [Google Scholar]
- Albertson RC, Powder KE, Hu Y, Coyle KP, Roberts RB, Parsons KJ. Genetic basis of continuous variation in the levels and modular inheritance of pigmentation in cichlid fishes. Molecular Ecology. 2014;23:5135–5150. doi: 10.1111/mec.12900. [DOI] [PMC free article] [PubMed] [Google Scholar]
- Allender CJ, Seehausen O, Knight ME, Turner GF, Maclean N. Divergent selection during speciation of Lake Malawi cichlid fishes inferred from parallel radiations in nuptial coloration. Proceedings of the National Academy of Sciences USA. 2003;100:14074–14079. doi: 10.1073/pnas.2332665100. [DOI] [PMC free article] [PubMed] [Google Scholar]
- Basolo AL. Genetic linkage and color polymorphism in the southern platyfish (Xiphophorus maculatus), a model system for studies of color pattern evolution. Zebrafish. 2006;3:65–83. doi: 10.1089/zeb.2006.3.65. [DOI] [PubMed] [Google Scholar]
- Blake JA, Ziman MR. Pax genes: regulators of lineage specification and progenitor cell maintenance. Development. 2014;141:737–751. doi: 10.1242/dev.091785. [DOI] [PubMed] [Google Scholar]
- Blaser O, Neuenschwander S, Perrin N. On the Maintenance of Sex Chromosome Polymorphism by Sex-Antagonistic Selection. American Naturalist. 2011;178:515–524. doi: 10.1086/661895. [DOI] [PubMed] [Google Scholar]
- Brawand D, Wagner CE, Li YI, et al. The genomic substrate for adaptive radiation in African cichlid fish. Nature. 2014;513:375–381. doi: 10.1038/nature13726. [DOI] [PMC free article] [PubMed] [Google Scholar]
- Brzozowski F, Roscoe J, Parsons K, Albertson C. Sexually dimorphic levels of color trait integration and the resolution of sexual conflict in Lake Malawi cichlids. Journal of Experimental Zoology Part B. Molecular and Developmental Evolution. 2012;318:268–278. doi: 10.1002/jez.b.22443. [DOI] [PubMed] [Google Scholar]
- Carroll SB. Evo-devo and an expanding evolutionary synthesis, a genetic theory of morphological evolution. Cell. 2008;134:25–36. doi: 10.1016/j.cell.2008.06.030. [DOI] [PubMed] [Google Scholar]
- Chan YF, Marks ME, Jones FC, et al. Adaptive evolution of pelvic reduction in sticklebacks by recurrent deletion of a Pitx1 enhancer. Science. 2010;327:302–305. doi: 10.1126/science.1182213. [DOI] [PMC free article] [PubMed] [Google Scholar]
- Charlesworth B. The evolution of chromosomal sex determination and dosage compensation. Current Biology. 1996;6:149–162. doi: 10.1016/s0960-9822(02)00448-7. [DOI] [PubMed] [Google Scholar]
- Clark LA, Wahl JM, Rees CA, Murphy KE. Retrotransposon insertion in SILV is responsible for merle patterning of the domestic dog. Proceedings of the National Academy of Sciences USA. 2006;103:1376–1381. doi: 10.1073/pnas.0506940103. [DOI] [PMC free article] [PubMed] [Google Scholar]
- Dalton BE, Cronin TW, Marshall NJ, Carleton KL. The fish eye view, are cichlids conspicuous? Journal of Experimental Biology. 2010;213:2243–2255. doi: 10.1242/jeb.037671. [DOI] [PubMed] [Google Scholar]
- Danley PD, Markert JA, Arnegard ME, Kocher TD. Divergence with gene flow in the rock-dwelling cichlids of Lake Malawi. Evolution. 2000;54:1725–1737. doi: 10.1111/j.0014-3820.2000.tb00716.x. [DOI] [PubMed] [Google Scholar]
- Dijkstra PD, Seehausen O, Groothuis TG. Intrasexual competition among females and the stabilization of a conspicuous colour polymorphism in a Lake Victoria cichlid fish. Proceedings of the Royal Society B. Biological Sciences. 2008;275:519–526. doi: 10.1098/rspb.2007.1441. [DOI] [PMC free article] [PubMed] [Google Scholar]
- Excoffier L, Lischer HEL. Arlequin suite ver 3.5: A new series of programs to perform population genetic analyses under Linux and Windows. Molecular Ecology Resources. 2010;10:564–567. doi: 10.1111/j.1755-0998.2010.02847.x. [DOI] [PubMed] [Google Scholar]
- Felsenstein J. Distributed by the author. Department of Genome Sciences. Seattle: University of Washington; 2005. PHYLIP (Phylogeny Inference Package) version 3.695. [Google Scholar]
- Fisher RA. The evolution of dominance. Biological Reviews. 1931;6:345–368. [Google Scholar]
- Fitch KR, McGowan KA, van Raamsdonk CD, Fuchs H, Lee D, et al. Genetics of dark skin in mice. Genes Dev. 2003;17:214–228. doi: 10.1101/gad.1023703. [DOI] [PMC free article] [PubMed] [Google Scholar]
- Frankel N, Erezyilmaz DF, McGregor AP, Wang S, Payre F, Stern DL. Morphological evolution caused by many subtle-effect substitutions in regulatory DNA. Nature. 2011;474:598–603. doi: 10.1038/nature10200. [DOI] [PMC free article] [PubMed] [Google Scholar]
- Geneious version 6.1.8 created by Biomatters. Available from http://www.geneious.com/ [Google Scholar]
- Greenwood PH. The monotypic genera of cichlid fishes in Lake Victoria. Bulletin of the Brussels Museum of Natural History (Zoology) 1956;15:29–119. [Google Scholar]
- Gross JB, Borowsky R, Tabin CJ. A novel role for Mc1r in the parallel evolution of depigmentation in independent populations of the cavefish Astyanax mexicanus. PLoS Genetics. 2009;5:e1000326. doi: 10.1371/journal.pgen.1000326. [DOI] [PMC free article] [PubMed] [Google Scholar]
- Hey J, Won YJ, Sivasundar A, Nielsen R, Markert JA. Using nuclear haplotypes with microsatellites to study gene flow between recently separated cichlid species. Molecular Ecology. 2004;13:909–919. doi: 10.1046/j.1365-294x.2003.02031.x. [DOI] [PubMed] [Google Scholar]
- Holzberg S. A field and laboratory study of the behavior and ecology of Pseudotropheus zebra (Boulenger), an endemic cichlid of Lake Malawi (Pisces; Cichlidae) Journal of Zoological Systematics and Evolutionary Research. 1978;16:171–187. [Google Scholar]
- Hubbard JK, Uy JAC, Hauber ME, Hoekstra HE, Safran RJ. Vertebrate pigmentation, from underlying genes to adaptive function. Trends in Genetics. 2010;26:231–239. doi: 10.1016/j.tig.2010.02.002. [DOI] [PubMed] [Google Scholar]
- Iwashita M, Watanabe M, Ishii M, Chen T, Johnson SL, et al. Pigment pattern in jaguar/obelix zebrafish is caused by a Kir7.1 mutation: Implications for the regulation of melanosome movement. PLoS Genet. 2006;2:e197. doi: 10.1371/journal.pgen.0020197. [DOI] [PMC free article] [PubMed] [Google Scholar]
- Joron M, Frezal L, Jones RT, et al. Chromosomal rearrangements maintain a polymorphic supergene controlling butterfly mimicry. Nature. 2011;477:203–208. doi: 10.1038/nature10341. [DOI] [PMC free article] [PubMed] [Google Scholar]
- Joyce DA, Lunt DH, Genner MJ, Turner GF, Bills R, Seehausen O. Repeated colonization and hybridization in Lake Malawi cichlids. Current Biology. 2011;21:R108–R109. doi: 10.1016/j.cub.2010.11.029. [DOI] [PubMed] [Google Scholar]
- Karlsson EK, Baranowska I, Wade CM, et al. Efficient mapping of mendelian traits in dogs through genome-wide association. Nature Genetics. 2007;39:1321–1328. doi: 10.1038/ng.2007.10. [DOI] [PubMed] [Google Scholar]
- Kelsh RN. Genetics and evolution of pigment patterns in fish. Pigment Cell Research. 2004;17:326–336. doi: 10.1111/j.1600-0749.2004.00174.x. [DOI] [PubMed] [Google Scholar]
- Kingsley EP, Manceau M, Wiley CD, Hoekstra HE. Melanism in Peromyscus is caused by independent mutations in Agouti. PLoS One. 2009;4:e6435. doi: 10.1371/journal.pone.0006435. [DOI] [PMC free article] [PubMed] [Google Scholar]
- Knight ME, Turner GF, Rico CRC, et al. Microsatellite paternity analysis on captive Lake Malawi cichlids supports reproductive isolation by direct mate choice. Molecular Ecology. 1998;7:1605–1610. [Google Scholar]
- Konings A. Malawi Cichlids in Their Natural Habitat. 4th. El Paso, TX: Cichlid Press; 2007. [Google Scholar]
- Lande R, Seehausen O, van Alphen JJM. Mechanisms of rapid sympatric speciation by sex reversal and sex selection in cichlid fish. Genetica. 2001;112–113:435–443. [PubMed] [Google Scholar]
- Lindholm AK, Brooks R, Breden F. Extreme polymorphism in a Y-linked sexually selected trait. Heredity. 2004;92:156–162. doi: 10.1038/sj.hdy.6800386. [DOI] [PubMed] [Google Scholar]
- Maan ME, Eshuis B, Haesler MP, Schneider MV, van Alphen JM, et al. Color Polymorphism and Predation in a Lake Victoria Cichlid Fish. Copeia. 2008;3:621–629. [Google Scholar]
- Maddison WP, Maddison DR. Mesquite: a modular system for evolutionary analysis. Version 2.75, build 564. 2011 http://mesquiteproject.org. [Google Scholar]
- Maderspacher F, Nusslein-Volhard C. Formation of the adult pigment pattern in zebrafish requires leopard and obelix dependent cell interactions. Development. 2003;130:3447–3457. doi: 10.1242/dev.00519. [DOI] [PubMed] [Google Scholar]
- Manceau M, Domingues VS, Linnen CR, Rosenblum EB, Hoekstra HE. Convergence in pigmentation at multiple levels, mutations, genes and function. Philosophical Transactions of the Royal Society B. Biological Sciences. 2010;365:2439–2450. doi: 10.1098/rstb.2010.0104. [DOI] [PMC free article] [PubMed] [Google Scholar]
- Markert JA, Arnegard ME, Danley PD, Kocher TD. Biogeography and population genetics of the Lake Malawi cichlid Melanochromis auratus, habitat transience, philopatry and speciation. Molecular Ecology. 1999;8:1013–1026. [Google Scholar]
- Matschiner M, Salzburger W. TANDEM, integrating automated allele binning into genetics and genomics workflows. Bioinformatics. 2009;25:1982–1983. doi: 10.1093/bioinformatics/btp303. [DOI] [PubMed] [Google Scholar]
- Minchin JEN, Hughes SM. Sequential actions of Pax3 and Pax7 drive xanthophore development in zebrafish neural crest. Developmental Biology. 2008;317:508–522. doi: 10.1016/j.ydbio.2008.02.058. [DOI] [PMC free article] [PubMed] [Google Scholar]
- Nagao Y, Suzuki T, Shimizu A, et al. Sox5 functions as a fate switch in Medaka pigment cell development. PLoS Genetics. 2014;10:e1004246. doi: 10.1371/journal.pgen.1004246. [DOI] [PMC free article] [PubMed] [Google Scholar]
- Nord H, Dennhag N, Muck J, von Hofsten J. Pax7 is required for establishment of the xanthophore lineage in zebrafish embryos. Mol Biol Cell. 2016 Jun 1;27(11):1853–1862. doi: 10.1091/mbc.E15-12-0821. [DOI] [PMC free article] [PubMed] [Google Scholar]
- O'Quin CT, Drilea AC, Roberts RB, Kocher TD. A small number of genes underlie male pigmentation traits in Lake Malawi cichlid fishes. Journal of Experimental Zoology Part B. Molecular and Developmental Evolution. 2012;318:199–208. doi: 10.1002/jez.b.22006. [DOI] [PubMed] [Google Scholar]
- Parichy DM, Ransom DG, Paw B, Zon LI, Johnson SL. An orthologue of the kit-related gene fms is required for development of neural crest-derived xanthophores and a subpopulation of adult melanocytes in the zebrafish. Danio rerio. Development. 2000;127:3031–3044. doi: 10.1242/dev.127.14.3031. [DOI] [PubMed] [Google Scholar]
- Parnell NF, Streelman JT. Genetic interactions controlling sex and color establish the potential for sexual conflict in Lake Malawi cichlid fishes. Heredity. 2012;110:239–246. doi: 10.1038/hdy.2012.73. [DOI] [PMC free article] [PubMed] [Google Scholar]
- Pierotti MER, Knight ME, Immler S, Barson NJ, Turner GF, Seehausen O. Individual variation in male mating preferences for female coloration in a polymorphic cichlid fish. Behavioral Ecology. 2008;19:483–488. [Google Scholar]
- Protas ME, Hersey C, Kochanek D, et al. Genetic analysis of cavefish reveals molecular convergence in the evolution of albinism. Nature Genetics. 2005;38:107–111. doi: 10.1038/ng1700. [DOI] [PubMed] [Google Scholar]
- Rebeiz M, Pool JE, Kassner VA, Aquadro CF, Carroll SB. Stepwise modification of a modular enhancer underlies adaptation in a Drosophila population. Science. 2009;326:1663–1667. doi: 10.1126/science.1178357. [DOI] [PMC free article] [PubMed] [Google Scholar]
- Roberts RB, Hu Y, Albertson RC, Kocher TD. Craniofacial divergence and ongoing adaptation via the hedgehog pathway. Proceedings of the National Academy of Sciences USA. 2011;108:13194–13199. doi: 10.1073/pnas.1018456108. [DOI] [PMC free article] [PubMed] [Google Scholar]
- Roberts RB, Ser JR, Kocher TD. Sexual conflict resolved by invasion of a novel sex determiner in Lake Malawi cichlid fishes. Science. 2009;326:998–1001. doi: 10.1126/science.1174705. [DOI] [PMC free article] [PubMed] [Google Scholar]
- Rosenblum EB, Römpler H, Schöneberg T, Hoekstra HE. Molecular and functional basis of phenotypic convergence in white lizards at White Sands. Proceedings of the National Academy of Sciences USA. 2010;107:2113–2117. doi: 10.1073/pnas.0911042107. [DOI] [PMC free article] [PubMed] [Google Scholar]
- Seehausen O, van Alphen JJM, Lande R. Color polymorphism and sex ratio distortion in a cichlid fish as an incipient stage in sympatric speciation by sexual selection. Ecology Letters. 1999;2:367–378. [Google Scholar]
- Ser JR, Roberts RB, Kocher TD. Multiple interacting loci control sex determination in Lake Malawi cichlid fish. Evolution. 2010;64:486–501. doi: 10.1111/j.1558-5646.2009.00871.x. [DOI] [PMC free article] [PubMed] [Google Scholar]
- Torres-Dowdall J, Machado-Schiaffino G, Kautt AF, Kusche H, Meyer A. Differential predation on the two colour morphs of Nicaraguan Crater lake Midas cichlid fish: implications for the maintenance of its gold-dark polymorphism. Biological Journal of the Linnean Society. 2014;112:123–131. [Google Scholar]
- Trewavas E. Lake Albert fishes of the genus Haplochromis. Annals and Magazine of Natural History. 1938;1:435–449. [Google Scholar]
- Van Oppen MJH, Turner GF, Robinson CRC, et al. Assortative mating among rock-dwelling cichlid fishes supports high estimates of species richness from Lake Malawi. Molecular Ecology. 1998;7:991–1001. [Google Scholar]
- van’t Hof AE, Edmonds N, Dalikova M, Marec F, Saccheri IL. Industrial melanism in British peppered moths has a singular and recent mutational origin. Science. 2011;332:958–960. doi: 10.1126/science.1203043. [DOI] [PubMed] [Google Scholar]
- Wellbrock C, Gómez A, Schartl M. Signal transduction by the oncogenic receptor tyrosine kinase Xmrk in melanoma formation of Xiphophorus. Pigment Cell Res. 1997;10:34–40. doi: 10.1111/j.1600-0749.1997.tb00463.x. [DOI] [PubMed] [Google Scholar]
- Winge O. The location of eighteen genes in Lebistes reticulatus. Journal of Genetics. 1927;18:1–43. [Google Scholar]
Associated Data
This section collects any data citations, data availability statements, or supplementary materials included in this article.