

Abstract
Purpose
Ferumoxytol has gained interest as an alternative to gadolinium-based contrast agents (GBCAs). The purpose of this study was to evaluate and optimize ferumoxytol dose and T1 weighting, in comparison to a conventional GBCA.
Materials and Methods
Twelve healthy volunteers (6 women / 6 men, mean age 44.3y) were recruited for this study. Scanning was performed on a clinical 3T MRI system. Gadobenate dimeglumine (GD)-enhanced MRA was performed followed by ferumoxytol (FE)-enhanced MRA one month later. Volunteers were randomly assigned to a diluted (n=6) or undiluted (n=6) dose of GD (0.1 mmol/kg), and to FE doses of 4mg/kg (n=6) or 2mg/kg (n=6). First pass and steady-state MRA were performed for GD- and FE-enhanced MRA. Flip-angle optimization was performed after ferumoxytol administration. Quantitative analysis included relative contrast-to-noise ratio (relCNR) measurements for all acquisitions. First pass GD- and FE-enhanced MRA images were evaluated qualitatively.
Results
RelCNR was significantly higher with undiluted GD (31.8, 95%CI 27.7-35.9) compared to diluted GD (16.2 (12.2-20.3), p=0.001) and both 4mg/kg FE (12.5 (8.5-16.4), p<0.001) and 2mg/kg FE (9.1 (5.1-13.2), p<0.001) during first pass. Relative CNR did not decrease with ferumoxytol 5 min post injection compared to GD. Flip-angle analysis revealed relative CNR-peaks at 30° for FE 4mg/kg and at 20° for FE 2mg/kg. Diluted GD (p=0.013) and FE 4mg/kg (p=0.01) revealed significantly higher image quality scores compared to undiluted GD during first pass.
Conclusion
This study shows an equivalent image quality of FE and GD for first pass MRA even though GD showed significantly higher relative CNR.
Keywords: Ferumoxytol, Gadobenate Dimeglumine, Contrast Dose, Contrast Dilution
Introduction
Ferumoxytol (Feraheme, AMAG Pharmaceuticals, Inc., Waltham, MA, USA) is an ultra-small superparamagnetic iron oxide (USPIO) particle approved for treatment of anemia in patients with chronic kidney disease [1; 2]. It has gained recent interest as an off-label positive contrast agent for magnetic resonance imaging (MRI)[3].
Ferumoxytol was first described as a contrast agent for MR angiography (MRA) by Prince et al in 2003 [4]. Since then, it has successfully been applied in adult and pediatric patient populations as an alternative to gadolinium-based contrast agents (GBCAs) [5-8]. The absence of gadolinium makes ferumoxytol an attractive alternative for patients with renal failure who may be at elevated risk of nephrogenic systemic fibrosis (NSF) [9]. Furthermore, the long intravascular half-life of approximately 14-15 hours allows for longer acquisitions with constant intravascular signal, suited for high resolution, steady-state acquisitions [6]. Additionally, the long plateau of intravascular signal enables high quality imaging of the venous system through navigator-based approaches [5].
Despite these characteristics that are well suited for vascular imaging applications, challenges remain when using ferumoxytol as a contrast agent. In addition to its high longitudinal relaxivity, it has significant T2* shortening that must be considered when optimizing clinical acquisition protocols [10]. Indeed, this effect can lead to thrombus-mimicking artifacts due to rapid dephasing, even with short TE sequences [11]. These dose- and MR-sequence parameter dependent artifacts highlight the need for optimized protocols when using ferumoxytol as an MR contrast agent. However, few publications have focused on the optimization of MR sequence parameters as well as finding the optimal/lowest suitable dose for gadolinium and iron oxide containing contrast agents [10; 12]. Although ferumoxytol has a favorable safety profile, clinical risks must be considered. Most adverse events are mild and transient. However, a rate of severe adverse events between 0.02% and 1.3% including hypersensitivity and hypotension has been reported [13-15].
The purpose of this work was to compare ferumoxytol-enhanced MRA to conventional gadolinium-enhanced MRA. As a secondary aim, a flip angle dependent CNR evaluation was performed in steady state after FE administration.
Methods
This prospective study was Health Insurance Portability and Accountability Act (HIPAA) compliant and approved by the local institutional review board (IRB). 13 volunteers with no known significant health problems were recruited from a local IRB-approved database of healthy volunteers. All volunteers signed an IRB-approved informed consent form.
Study protocol
The study consisted of two separate visits for each subject, separated by four weeks, for a total of 24 independent imaging exams (Table 1).
Table 1.
Flowchart of the study protocol: The upper row consists of the injection protocols at visit 1 (volunteers randomly assigned to undiluted or diluted GD). The lower row consists of the injection protocols at visit 2 (volunteers randomly assigned to ferumoxytol 4mg/kg or 2mg/kg). The connectors indicate the number of volunteers receiving the same combination of injection protocols.

|
Visit 1: Gadobenate dimeglumine (Multihance, Bracco, Milan, Italy, is abbreviated to GD in this report) enhanced MRA was performed. Volunteers were randomly assigned to either an undiluted bolus of (0.1 mmol/kg) or a diluted bolus (0.1 mmol/kg, diluted up to 40 ml with normal saline). Both injections were followed by a 20ml saline chaser.
Visit 2: Ferumoxytol (Feraheme, AMAG Pharmaceuticals, Waltham, MA, USA, abbreviated to FE) enhanced MRA was performed using the same MR parameters as for GD-enhanced MRA. Volunteers were again randomly assigned to either 4mg/kg (0.07 mmol/kg, n=6, abbreviated to FE4mg) or 2mg/kg (0.035 mmol/kg, n=6, abbreviated to FE2mg). Both doses were diluted up to 60 ml with saline, followed by a 20 ml saline chaser. Injection parameters followed recently issued guidelines for the use of ferumoxytol as a contrast agent from the ISMRM [16]. The doses in this study were chosen based on the typical imaging doses in the literature as well as the current guidelines [7; 16]. As the usage of ferumoxytol for MR-imaging is currently off-label use, no dose recommendations from the manufacturer exist.
All injections were performed using a power injector (Spectris Solaris, MedRad Inc., Warrendale, PA) at 2ml/s for all injections. Fluoroscopic triggering was used to define the contrast injection start.
The four-week separation between GD and FE injections was selected to ensure complete elimination of GD from the body before FE injection and imaging. FE remains for several months within cells of the reticuloendothelial system and may lead to strong MR signal changes [17], therefore FE was not injected at the first visit of this crossover study.
All volunteers were monitored during the MRI examination and blood pressure monitoring was continued 1h after completion of the MR scan. Subjects were assessed for adverse events before discharge.
MR Imaging
All imaging was performed on a clinical 3.0T MR system (MR750, GE Healthcare, Waukesha, WI, USA) using a 32-channel phased-array body coil (Neocoil, Pewaukee, WI, USA). First pass MRA was acquired using a standard spoiled-gradient-echo MRA-sequence (scan time: 22s) acquired in a single breath-hold. The coronal acquisitions for both GD- and FE-enhanced MRA were performed with the following parameters: TR/TE = 4.54/1.40ms, BW = +/- 125 kHz, FOV = 400 × 360 × 320mm3, 224 × 160 × 160 matrix, for true spatial resolution of 1.8 × 2.5 × 2.0 mm3 (zero-padded to give interpolated spatial resolution of 0.8 × 0.8 × 1.0 mm3), and flip angle of 50°. The 3D k-space matrix was filled using conventional elliptical centric ordering, and real-time fluoro-triggering was used to time the arrival of the bolus to the abdominal aorta.
During both visits, MRA imaging was performed during the first pass arterial phase, 50s after the completion of the arterial phase (in this study called venous phase), and finally a 5-minute delayed phase. Additionally, for visit 2 (FE), imaging was performed in steady state with flip angle varying between 10 and 50°, in increments of 10°. For technical reasons, the flip angle was decreased from 50° to 10° in descending order, in order to maintain constant receiver gain and constant TR and TE. The receiver bandwidth was also kept constant for all acquisitions. The acquisition with a flip angle of 50° was repeated to exclude differences in intravascular signal between the acquisitions.
Image analysis
Both qualitative and quantitative analyses were performed using open-source DICOM viewer software (OsiriX, Pixmeo, Geneva, Switzerland).
Quantitative analysis
Relative contrast-to-noise ratios (CNR) were calculated instead of absolute CNR and signal-to-noise (SNR) measurements due to use of parallel imaging [18; 19] using the following formula:
where SIAO refers to the signal intensity of the aorta after contrast administration, SIREF refers to the signal intensity of the reference tissue (muscle / liver) after contrast administration and SIREF_PRE refers to the signal intensity of the reference tissue before contrast administration.
Relative CNRs between GD- and FE-enhanced MRA acquisitions were calculated to compare the contrast between artery and muscle and between artery and liver parenchyma for first pass, venous phase (50s) and delayed 5 minute phase.
Furthermore, relative CNRs were calculated for MRA acquisitions with different flip angle after FE administration in the steady state as described in the MR imaging section. Images were reconstructed online and DICOMs were transferred to an OsiriX workstation for evaluation.
A board-certified radiologist with 8 years experience in body MRA (T.S.) drew all regions of interest (ROIs). To verify the same location, ROIs were copied to identical positions in all acquisitions. In order to account for differences in the behavior of the noise variance in the background region in magnitude images acquired with multi-channel coils, pairwise ROIs were drawn in closest possible proximity in order to minimize the signal and noise variance due to location. To measure relative CNR of artery and liver, ROIs were placed in the abdominal aorta at the level of the diaphragm and in the liver segment IV or VIII. For relative CNR of artery and muscle, ROIs were placed in the aorta immediately above the bifurcation and in the psoas muscle.
Vessel sharpness was assessed objectively in the descending aorta by drawing a linear signal profile in an axial slice (Figure 1) and calculating the slope of the signal intensity change per millimeter from outside to inside of the vessel as well as the edge width (distance from valley to peak of the edge).
Figure 1.
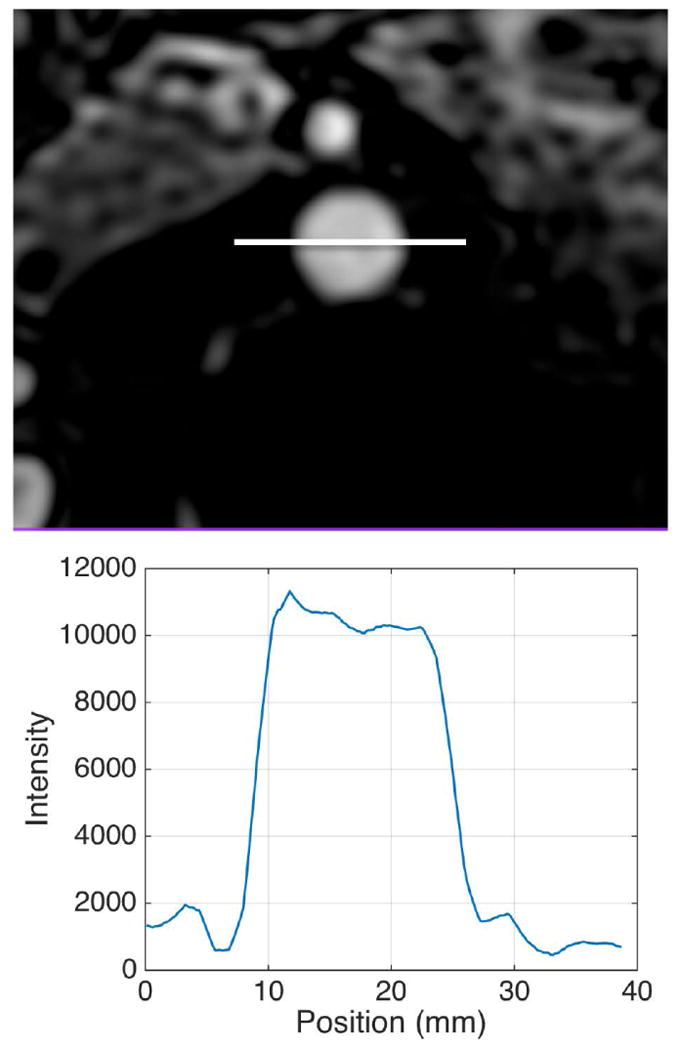
Example of vessel sharpness analysis of the aorta in an axial image. The signal intensity profile along the white line through the aorta cross section is plotted below the MR image (diluted GD enhanced MRA).
Qualitative analysis
Two radiologists experienced in cross sectional vascular imaging (reader 1: 11 years of experience (S.K.), reader 2: 8 years of experience (T.S.)) independently evaluated all first pass MRA datasets. The following vessels were evaluated: Aorta, thoracic segmental and lumbar arteries, 1st to 3rd order branches of celiac trunk, superior mesenteric and renal arteries. Both radiologists were blinded to the type of contrast medium, volunteer data, and the other reader's assessment. Images were assessed with regard to overall image quality, vessel contrast and artifacts. These three parameters were rated on a five-point scale as follows according to Erb-Eigner et al [20]. Overall image quality: excellent (5), good (4), moderate (3), poor (2) and not interpretable (1). Vessel contrast: excellent (5), good (4), moderate (3), poor with limited interpretability (2) and not interpretable (1). Artifacts: no artifacts (5), mild artifacts (4), moderate artifacts (3), substantial artifacts with limited interpretability (2), and not interpretable (1).
Statistical Analysis
For quantitative measurements, the following statistical analyses were performed. Relative CNR was compared between the four groups (FE4mg, FE2mg, diluted GD, and undiluted GD) with repeated measures analysis of variance (RM-ANOVA). RM-ANOVA models were fit separately for relative CNR of the first pass, venous, and late (5min p.I.) acquisitions. As response variables, group was a fixed effect and subject was a random effect. Relative CNR for flip angle 10°, 20°, 30°, and 40° were compared between the FE4mg, and FE2mg groups using separate RM-ANOVA models with group as a fixed effect and subject as a random effect.
Edge width and slope were also analyzed with similar RM-ANOVA models to assess differences between the four groups. If a significant (p<0.05) F-test was found in any RM-ANOVA model, then family-wise Tukey post-hoc p-value adjustments were made when comparing the means between any two groups.
For qualitative measurements, the following statistical analyses were performed. Intra-rater agreement, assessed by Cohen's weighted Kappa with 95% confidence intervals (CI), was calculated for readers' ratings of vessel contrast, artifacts, and overall image quality. Due to the high percentage of ratings of 5 for vessel contrast (75.2%), artifacts (90.3%) and overall image quality (70.8%) and very infrequent ratings of 2 or 3, all three image quality variables were dichotomized as rating = 5 and rating ≤ 4. To test for differences in the proportion of ratings of 5 for each image quality variable, individual mixed effects logistic regression models were used with group as a fixed effects and subject and rater as random effects. If a significant difference was found between groups, then post-hoc Holm adjusted p-values for all two-way comparisons were used.
All analyses were performed using R [The R Foundation] for statistical computing [21]. All tests were conducted using an a-priori 0.05 significance level.
Results
12 volunteers completed the study protocol (6 women / 6 men, mean age 44.3±12.2 years, mean body mass index (BMI) of 29.7±5.4). One volunteer withdrew from the study after the first visit.
All 24 imaging exams were successfully completed without any technical difficulties. Furthermore, no immediate adverse events were observed during or after ferumoxytol or gadolinium administration.
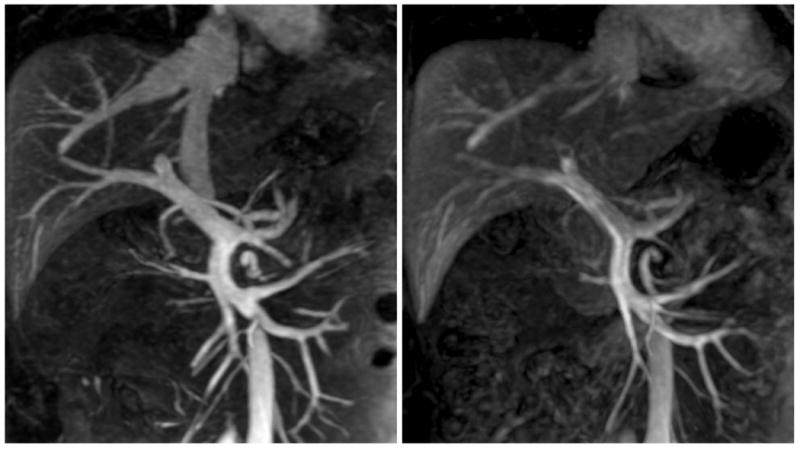
Figure 2 shows representative maximum intensity projections (MIPs) of the arterial phase MRA performed with FE4mg and undiluted GD with comparable image quality. Figure 3 shows an example of the venous phase of FE-enhanced MRA in one of the normal volunteers, compared to GD-enhanced MRA with an undiluted bolus. Note the greater CNR with ferumoxytol due to the long intravascular half-life. Figure 4 shows a case of a prominent right inferior phrenic artery imaged with FE2mg (left) and undiluted GD (right). Note the improved depiction of the origin of the vessel in the ferumoxytol-enhanced image due to less edge blurring. Figure 5 shows an example of multiple renal arteries originating in close proximity of each other imaged with FE4mg (left, relCNR 9.8) and diluted GD (right, relCNR 18.5) with equivalent image quality but higher relative CNR with GD.
Figure 2.

35mm maximum intensity projections (MIPs) of first pass MRA performed with FE4mg (A, left, relCNR 16.6) and undiluted GD (B, right, relCNR 32.9). Note the absent contrast uptake in the kidneys with ferumoxytol.
Figure 3.
Comparison of FE4mg (left, relCNR 9.2) and undiluted GD (right, relCNR 6.8) in the venous phase (20 mm MIPs). Note the excellent vessel depiction with ferumoxytol due to the long intravascular half-life.
Figure 4.

Case of a prominent right inferior phrenic artery (arrows) imaged with FE2mg (left, relCNR 5.8) and undiluted GD (right, relCNR 34.3). Note the improved depiction of the origin of the vessel in the left image due to less edge blurring (20 mm MIPs).
Figure 5.

Case of multiple renal arteries originating in close proximity imaged with FE4mg (left, relCNR 9.8) and diluted GD (right, relCNR 18.5) with equivalent image quality but higher relCNR with GD (20 mm MIPs).
Quantitative analysis
Relative contrast-to-noise ratios
Relative CNR (relCNR) results are summarized in Figure 6. For contrast between the aorta and muscle during first pass, relCNR was highest with undiluted GD (mean 31.8, (95%CI 27.7 - 35.8) followed by diluted GD (16.2 (12.2 - 20.3), p=0.001), FE4mg (12.4 (8.5 - 16.4), p<0.001) and FE2mg (9.1 (5.1 - 13.2), p<0.001). For contrast between aorta and liver, relCNR was highest with undiluted GD (22 (18.1 - 26)) followed by diluted GD (13.4 (9.5 - 17.3), p=0.027), FE4mg (7.1 (3.3 - 10.9), p<0.001) and FE2mg (5 (1.1 - 9), p<0.001). Furthermore, diluted GD revealed significantly higher relCNR than FE2mg (p=0.03).
Figure 6.

Relative CNR evolution over time for aorta and muscle as reference tissues for the different contrast injections. During first pass, GD enhanced MRA revealed significantly higher relCNR than FE enhanced MRA. In the venous phase, undiluted GD enhanced MRAs and FE2mg show equivalent relCNR. FE4mg shows significantly higher relCNR and diluted GD lower relCNR than all other acquisitions. At 5 min p.I., relCNR of FE enhanced MRA remains relatively constant while relCNR of GD enhanced MRA decrease significantly. All significant differences are indicated in the results section.
In the venous phase (50s after injection), relCNR between aorta and muscle was highest with FE4mg (9.54, (95%CI 8.2 - 10.9)) followed by undiluted GD (6.9 (5.5 - 8.3), p=0.003), FE2mg (6.6 (5.2 - 8), p=0.003), and diluted GD (5.1 (3.6 - 6.5), p<0.001). Furthermore, relCNR was significantly higher with non-diluted GD compared to diluted GD (p=0.04). RelCNR between aorta and liver was highest with FE4mg (4.4 (3.6 - 5.1)) followed by FE2mg (2.6 (1.8 - 3.4), p=0.024), undiluted GD (2.5 (1.7 - 3.3), p=0.02) and diluted GD (2.1 (1.3 - 2.9), p=0.005).
In the delayed phase (5min after injection), relCNR between aorta and muscle was highest with FE4mg (10.3 (9.2 - 11.5)) followed by FE2mg (5.7 (4.6 - 6.9), p<0.001), undiluted GD (3.6 (2.5 - 4.8), p<0.001) and diluted GD (2.5 (1.4 - 3.7), p<0.001). Furthermore, relCNR was significantly higher for FE2mg compared to diluted GD (p=0.001) and undiluted GD (p=0.02). RelCNR between aorta and liver were highest with FE4mg (4.54 (4.12 - 4.96)) followed by FE2mg (2.26 (1.84 - 2.68), p<0.001), undiluted GD (1.10 (0.68 - 1.53), p<0.001) and diluted GD (1.02 (0.60 - 1.44), p<0.001). Furthermore, relCNR was significantly higher for FE2mg compared to diluted GD (p>0.001) and undiluted GD (p>0.001).
Relative CNR values for different flip angles with FE-enhanced MRA
The results of the flip angle optimization are summarized in Table 2. Flip angle optimization was performed during steady state (delayed phase). RelCNR for FE4mg was maximized at a 30° flip angle for contrast between aorta and muscle, as well as contrast between aorta and liver. For FE2mg, relCNR showed a maximum at a flip angle of 20° for contrast between aorta and muscle, as well as contrast between aorta and liver.
Table 2.
Relative CNR values of the different flip angle (FA) acquisitions during steady state with ferumoxytol 4mg/kg (FE4) and 2mg/kg (FE2). P-values in bold letters indicate significant differences.
| Aorta/Muscle | Aorta/Liver | |||
|---|---|---|---|---|
| Flip angle 50 | Flip angle 50 | |||
| Estimated Mean (95% CI) | ANOVA P | Estimated Mean (95% CI) | ANOVA P | |
| FE4 | 10.43 (8.76 - 12.09) | < 0.001 | 4.38 (3.77 - 4.99) | < 0.001 |
| FE2 | 5.69 (4.02 - 7.36) | 2.58 (1.97 - 3.19) | ||
| FA 40 | FA 40 | |||
| Estimated Mean (95% CI) | ANOVA P | Estimated Mean (95% CI) | ANOVA P | |
| FE4 | 12.57 (10.86 - 14.27) | < 0.001 | 5.13 (4.50 - 5.77) | < 0.001 |
| FE2 | 7.26 (5.55 - 8.97) | 3.27 (2.63 - 3.90) | ||
| FA 30 | FA 30 | |||
| Estimated Mean (95% CI) | ANOVA P | Estimated Mean (95% CI) | ANOVA P | |
| FE4 | 12.99 (10.92 - 15.07) | 0.008 | 5.50 (4.42 - 6.57) | 0.072 |
| FE2 | 8.69 (6.61 - 10.76) | 4.13 (3.06 - 5.20) | ||
| FA 20 | FA 20 | |||
| Estimated Mean (95% CI) | ANOVA P | Estimated Mean (95% CI) | ANOVA P | |
| FE4 | 11.71 (8.37 - 15.05) | 0.343 | 4.67 (2.80 - 6.54) | 0.853 |
| FE2 | 9.60 (6.26 - 12.94) | 4.90 (3.03 - 6.76) | ||
| FA 10 | FA 10 | |||
| Estimated Mean (95% CI) | ANOVA P | Estimated Mean (95% CI) | ANOVA P | |
| FE4 | 7.93 (4.54 - 11.32) | 0.779 | 2.87 (0.99 - 4.75) | 0.365 |
| FE2 | 7.31 (3.92 - 10.70) | 4.00 (2.12 - 5.88) | ||
| FA 50 repeat | FA 50 repeat | |||
| Estimated Mean (95% CI) | ANOVA P | Estimated Mean (95% CI) | ANOVA P | |
| FE4 | 10.47 (8.81 - 12.13) | 0.001 | 4.34 (3.80 - 4.88) | < 0.001 |
| FE2 | 5.61 (3.95 - 7.27) | 2.45 (1.91 - 2.99) | ||
RelCNR was significantly higher with FE4mg compared to FE2mg with flip angles of 50° and 40° for both contrast between aorta and muscle and aorta and liver (p<0.001 – 0.024). With a flip angle of 30°, relCNR was significantly higher for FE4mg, vs FE2mg for contrast between aorta and muscle (p=0.008). Results are summarized in Figure 7.
Figure 7.

Relative contrast to noise ratio (y-axis) between aorta and reference tissue (muscle, left, A; liver, right, B) as a function of flip angle (x-axis) for FE enhanced MRA in the steady state. The black data points display FE4mg and the red FE2mg. Error bars represent the 95% CI. P-values at the upper boarder represent differences of FE4mg and FE2mg.
Vessel sharpness
The edge width of the aorta was narrowest for FE2mg (Estimated Mean: 1.90 (95% confidence interval 1.08 - 2.72) followed by FE4mg (EM: 2.46 (95%: CI 1.64 - 3.28)), diluted GD (EM: 2.66 (95% CI: 1.84 - 3.48)) and undiluted GD (EM: 3.98 (95% CI: 3.16 - 4.80)). Significant differences were detected between undiluted GD and FE2mg (p<0.001) and between undiluted GD and FE4mg (p=0.016). The slope of signal intensity was highest for undiluted GD (EM: 2828 signal intensity units/mm (95% CI: 2204 - 3453)) followed by diluted GD (EM: 2069 (95% CI: 1445 - 2693)), FE4mg (EM: 1769 (95% CI: 1145 - 2394) and FE2mg (EM: 1313 (95% CI: 689 – 1938)). Significant differences were detected between undiluted GD and FE2mg (p=0.001) and between undiluted GD and FE4mg (p=0.043).
Qualitative analysis
Results of the qualitative analysis are summarized in Table 3.
Table 3.
Summary of the results of the qualitative analysis. N (%) indicates the number of segments with the rating 5 (best) for each parameter. Mixed GLM refers to mixed general linear model. P-values in bold letters indicate statistical significances.
| Vessel Contrast = 5 | ||||
| N (%) | Mixed GLM P | Contrasts | Adjusted P | |
| FE4 | 107 (81.1%) | 0.011 | FE4 vs FE2 | 1 |
| FE2 | 98 (74.2%) | FE4 vs GD | 1 | |
| GD – Diluted (GD) | 104 (78.8%) | FE4 vs GU | 0.006 | |
| GD – Undiluted (GU) | 88 (66.7%) | FE2 vs GD | 1 | |
| FE2 vs GU | 1 | |||
| GD vs GU | 0.363 | |||
| Artifacts = 5 | ||||
| N (%) | Mixed GLM P | Contrasts | P-value | |
| FE4 | 119 (90.2%) | 0.009 | FE4 vs FH | 0.841 |
| FE2 | 124 (93.9%) | FE4 vs GD | 1 | |
| GD – Diluted (GD) | 120 (90.9%) | FE4 vs GU | 0.841 | |
| GD – Undiluted (GU) | 114 (86.4%) | FE2 vs GD | 1 | |
| FE2 vs GU | 0.010 | |||
| GD vs GU | 1 | |||
| Image Quality = 5 | ||||
| N (%) | Mixed GLM P | Contrasts | P-value | |
| FE4 | 103 (78.0%) | 0.008 | FE4 vs FE2 | 1 |
| FE2 | 96 (72.7%) | FE4 vs GD | 1 | |
| GD – Diluted (GD) | 104 (78.8%) | FE4 vs GU | 0.010 | |
| GD – Undiluted (GU) | 71 (53.8%) | FE2 vs GD | 1 | |
| FE2 vs GU | 0.647 | |||
| GD vs GU | 0.013 | |||
Overall image quality was rated best significantly more often with diluted GD (78.8%) compared to undiluted GD (p=0.013) and with FE4mg (78.0%) compared to undiluted GD (53.8%, p=0.01). Further comparisons revealed no significant differences.
Vessel contrast was rated best significantly more often with FE4mg (81.1%) compared to undiluted GD (66.7%, p=0.006). Further comparisons revealed no significant differences.
Artifacts were rated least significantly more often with FE2mg (93.9%) compared to undiluted GD (86.4%, p=0.01). The artifacts observed consisted of image blurring and truncation (ringing) artifacts that were observed inside and outside the vessel, most visible in larger vessels.
The differences in artifact incidence and severity were not significant between the different contrast injections (table 3).
Further comparisons revealed no significant differences.
Inter-reader agreement was excellent for image quality (kappa value of 0.83), moderate for vessel contrast (k=0.48) and good for artifacts (k=0.67).
Discussion
In this study, we prospectively compared ferumoxytol-enhanced and gadobenate-dimeglumine-enhanced MRA. Our study revealed comparable image quality of GD and FE enhanced MRA during first pass, even though GD enhanced MRA showed higher relative CNR. The best qualitative imaging scores were achieved with diluted GD and FE4mg,. However, FE2mg also demonstrated good qualitative imaging scores making it a valuable and cost effective alternative to the higher dose. FE-enhanced MRA showed excellent CNR performance and constant intravascular signal during steady state acquisitions, making it greatly suited for venous imaging.
Flip angle analysis for FE-enhanced MRA revealed different CNR optima for FE4mg, and FE2mg indicating that lowering the flip angle with lower doses might further increase performance.
Apart from the injected agent, a factor that is likely to influence image quality in our study is the contrast bolus volume and subsequently its injection time, which was shortest for undiluted GD and longest for the FE injections. A longer injection at the same rate is likely to result in less intravascular signal variability during acquisition. This results in higher signal intensity during sampling of the k-space periphery, which occurs at later stages in the acquisition of modern MRA readout ordering. Greater signal during sampling of high spatial frequencies increases the image detail of small vessels and vessel borders [22; 23]
In our study, the contrast bolus was extended through dilution. When using ferumoxytol as an MRA contrast agent, dilution of the contrast bolus is mandatory and a bolus volume between 24 and 60 ml is generally used [16]. To match the bolus geometry of the FE-injections in our study, we injected GD with a diluted bolus comparable to the FE injections in a subset of volunteers. However, dilution results in a prolonged plateau phase at the expense of peak signal intensity.
The results of the qualitative analysis suggest that the supposedly lower signal variability during MRA acquisition with a diluted contrast bolus outweighs the lower peak signal intensity. Accordingly, a large volume bolus with intermediate intravascular signal, together with a narrow edge width, resulted in the highest image quality during first pass in our study (diluted GD and FE4mg).
Several studies focused on the optimization of contrast injections for MRA [22; 24-30]. Measures to achieve a constant intravascular signal during MR acquisition included slow infusion of contrast agent [30], ramp injection [28], increased contrast doses [24] and greater volumes of saline to chase the contrast bolus [24; 25].
In the steady state, the constant high relative CNR underlines the efficacy of ferumoxytol as a blood pool agent, which is not only beneficial for long MR-acquisitions, but also for high-resolution imaging of the venous system [6]. Lastly, our results indicate that optimizing the flip angle as a function of FE dose could further increase relative CNR. This might be beneficial in terms of image quality when low doses of ferumoxytol are used.
Our study had several limitations. The number of subjects is relatively small in each group. Nevertheless, our results are clear and plausible, and the inter-reader agreement is reasonable with a very high agreement for overall image quality. Furthermore, we did not perform the flip angle optimization with randomly ordered flip angles. However, this is more relevant for contrast agents where signal changes during the steady state phase are expected.
The comparable image quality of FE- and GD-enhanced MRA that we found in our study is in accordance with a previous report on patients with peripheral arterial disease [31] and an initial clinical comparison with a variety of vascular tests including GBCA enhanced MRA [3].
It must be noted that ferumoxytol is currently not approved for imaging purposes. Therefore, the described application of ferumoxytol in this report is an off-label use.
As a future direction, randomized patient studies are important to evaluate the performance of ferumoxytol in patients. We did not perform a patient study up front in order to not confound our results with the presence of disease. Furthermore, varying the injection rate with a fixed contrast dilution to further optimize image quality is an interesting topic for future studies.
In conclusion, our study demonstrated equivalent image quality for both FE- and GD-enhanced first pass MRA. Our results further indicate that dilution of the GD contrast results in increased image quality, most likely due to less temporal variation of the intravascular signal. Lastly, ferumoxytol is able to achieve high image quality with a dose of 2mg/kg. Adjusting the flip angle to dose might improve image contrast and quality even further.
Acknowledgments
The authors thank Jenelle Fuller, Sara John and Kelli Hellenbrand for recruiting and scanning the subjects. The authors also gratefully acknowledge the support of the Department of Radiology UW Wisconsin Madison Research and Development Committee. Furthermore, the authors wish to acknowledge GE Healthcare and Bracco Diagnostics who provide research support to the University of Wisconsin
Grant Support: This work was supported by the NIH (K24 DK102595). Tilman Schubert is supported by a fellowship grant (Helmut-Hartweg-Fonds) from the Swiss Academy of Medical Sciences.
References
- 1.Lu M, Cohen MH, Rieves D, Pazdur R. FDA report: Ferumoxytol for intravenous iron therapy in adult patients with chronic kidney disease. Am J Hematol. 2010;85:315–319. doi: 10.1002/ajh.21656. [DOI] [PubMed] [Google Scholar]
- 2.Spinowitz BS, Kausz AT, Baptista J, et al. Ferumoxytol for treating iron deficiency anemia in CKD. J Am Soc Nephrol. 2008;19:1599–1605. doi: 10.1681/ASN.2007101156. [DOI] [PMC free article] [PubMed] [Google Scholar]
- 3.Li W, Tutton S, Vu AT, et al. First-pass contrast-enhanced magnetic resonance angiography in humans using ferumoxytol, a novel ultrasmall superparamagnetic iron oxide (USPIO)-based blood pool agent. J Magn Reson Imaging. 2005;21:46–52. doi: 10.1002/jmri.20235. [DOI] [PubMed] [Google Scholar]
- 4.Prince MR, Zhang HL, Chabra SG, Jacobs P, Wang Y. A pilot investigation of new superparamagnetic iron oxide (ferumoxytol) as a contrast agent for cardiovascular MRI. J Xray Sci Technol. 2003;11:231–240. [PubMed] [Google Scholar]
- 5.Bashir MR, Mody R, Neville A, et al. Retrospective assessment of the utility of an iron-based agent for contrast-enhanced magnetic resonance venography in patients with endstage renal diseases. J Magn Reson Imaging. 2014;40:113–118. doi: 10.1002/jmri.24330. [DOI] [PubMed] [Google Scholar]
- 6.Han F, Rapacchi S, Khan S, et al. Four-dimensional, multiphase, steady-state imaging with contrast enhancement (MUSIC) in the heart: A feasibility study in children. Magn Reson Med. 2015;74:1042–1049. doi: 10.1002/mrm.25491. [DOI] [PubMed] [Google Scholar]
- 7.Hope MD, Hope TA, Zhu C, et al. Vascular Imaging With Ferumoxytol as a Contrast Agent. AJR Am J Roentgenol. 2015;205:W366–373. doi: 10.2214/AJR.15.14534. [DOI] [PMC free article] [PubMed] [Google Scholar]
- 8.Nayak AB, Luhar A, Hanudel M, et al. High-resolution, whole-body vascular imaging with ferumoxytol as an alternative to gadolinium agents in a pediatric chronic kidney disease cohort. Pediatr Nephrol. 2015;30:515–521. doi: 10.1007/s00467-014-2953-x. [DOI] [PMC free article] [PubMed] [Google Scholar]
- 9.Bashir MR, Jaffe TA, Brennan TV, Patel UD, Ellis MJ. Renal transplant imaging using magnetic resonance angiography with a nonnephrotoxic contrast agent. Transplantation. 2013;96:91–96. doi: 10.1097/TP.0b013e318295464c. [DOI] [PubMed] [Google Scholar]
- 10.Reeder SB, Smith MR, Hernando D. Mathematical optimization of contrast concentration for t -weighted spoiled gradient echo imaging. Magn Reson Med. 2015 doi: 10.1002/mrm.25744. 10.1002/mrm.25744. [DOI] [PubMed] [Google Scholar]
- 11.Fananapazir G, Marin D, Suhocki PV, Kim CY, Bashir MR. Vascular artifact mimicking thrombosis on MR imaging using ferumoxytol as a contrast agent in abdominal vascular assessment. J Vasc Interv Radiol. 2014;25:969–976. doi: 10.1016/j.jvir.2013.12.019. [DOI] [PubMed] [Google Scholar]
- 12.Maki JH, Neligan PC, Briller N, Mitsumori LM, Wilson GJ. Dark Blood Magnetic Resonance Lymphangiography Using Dual-Agent Relaxivity Contrast (DARC-MRL): A Novel Method Combining Gadolinium and Iron Contrast Agents. Curr Probl Diagn Radiol. 2015 doi: 10.1067/j.cpradiol.2015.08.003. 10.1067/j.cpradiol.2015.08.003. [DOI] [PubMed] [Google Scholar]
- 13.Macdougall IC, Strauss WE, McLaughlin J, Li Z, Dellanna F, Hertel J. A randomized comparison of ferumoxytol and iron sucrose for treating iron deficiency anemia in patients with CKD. Clin J Am Soc Nephrol. 2014;9:705–712. doi: 10.2215/CJN.05320513. [DOI] [PMC free article] [PubMed] [Google Scholar]
- 14.Schiller B, Bhat P, Sharma A. Safety and effectiveness of ferumoxytol in hemodialysis patients at 3 dialysis chains in the United States over a 12-month period. Clin Ther. 2014;36:70–83. doi: 10.1016/j.clinthera.2013.09.028. [DOI] [PubMed] [Google Scholar]
- 15.Vadhan-Raj S, Strauss W, Ford D, et al. Efficacy and safety of IV ferumoxytol for adults with iron deficiency anemia previously unresponsive to or unable to tolerate oral iron. Am J Hematol. 2014;89:7–12. doi: 10.1002/ajh.23582. [DOI] [PMC free article] [PubMed] [Google Scholar]
- 16.Vasanawala SS, Nguyen KL, Hope MD, et al. Safety and technique of ferumoxytol administration for MRI. Magn Reson Med. 2016;75:2107–2111. doi: 10.1002/mrm.26151. [DOI] [PMC free article] [PubMed] [Google Scholar]
- 17.Storey P, Lim RP, Chandarana H, et al. MRI assessment of hepatic iron clearance rates after USPIO administration in healthy adults. Invest Radiol. 2012;47:717–724. doi: 10.1097/RLI.0b013e31826dc151. [DOI] [PubMed] [Google Scholar]
- 18.Dietrich O, Raya JG, Reeder SB, Ingrisch M, Reiser MF, Schoenberg SO. Influence of multichannel combination, parallel imaging and other reconstruction techniques on MRI noise characteristics. Magn Reson Imaging. 2008;26:754–762. doi: 10.1016/j.mri.2008.02.001. [DOI] [PubMed] [Google Scholar]
- 19.Henkelman RM. Measurement of signal intensities in the presence of noise in MR images. Med Phys. 1985;12:232–233. doi: 10.1118/1.595711. [DOI] [PubMed] [Google Scholar]
- 20.Erb-Eigner K, Taupitz M, Asbach P. Equilibrium-phase MR angiography: Comparison of unspecific extracellular and protein-binding gadolinium-based contrast media with respect to image quality. Contrast Media Mol Imaging. 2016;11:71–76. doi: 10.1002/cmmi.1660. [DOI] [PubMed] [Google Scholar]
- 21.Team RC. R Foundation for Statistical Computing; Vienna, Austria: 2013. R: A language and environment for statistical computing. URL http:/ http://www.R-project.org/ [Google Scholar]
- 22.Maki JH, Prince MR, Londy FJ, Chenevert TL. The effects of time varying intravascular signal intensity and k-space acquisition order on three-dimensional MR angiography image quality. J Magn Reson Imaging. 1996;6:642–651. doi: 10.1002/jmri.1880060413. [DOI] [PubMed] [Google Scholar]
- 23.Mezrich R. A perspective on K-space. Radiology. 1995;195:297–315. doi: 10.1148/radiology.195.2.7724743. [DOI] [PubMed] [Google Scholar]
- 24.Boos M, Scheffler K, Haselhorst R, Reese E, Frohlich J, Bongartz GM. Arterial first pass gadolinium-CM dynamics as a function of several intravenous saline flush and Gd volumes. J Magn Reson Imaging. 2001;13:568–576. doi: 10.1002/jmri.1080. [DOI] [PubMed] [Google Scholar]
- 25.Hany TF, McKinnon GC, Leung DA, Pfammatter T, Debatin JF. Optimization of contrast timing for breath-hold three-dimensional MR angiography. J Magn Reson Imaging. 1997;7:551–556. doi: 10.1002/jmri.1880070316. [DOI] [PubMed] [Google Scholar]
- 26.Kopka L, Vosshenrich R, Rodenwaldt J, Grabbe E. Differences in injection rates on contrast-enhanced breath-hold three-dimensional MR angiography. AJR Am J Roentgenol. 1998;170:345–348. doi: 10.2214/ajr.170.2.9456943. [DOI] [PubMed] [Google Scholar]
- 27.Kramer H, Michaely HJ, Requardt M, et al. Effects of injection rate and dose on image quality in time-resolved magnetic resonance angiography (MRA) by using 1.0M contrast agents. Eur Radiol. 2007;17:1394–1402. doi: 10.1007/s00330-006-0493-x. [DOI] [PubMed] [Google Scholar]
- 28.Robert P, Violas X, Santus R, Le Bihan D, Corot C. Optimization of a blood pool contrast agent injection protocol for MR angiography. J Magn Reson Imaging. 2005;21:611–619. doi: 10.1002/jmri.20324. [DOI] [PubMed] [Google Scholar]
- 29.Westenberg JJ, Wasser MN, van der Geest RJ, et al. Scan optimization of gadolinium contrast-enhanced three-dimensional MRA of peripheral arteries with multiple bolus injections and in vitro validation of stenosis quantification. Magn Reson Imaging. 1999;17:47–57. doi: 10.1016/s0730-725x(98)00152-0. [DOI] [PubMed] [Google Scholar]
- 30.Zheng J, Bae KT, Woodard PK, Haacke EM, Li D. Efficacy of slow infusion of gadolinium contrast agent in three-dimensional MR coronary artery imaging. J Magn Reson Imaging. 1999;10:800–805. doi: 10.1002/(sici)1522-2586(199911)10:5<800::aid-jmri26>3.0.co;2-l. [DOI] [PubMed] [Google Scholar]
- 31.Walker JP, Nosova E, Sigovan M, et al. Ferumoxytol-enhanced magnetic resonance angiography is a feasible method for the clinical evaluation of lower extremity arterial disease. Ann Vasc Surg. 2015;29:63–68. doi: 10.1016/j.avsg.2014.09.003. [DOI] [PMC free article] [PubMed] [Google Scholar]