Abstract
Molecular recognition is a highly interdependent process. Subsite couplings within the active site of proteases are most often revealed through conditional amino acid preferences in substrate recognition. However, the potential effect of these couplings on inhibition and thus inhibitor design is largely unexplored. The present study examines the interdependency of subsites in HIV-1 protease using a focused library of protease inhibitors, to aid in future inhibitor design. Previously a series of darunavir (DRV) analogs was designed to systematically probe the S1′ and S2′ subsites. Co-crystal structures of these analogs with HIV-1 protease provide the ideal opportunity to probe subsite interdependency. All-atom molecular dynamics simulations starting from these structures were performed and systematically analyzed in terms of atomic fluctuations, intermolecular interactions, and water structure. These analyses reveal that the S1′ subsite highly influences other subsites: the extension of the hydrophobic P1′ moiety results in 1) reduced van der Waals contacts in the P2′ subsite, 2) more variability in the hydrogen bond frequencies with catalytic residues and the flap water, and 3) changes in the occupancy of conserved water sites both proximal and distal to the active site. In addition, one of the monomers in this homodimeric enzyme has atomic fluctuations more highly correlated with DRV than the other monomer. These relationships intricately link the HIV-1 protease subsites and are critical to understanding molecular recognition and inhibitor binding. More broadly, the interdependency of subsite recognition within an active site requires consideration in the selection of chemical moieties in drug design; this strategy is in contrast to what is traditionally done with independent optimization of chemical moieties of an inhibitor.
Introduction
Human immunodeficiency virus type 1 (HIV-1) protease is a retroviral aspartyl protease that is an essential enzyme required for processing viral polyproteins and maturation of the virus and therefore a key therapeutic target. Highly active antiretroviral therapy (HAART), the current treatment standard, has significantly improved mortality and morbidity rates of patients infected with HIV-1.1−5 HAART is a combination therapy consisting of three or more drugs from two or more classes. Protease inhibitors (PIs) have become a vital component of HAART and key to treatment of HIV-1 infections. The emergence of resistant viruses threatens the efficacy of current PIs and can lead to treatment failure.
Currently, there are eight FDA approved PIs. Darunavir (DRV), the latest PI approved by the FDA, is the most potent antiretroviral drug thanks to a high antiviral activity and high genetic barrier to the development of resistance (https://www.fda.gov/). Multiple mutations throughout the protease are needed to confer significant levels of resistance to DRV. Understanding the driving forces underlying the superior resistance profile of DRV compared to other PIs not only aids the future design of PIs but also due to the wealth of structural information HIV-1 protease is an excellent system to test general design principles that can be applied to other systems.
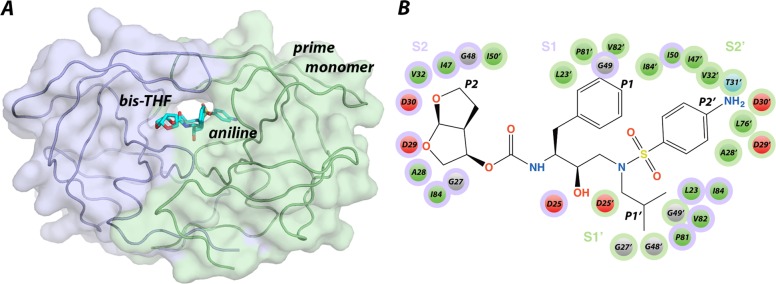
HIV-1 protease is a 99 amino acid homodimer (Figure 1A). The active site of HIV-1 protease can be characterized as a channel that has eight subsites (S4–S1 and S1–S4′). Each subsite position corresponds to an amino acid of the substrate (P4–P1 and P1′–P4′ from N to C terminus) with the scissile bond between the P1–P1′ positions.6 DRV occupies four subsites (S2 to S2′), with P2, P1, P1′, and P2′, making contacts with hydrophobic residues and several aspartic acid residues including catalytic D25 and D25′ (Figure 1B). Because protease contains two identical monomers, by convention the monomer binding the C terminal side of substrates and containing subsites S1′ to S4′ is referred to as the prime monomer. The aniline moiety of DRV by analogy of peptidomimetics corresponds to P2′, while the bis-THC moiety is assigned to P2 (Figure 1B).
Figure 1.
A) HIV-1 protease bound to DRV (PDB ID: 1T3R). Protease is a symmetric homodimer (monomers in purple and green) where each monomer is comprised of 99 amino acids but binds asymmetric substrates and inhibitors. By convention the residues and subsites within the monomer that binds the C-terminal side of peptide substrates or the aniline moiety of DRV are referred to as the prime residues to distinguish between the identical monomers. B) Chemical structure of DRV with P2 to P1 and P1′ to P2′ moieties labeled. Subsites S2 to S2′ correspond to the residues that make up the binding cleft for each ligand moiety P2 to P2′ (indicated by purple and light green as in panel A). HIV-1 protease active site residues that interact with DRV are depicted in green for hydrophobic, red for acidic, and gray for glycine.
The substrate envelope hypothesis has been shown to be an effective strategy to explain the molecular mechanism of drug resistance mutations and guide the design of new resistance-proof inhibitors.7−14 Where inhibitors exceed the substrate envelope are probable sites for resistance mutations to occur, and inhibitors designed to fit within the volume that the endogenous substrates occupy are less prone to resistance.15−18 DRV has been evaluated against the substrate envelope and fits well within this constrained volume.12−14 Previous studies found that the isopropyl functional group at the P1′ position of DRV did not fully fill the substrate envelope, and thus larger P1′ moieties could be explored.12 Further, free energy decomposition studies of HIV-1 protease mutants bound to DRV showed that replacement of the isopropyl (P1′) and aniline (P2′) groups could improve potency and the resistance profile.19,20 Resistance mutations V82A and I84V increase the size of the active site because the substituted amino acids are smaller in size, and in response the P1′ and P2′ groups adopt an alternate conformation that leads to a loss of van der Waals contacts.
A series of DRV analogs was designed to optimize the DRV scaffold by altering the functional groups at the P1′ and P2′ positions while maintaining the constraints of the substrate envelope (Table 1). Two functional groups, methyl-butyl and ethyl-butyl, were evaluated at the P1′ position with five different moieties at the P2′ position for a total of ten DRV analogs. Structure, enzymatic activity, antiviral activity, and pharmacokinetic properties of these inhibitors were evaluated with wild-type protease and resistant variants.13 All inhibitors, like DRV, have low picomolar enzymatic potency and antiviral activity superior to DRV, and several inhibitors also exhibited good microsomal stability. Additionally, high-resolution X-ray crystal structures of the DRV series bound to wild-type HIV-1 protease have been determined, and the inhibitors were found to fit well within the substrate envelope as designed. Previous design and characterization of these DRV analogs (Table 1) provide a unique opportunity to determine the coupled subsite relationships within the active site of HIV-1 protease in molecular recognition and inhibition.
Table 1. DRV and 10 Analogs Designed To Optimally Fill the Substrate Envelope and Evaluated in This Studya.
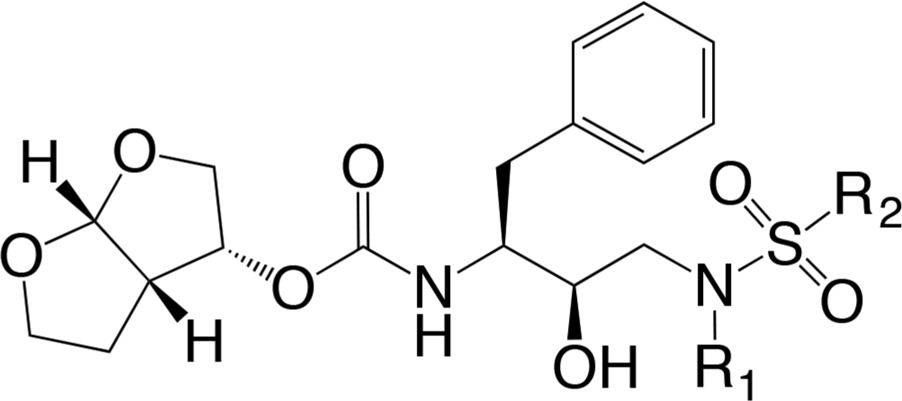
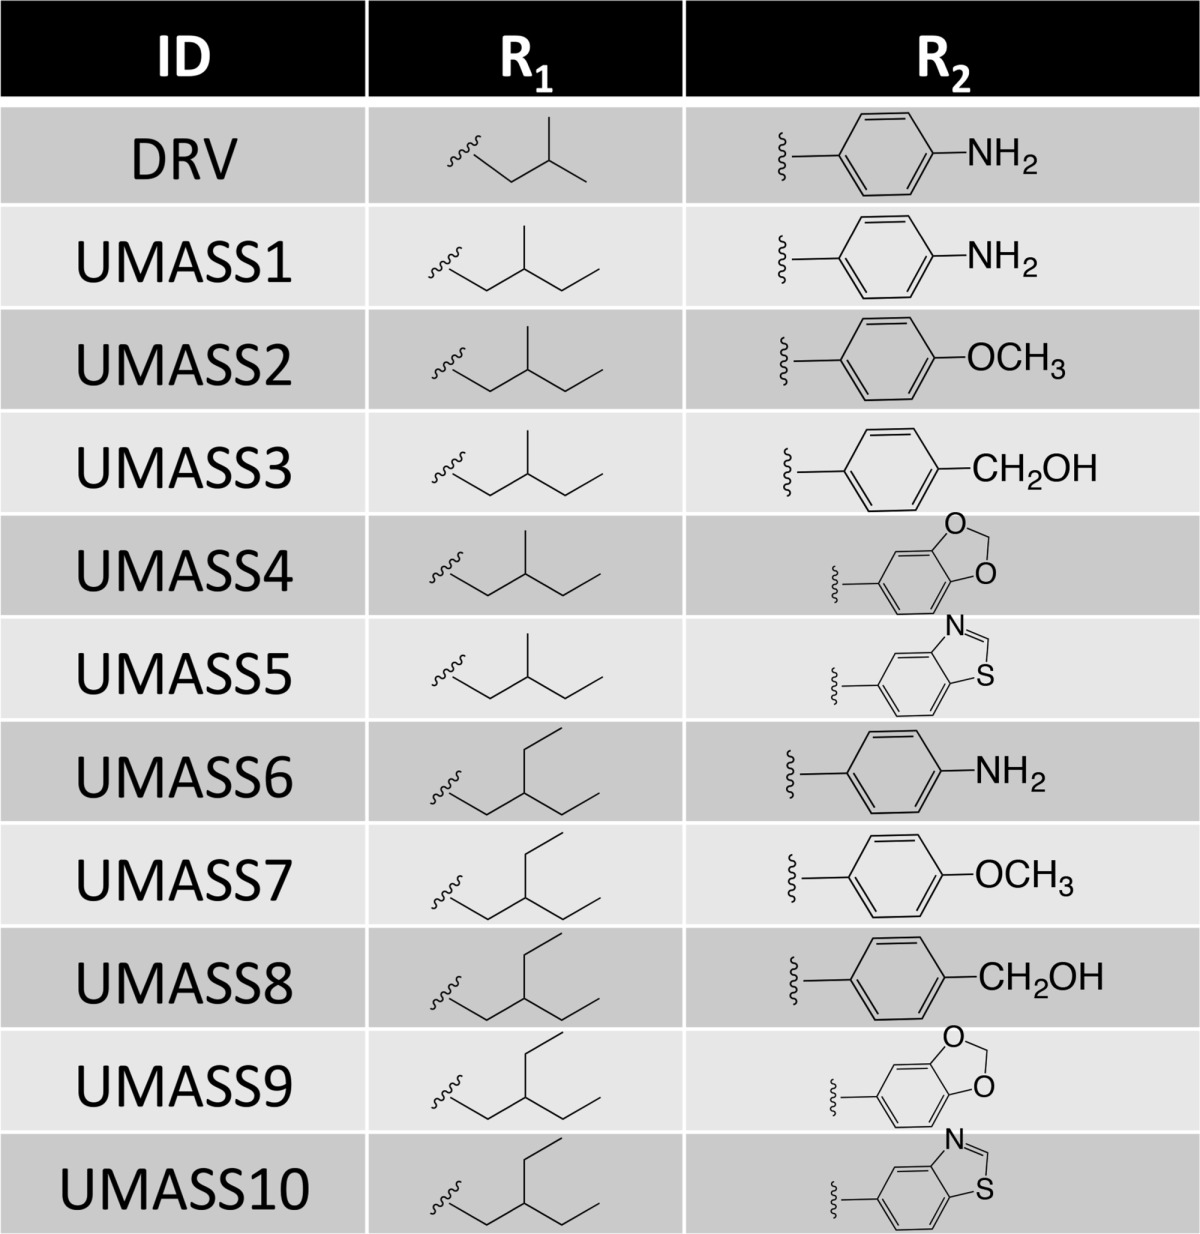
The two series, UMASS1–5 and UMASS6–10, have the same R1 group at the P1′ position, and 5 congeneric pairs within the series have the same R2 group at the P2′ position.
There are numerous examples where protease subsites exhibit an interdependence in substrate specificity, i.e. subsites cannot be decoupled but must be optimized in a concerted fashion.21−27 The interdependence of substrate specificity of subtilisin, a serine protease,22,24 has been previously analyzed. Contributions to kcat/Km from each subsite of subtilisin were not additive; amino acids in one site shield adverse effects of less favorable amino acids at other distal positions. In Factor VIIa, another serine protease, the subsites P3 and P4 were found to be coupled in terms of substrate specificity as nonhomologous amino acid classes were preferred in the P3 subsite depending on the amino acid present in the P4 subsite.23 In the protease elastase, the effects of contact complementary optimization in the P1 subsite were negated if the contacts in the P4 subsite were optimized independently.25−27 Each of these examples, as well as many others, focuses on modifying or optimizing substrate specificity or processing. While the interdependence of substrate specificity is well-known, these relationships do not necessarily translate to design and optimization of resistance-proof inhibitors. Little has been done to evaluate interdependence of subsites in inhibitor binding. One example in HIV-1 protease showed a compensatory effect between the P1–P2 and P1′–P2′ subsites in the evolution of resistance mutations against known PIs.28
In the current study, we aimed to determine if there is an interdependence between subsites of HIV-1 protease in inhibitor binding, using the focused library of DRV analogs where the functional groups at P1′ and P2′ positions are systematically altered (Table 1). The DRV analogs, along with the available high-resolution structural data, provided an ideal set for evaluation of subsite interdependence. Molecular Dynamics (MD) simulations starting from cocrystallized structures were performed to systemically analyze the atomic fluctuations, energetics, hydrophobic and electrostatic interactions, and water structure for HIV-1 protease bound to DRV and 10 DRV analogs and determine how different functional groups influence these properties. The inhibitor interactions at the P1′ position were found to influence the van der Waals (vdW) contacts in the P2′ position, as well as hydrogen bonding between the inhibitor and key structural features, namely the catalytic residue D25 and the highly conserved flap water. Thus, subsites in differential recognition of inhibitors within the active site of HIV-1 protease are highly coupled and interdependent.
Results
MD trajectories starting from high-resolution structures of HIV-1 protease cocrystallized with DRV and DRV analogs were generated and analyzed to reveal subsite interdependence and interactions between the inhibitor and protein. Each complex was simulated in triplicate for 100 ns each. Correlated fluctuations between the protein and inhibitor, vdW contact energies, electrostatic interactions, and water structure were evaluated and compared between DRV and the analogs to reveal subsite relationships.
Asymmetric Inhibitors Propagate Asymmetric Fluctuations Throughout the Enzyme
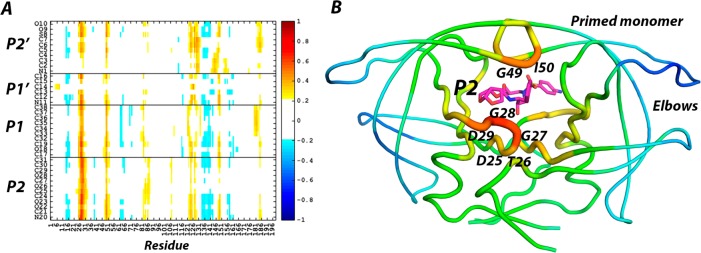
The asymmetry in B-factors between the monomers in the crystal structures of the inhibitor complexes indicated a link between the chemical moieties present in the substrate binding sites and the dynamics of the monomer (Figure S1 and analysis in the Supporting Information: Crystallographic B-factor comparison). To identify the regions of the homodimeric HIV-1 protease that fluctuate the most highly in concert with atomic fluctuations of the bound inhibitor cross-correlational analysis was used. Specific regions of the protease are highly correlated/anticorrelated with the atomic fluctuations of DRV (Figure 2) and DRV analogs (Figures S2 and S3). Residues D25, T26, G27, G28, D29, G49, and I50 of the protease were the most correlated with the fluctuations of the inhibitor, but the correlations of each monomer with the inhibitors were asymmetric. The nonprime monomer containing the P2 pocket was always more highly correlated with the inhibitor motions (Figure 2B, red and orange colors), while the elbow region in the prime monomer was the most anticorrelated with the inhibitor (Figure 2B, blue). Distance difference plots also showed differential results for the two monomers as a result of the asymmetry of the inhibitor, confirming the results obtained from analysis of the crystal structures (analysis in the Supporting Information: Distance difference matrices show asymmetric inhibitors impact homodimeric protease monomers differentially and Figures S4–S7). Thus, the effects of the asymmetric inhibitor are propagated in an asymmetric manner to distal protein residues.
Figure 2.
A) Pearson cross-correlations between DRV inhibitor atoms and C-alpha positions of HIV-1 protease residues. B) Average cross-correlation intensities by residue determined in panel A mapped onto the protease structure.
Alterations of P1′ Impact P2′ van der Waals Contacts but Not Vice Versa
The interdependency of subsites was investigated by evaluating how different functional groups at P1′ and P2′ positions of the inhibitor alter vdW contacts across subsites. By comparing DRV with UMASS1 and UMASS6, where the P1′ increases in size by one and then two methyl groups relative to DRV, respectively (Figure 3), the interdependency between S1′ and the other subsites was evaluated. As the P1′ moiety increased in size, vdW contacts at the S1′ subsite became more favorable as expected, but while no change was observed at the S1 or S2 subsites, the corresponding contacts at S2′ became less favorable due to loss of vdW contacts (Figure 3).
Figure 3.
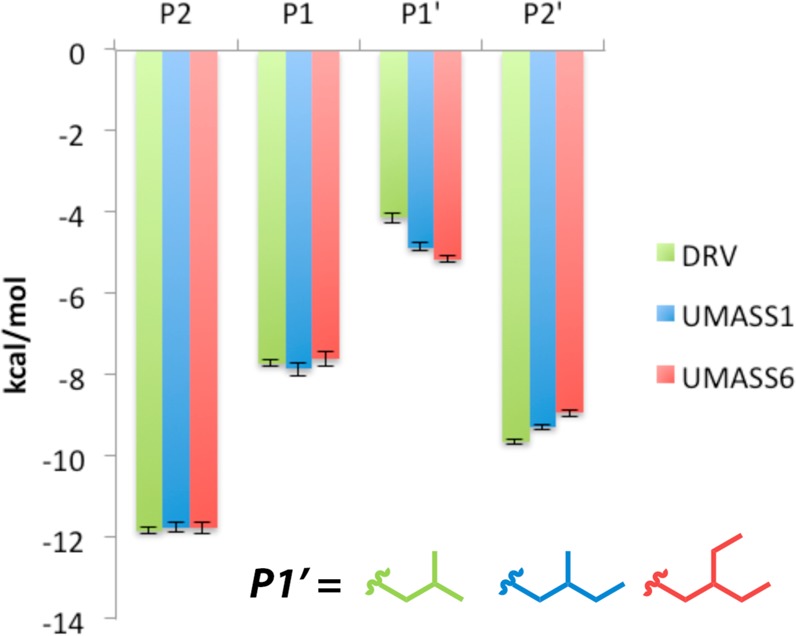
van der Waals contact energies for DRV, UMASS1, and UMASS6, with the same P2′ moiety but differing hydrophobic substitutions at P1′. Error bars indicate errors determined by block averaging over the concatenated three trajectories.
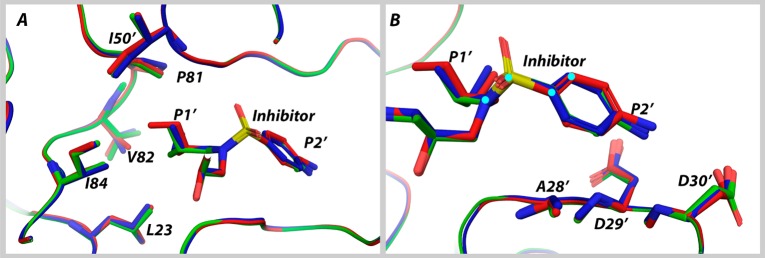
Specifically, with the addition of each carbon atom, extending the P1′ moiety, as more favorable contacts with L23, I84, V82, and I50′ were made (see Figure 4A) the vdW contacts decreased at P2′. These coupled changes occurred as the dihedral angle between the P1′ and P2′ moieties was altered, leading to less favorable contacts between the aniline group of the inhibitor and protease residues A28′, D29′, and D30′ (Figure 4B). This trend persisted when other congeneric pairs of DRV analogs with the same P2′ moiety were compared (Figure S8).
Figure 4.
Overlay of the HIV-1 protease structure in complex with DRV, UMASS1, and UMASS6. A) van der Waals contacts (L23, P81, V82, I84, and I50′) with the P1′ moiety increase, and B) the dihedral angle (cyan circles) between the P1′ and P2′ groups shifts with a hydrophobic extension of the P1′ moiety, changing the contacts between inhibitor and residues A28′, D29′, and D30′.
Upon binding, the conformational entropy of the inhibitor decreases as the inhibitor’s degrees of freedom are reduced. An additional penalty will be paid if the inhibitor’s bound state deviates from the low energy unbound state. MD simulations of the free (unbound) inhibitors were run to compare the P1′-P2′ torsion angle of DRV and DRV analogs in the bound and unbound states. The torsion angle for DRV was the same in both the bound and unbound states, while there was a 2 to 18 degree perturbation between the bound and unbound states for all other DRV analogs (Table 2). The hydrophobic extension of the P1′ moiety not only leads to less favorable vdW contact energy at the S2′ subsite but the torsion angle between the P1′ and P2′ moieties in the bound state deviates from the lowest energy state.
Table 2. Comparison of the Dihedral Angle of the P2′ Moiety in the Bound and Unbound States for DRV and DRV Analogs.
| P2′
torsion (degrees) |
|||
|---|---|---|---|
| compound | bound | unbound | Δ torsion |
| DRV | –85 | –85 | 0 |
| UMASS1 | –81 | –90 | 9 |
| UMASS2 | –85 | –74 | 11 |
| UMASS3 | –79 | –81 | 2 |
| UMASS4 | –84 | –92 | 8 |
| UMASS5 | –87 | –75 | 12 |
| UMASS6 | –75 | –93 | 18 |
| UMASS7 | –75 | –81 | 6 |
| UMASS8 | –68 | –81 | 13 |
| UMASS9 | –84 | –80 | 4 |
| UMASS10 | –84 | –69 | 15 |
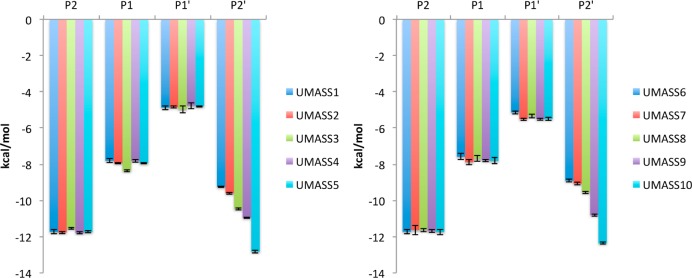
Next, the analogs within the two series, which have the same P1′ but a differing P2′ moiety, were compared. In the P1′ methyl-butyl (UMASS 1–5) and ethyl-butyl (UMASS 6–10) series, as the chemical diversity was introduced at the P2′ position there was no significant change in the vdW contacts between the protein and inhibitor P1, P2, or P1′ positions (Figure 5). Therefore, the observation that the P1′ moiety impacting the vdW contacts at the P2′ position is unidirectional, as the reverse is not true.
Figure 5.
van der Waals contact energies by subsite between DRV analogs and HIV-1 protease. Error bars are the errors determined by block averaging over the concatenated three trajectories.
Alterations in P1′ Also Impact Key Direct and Water Mediated Hydrogen Bonds
All intermolecular hydrogen bonds between DRV and HIV-1 protease were determined along with the percentage of the time the bond existed during the MD simulations (Figure S9). Direct protein-inhibitor hydrogen bonds were observed between DRV and residues D25, D29, D30, D25′, and D30′. Additionally, there were water-mediated hydrogen bonds with I50, I50′, and D29′. The hydrogen bonding patterns between protease and DRV were compared to other DRV analogs to analyze the effect of different chemical moieties in the S1′ and S2′ subsites.
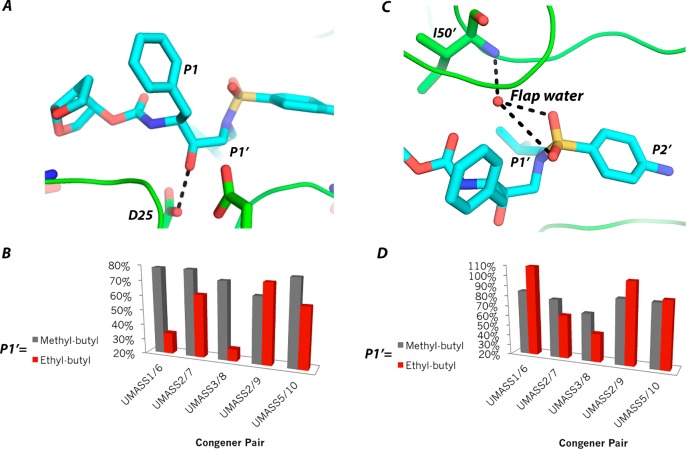
The two series with differing P1′ (UMASS1–5, UMASS 6–10) were compared to evaluate the impact of the hydrophobic extension of the P1′ moiety on the hydrogen bonding patterns and frequencies in each subsite (Table S1). No significant differences were observed in the hydrogen bonds of S2 or S1′ subsite with the P1′ extension. For all P2′ congeneric pairs, with the exception of DRV, UMASS1 and UMASS6, there was also no dependency between the S1′ and S2′ subsites (Expanded analysis in the Supporting Information: Interdependency of electrostatic interactions between the S1′ and S2′ subsites mediated by P2′ moiety). Specifically, the frequency of the transition state hydrogen bond between the protonated catalytic residue D25 and the oxygen occupying the P1 position of the inhibitor (Figure 6A) is more stable when a methyl-butyl moiety is in the P1′ position regardless of the P2′ moiety. The P1 hydrogen bond frequencies differed by 14% across the methyl-butyl series and by 39% across the ethyl-butyl series (Figure 6B). Thus, the P1′ extension introduced variability in the frequency of the P1 hydrogen bond, suggesting a dependency between the S1 and S1′ subsites. This P1–P1′ dependency indicates that a hydrophobic P1′ extension reduces the electrostatic interactions in the adjacent P1 subsite.
Figure 6.
A) The hydrogen bond between the inhibitor and D25. B) The change in the frequency of the hydrogen bond shown in panel A for each congeneric pair. C) Water mediated hydrogen bond between the inhibitor P2′ moiety and I50′. D) The change in frequency of the water mediated hydrogen bond shown in panel C for each congeneric pair. Frequencies are the sum of two flap water mediated hydrogen bonds with I50′ and the inhibitor.
Within each series (UMASS1–5, UMASS6–10) the impact of the P2′ position on other subsites was evaluated. The same hydrogen bonding patterns were observed for UMASS1 through UMASS5 and UMASS6 through UMASS10 within the S2, S1, and S1′ subsites but not the S2′. The P2′ capping group influenced the hydrogen bonding patterns and frequencies between the P2′ moiety and the S2′ subsite residues. Namely, the P2′ hydroxyl capping group of UMASS3 and UMASS8 interacted differently with D29′ and D30′ compared to other DRV analogs, forming three hydrogen bonds. The heteroatoms of the fused ring system of UMASS4, UMASS5, UMASS9, and UMASS10 formed only one hydrogen bond in the S2′ subsite, while UMASS2 and UMASS7, with a terminal methoxy, formed that same hydrogen bond but at a much lower frequency (19% and 14%, respectively). While the chemical functionality of the P2′ moiety greatly influenced the hydrogen bonding pattern within the S2′ subsite itself, there was little effect on other subsites.
Water-mediated hydrogen bond patterns and frequencies between the inhibitors and the protease were also examined. Inhibitors with a polar heteroatom in the para position at the P2′ position (DRV, UMASS1, UMASS3, UMASS6, and UMASS8) formed a hydrogen bond with D29′. This water mediated D29′ hydrogen bond is within the S2′ subsite and not unexpected since the P2′ moiety of these inhibitors is capable of hydrogen bonding. As expected, the tetra-coordinated flap water was observed for DRV (Figure S4) and all DRV analogs with high frequency (Table S2). This flap water is known to play a critical role in molecular recognition by HIV-1 protease. While the flap water mediated hydrogen bonding patterns were similar in the S1 and S1′ subsites across all UMASS analogs, the frequency of the hydrogen bond with I50′ (Figure 6C) was more variable within the ethyl-butyl series than the methyl-butyl series: 61% versus 17% change, respectively (Figure 6D). The variability in the hydrogen bonding frequency of the flap water suggests a dependency between the P2′ moiety and the water mediated hydrogen bond of the P1′ moiety with I50′.
To summarize, the evaluation of intermolecular hydrogen bonding interactions shows an interdependency between the P1′ position and hydrogen bonds in the S1 subsite. Specifically, extending the P1′ moiety led to a reduction in the frequency of hydrogen bonding with the catalytic D25. Further, flap water mediated hydrogen bonding was impacted by introducing chemical diversity in the S2′ subsite, depending on the P1′ moiety. Thus, key protease−inhibitor interactions are intimately linked to the chemical moiety in the S1′ subsite.
The P1′ Moiety Impacts the Surrounding Water Structure
Water structure is often ignored when evaluating molecular recognition and binding events. The congeners DRV, UMASS1, and UMASS6 provide an opportunity to investigate the impact of increasing hydrophobicity at the P1′ position on the structured water molecules around the protein-inhibitor complex. To elucidate the changes in the solvent surrounding the active site in response to variations in the P1′ moiety, the explicit water in the MD simulations for DRV, UMASS1, and UMASS6 was compared. The crystal structures of HIV-1 protease in complex with these three inhibitors were previously determined to 1.2, 1.95, and 1.5 Å resolution, respectively,13 and showed significant variability in water content, rendering the analysis of the crystallographic waters unfeasible. The location and mobility of water molecules were evaluated in terms of occupancy and conservation of water sites during the simulations, and alterations in water sites were examined across the three inhibitors. While the number of water molecules in the proximity of the HIV-1 protease active site varied significantly across inhibitors, water sites with high occupancy were conserved in the crystal structures (Figure S10).
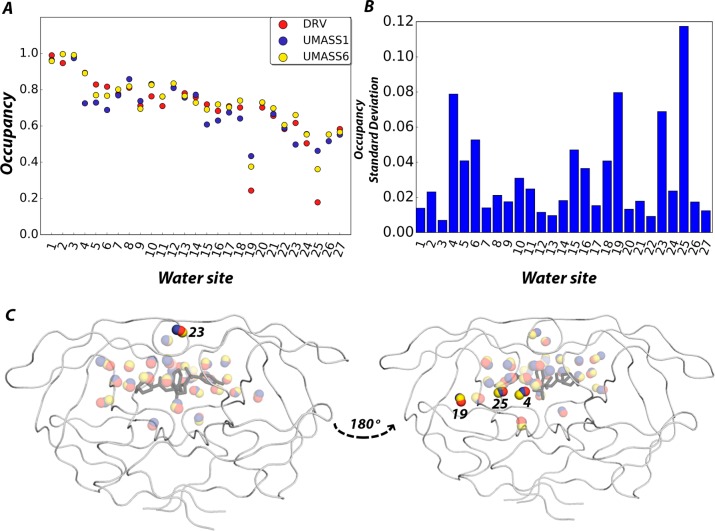
All water sites within 6 Å of the inhibitor were determined. A water site was defined as having at least twice the density of bulk water for the duration of the MD trajectories (see Materials and Methods for further details). For DRV, UMASS1, and UMASS6, 31, 33, and 32 water sites were identified, respectively. Twenty-seven sites were conserved between at least two of the inhibitor complexes. On average, all conserved water sites were occupied at least 50% of the time (Figure 7A). Water sites 4, 19, 23, and 25 had the highest variability in occupancy (Figure 7B); two of these water sites are within the active site, and two are adjacent to the active site (Figure 7C). For the congeners DRV, UMASS1, and UMASS6, 10 unique water sites were found (i.e., no equivalent was found in any other simulation). As observed with the conserved water sites, these unique sites were located both proximal and distal to the active site. This result suggests that not only do the changes in the P1′ position impact water sites directly contacting the active site but also the effect propagates to distal sites as well. Thus, the P1′ extension impacted the occupancy of the water sites both within and distal to the active site.
Figure 7.
A) The occupancy of the 27 conserved water sites as determined over a 300 ns MD simulation of HIV-1 protease bound to DRV, UMASS1, and UMASS6. B) The standard deviation in occupancy of each water site shown in panel A. Sites 4, 19, 23, and 25 (ordered by highest occupancy) have the largest deviation in occupancy for the series DRV, UMASS1, and UMASS6, suggesting that these water sites are influenced by the P1′ moiety. C) Water sites with the largest standard deviations are either in direct contact with the ligand (sites 4 and 25) or at distal sites (sites 19 and 23). The DRV-bound HIV-1 protease structure (PDB ID: 1T3R) is displayed to orient the reader to the relative location of conserved water sites.
Discussion
While subsite couplings in substrate specificity have been well documented for various proteases, an understanding of how these interdependencies may translate to inhibitor binding has been lacking. Many active site couplings are not revealed from static structures. Because protein flexibility and conformational change are critical to understanding the binding mechanism of HIV-1 protease, MD simulations of a focused library of DRV and analogs bound to protease were performed and systematically analyzed to reveal the effect of P1′ and P2′ groups on the interactions of moieties in the other subsites. Two major findings from these analyses are that (1) the P1′ moiety at the S1′ subsite has extensive effects on other subsites and (2) asymmetry of the inhibitor impacts each monomer differently.
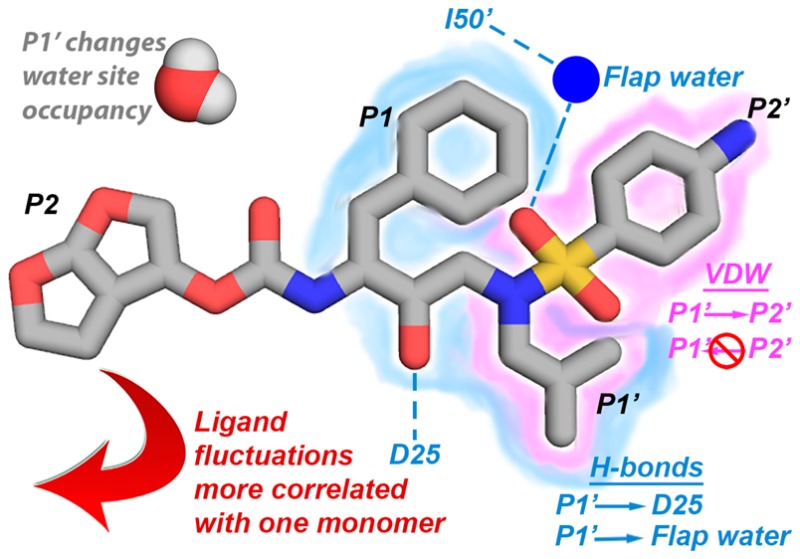
The S1′ subsite plays a central role, propagating changes to other subsites (Figure 8). An increase in hydrophobic contacts of the P1′ moiety decreased contacts in the S2′ subsite, but the dependency was unidirectional. The P1′ moiety also impacted the frequency of the hydrogen bond between the inhibitor and catalytic residue D25, the hydrogen bonds mediated by the conserved flap water, and the occupancy of water sites both proximal and distal to the active site. The DRV analogs in the focused library used were originally designed to increase the vdW contacts at the S1′ site by extending the P1′ group and optimally filling the substrate envelope. However, coupling between S1′ and S2′ subsites and a reciprocal decrease of interactions at the S2′ substite indicate these moieties should be optimized simultaneously, in context with each other.
Figure 8.
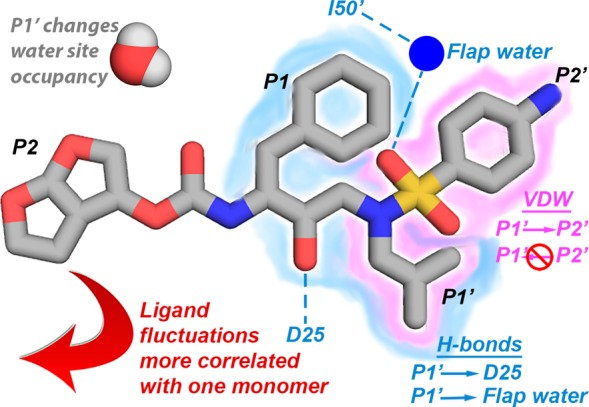
Interdependencies between subsites mapped onto the DRV structure.
The asymmetry of the inhibitors was propagated to alter dynamics throughout the protease, differentially impacting the two protease monomers. The most highly concerted atomic fluctuations between the inhibitors and protease were always in the 30s and 50s loops of the nonprime monomer, which interacts more strongly with the inhibitor compared to the prime monomer. Several of our own previous studies have also shown that asymmetric inhibitors differentially affect the two monomers and disrupt the symmetry of the HIV-1 protease and the resistance mutations that are present in both monomers.29 MD simulations of wild-type and a drug resistant variant of HIV-1 protease bound to DRV revealed one side of the active site widening while the other side constricting. A common mechanism of drug resistance for HIV-1 protease may be through altered protein dynamics, shifting the ensemble and altering the flexibility of the enzyme.30,31 In addition, mutations distal from the active site were found to asymmetrically disrupt the hydrogen-bonding network, which propagated changes through the two monomers differently to the active site.
The findings in this work are consistent with previous studies that found structural couplings between the P1–P2 and P1′–P2′ subsites28 when optimizing amino acids at these positions for peptide-based inhibitor design. The current work extended the analysis to the whole inhibitor-protease-solvent system, as well as determining the underlying molecular mechanisms, and intermolecular interactions and energetics behind subsite couplings. Since previous studies revealed that altering the P1′ and P2′ moieties could improve inhibitor properties,19 the focus was on the corresponding subsites. Future studies could include systematic evaluation of other subsites, different inhibitor pharmacophores, and extend to drug resistant variants to understand how/if subsite interdependency is altered.
The ability to design robust and potent therapeutics is limited by our understanding of mechanisms of inhibition. While subsite interdependency has been investigated by means of substrate optimization, little had been done on inhibitor binding. Elucidation of the couplings between the subsites of HIV-1 protease in binding of inhibitors not only will aid in future drug design but also will provide a proof of concept for application to other therapeutic targets. We have shown that the HIV-1 protease active site is comprised of many highly interdependent relationships that cannot be further deconstructed. These relationships can be used to guide the design of new inhibitors and provide a template to elucidate subsite interdependencies for other important therapeutic targets.
Materials and Methods
Protein Structure Preparation
Crystallographic structures of DRV and DRV analogs bound to HIV-1 protease were previously determined (PDB ID: 1T3R, 3O99, 3O9A, 3O9B, 3O9C, 3O9D, 3O9E, 3O9F, 3O9G, 3O9H, 3O9I).13 All structures were prepared for simulation using the Protein Preparation Wizard from Schrödinger;32,33 hydrogen atoms were added, multiple residue conformations were resolved, protonation states were determined, and any structural violations were resolved. All crystallographic waters were maintained, but crystallization buffers and salts were removed. The hydrogen bond network was optimized by exhaustive sampling of water orientations and flipping the side chain orientation of Asn, Gln, His, and terminal hydroxyl and thiol hydrogen as appropriate. The structures were minimized with heavy atoms restraints until an RMSD of 0.3 Å was achieved using the OPLS2005 force field (which was also used to parametrize the inhibitors).34−36
Molecular Dynamics Simulations
All MD simulations of the HIV-1 protease bound complex and free inhibitor were performed using Desmond36−39 as implemented by Schrödinger using the OPLS2005 force field. Systems were prepared by solvating the structure in a cubic box that extended at least 10 Å beyond the nearest solute atom in all directions using the TIP3 solvation model.40 Sodium chloride was added to the equivalent of 150 mM to simulate physiological conditions. The system was neutralized by adding counterions as needed (Na+ or Cl–).
A rigorous pre-equilibration model was employed as described elsewhere.41 Briefly, a series of restrained minimization were performed to gradually relax the system. Initially all heavy solute atoms were restrained with a force constant of 1000 kcal mol–1 Å–2 for 10 steps with steepest descent followed by up to 2000 steps using the LBFG method to a convergence of 50 kcal mol–1 Å–2. Restraints were removed from side chains using LBFG for 5000 steps or until a convergence of 50 kcal mol–1 Å–2. The restraints on the backbone were gradually removed in procession using the following force constants 1000, 500, 250, 100, 50, 10, 1, and 0 kcal mol–1 Å–2 using the LBFG method to a convergence of 50 kcal mol–1 Å–2.
A series of short preproduction MD simulations were performed to equilibrate the system. A 10 ps NVT ensemble with restraints on solute heavy atoms of 50 kcal mol–1 Å–2 using a Berendsen thermostat at 10 K was performed. A 1 fs time step for bonded and short-range interaction up to 9 Å and a 3 fs time step for long-range electrostatic interactions were employed. A 10 ps MD simulation using an NPT ensemble with a Berendsen thermostat followed, run at 10 K with a 2 ps window for bonded and short-range interactions and 6 fs for long-range electrostatics. Over 50 ps, the temperature of the system was increased to 300 K with restraints on heavy solute atoms followed by a 10 ps simulation where all harmonic restraints were removed. Production simulations were performed using an NPT ensemble with a Nose-Hover thermostat and a Martyna-Tuckerman-Klein (MTK) barostat. Simulations were carried out with no harmonic restraints for 100 ns at 300 K and 1 bar. The cutoff for nonbonded interactions was 9 Å using Particle Mesh Ewald (PME) methodology. All simulations were performed in triplicate to check for reproducibility and ensure sufficient sampling, each with a different initial velocity for a total production time of 300 ns.
van der Waals Contact Analysis
The intermolecular van der Waals contact potential for each protease-inhibitor complex was calculated using a modified Lennard-Jones potential, V(rij), equivalent to 4ε[(σ/rij)12 – (σ/rij)6] where r is the distance between atom pairs i of the protease and j of the inhibitor. The values of ε and σ are the depth of the energy well and the diameter of atoms when treated as a hard sphere. All protease-inhibitor nonbonded pairs within 6 Å were included. When the distance was less than ε the potential was set to ε.42 The error associated with van der Waals energies was determined using block averaging over a total of 300 ns of concatenated trajectories.
Hydrogen Bonding Analysis
Identification and frequency of hydrogen bonds between protease and inhibitor (direct and water mediated) were determined using an in-house script built off of the Schrödinger API.43 A hydrogen bond was determined to be present if the distance between the hydrogen and acceptor atoms was less than 2.5 Å. Additionally the following geometric restraints were required: 1) the angle between the donor-hydrogen-acceptor atoms had to be at least 120 degrees and 2) the angle between the hydrogen, acceptor, and atom bonded to the acceptor atom had to be at least 90 degrees. These criteria were applied to each frame of the trajectories to determine the frequency of the hydrogen bond. Where multiple hydrogen bonds were observed with a protein residue, such as with D25′, D29′, I50′, D30, and I50, the frequencies were added up and treated as a single electrostatic interaction.
Water Site Analysis
The spatially resolved water density from MD trajectories was calculated using an in-house Python script using a grid based approach, similar to one previously described.44 Modules from the Schrödinger python API were utilized for trajectory handling and structural alignment. Each frame of the MD trajectory was fitted on a common reference frame. Thereafter the coordinates of the water oxygen atoms within 6 Å of the protein were mapped on a three-dimensional rectangular grid. The distance between the adjacent grid points was set to 0.5 Å. The grid spacing represents a compromise between maintaining good spatial resolution and a relatively low statistical error.
Following grid generation, local maxima in the discretized density distribution were identified. As an initial filter, only grid points with an average density of at least twice that of bulk water (0.066 Å–3) were considered. A grid point qualified as a water site if its density exceeded both this initial cutoff value and the density of all adjacent grid points. Finally, if two or more local maxima were located within 1.5 Å of each other, these grid points were considered to contribute to the same water site, and the coordinates of the water site were calculated based on the density weighted values of all contributing maxima.
The water-site occupancy was determined by comparing its coordinates with the coordinates of the water oxygen atoms in the prealigned trajectory. If the oxygen atom of a TIP3P water-molecule was located within 1.5 Å of the water-site, the molecule was considered to occupy the water site. If at any point during the course of the simulation more than one water-molecule was located within 1.5 Å, the water site was still considered to be occupied by only one water-molecule. For all subsequent calculations the water-molecule closer to the site was considered to be the ”occupying” water.
Cross-Correlations
Atomic positional fluctuations were determined for each simulation, and cross correlations between atom pairs were calculated using
where ΔRi is the change in the position of site i, and ΔRi is the change in the position in site j. The range of the correlation varies from minus one to one, minus one meaning the atom pair is completely anticorrelated, one meaning a complete correlation, and zero meaning that there is no correlation. Results were generated and plotted using in-house FORTRAN scripts and MatLab.
Acknowledgments
We would like to thank Dmitry Lupyan, Associate Principal Scientist, Schrödinger, for custom script development used in MD analysis; Troy Whitfield, Research Assistant Professor, University of Massachusetts, Medical School for discussion and insight regarding MD analysis; and Kristina Prachanronarong, M.D./Ph.D. graduate student, University of Massachusetts Medical School, for assistance with script development for cross-correlation analysis.
Supporting Information Available
The Supporting Information is available free of charge on the ACS Publications website at DOI: 10.1021/acs.jctc.6b01262.
Comparison of crystallographic B-factors (Figure S1 and description); cross-correlations in atomic fluctuations of inhibitors and HIV-1 protease (Figures S2 and S3); additional results and details of Materials and Methods for distance difference matrices; distance difference plots comparing DRV versus UMASS analog-bound protease structures (Figures S4, S5, S6) and UMASS congeneric pairs (Figure S7); intermolecular vdW contact energies by subsite (Figure S8); additional results on interdependency of S1′ and S2′ subsites mediated by the P2′ moiety; hydrogen bonds between DRV and protease active site depicted on the crystal structure (Figure S9); the frequencies of direct (Table S1) and water-mediated (Table S2) hydrogen bonds between inhibitors and the HIV-1 protease active site; comparison of high-occupancy water sites with crystallographic water molecules (Figure S10) (PDF)
This research was supported by NIH P01 GM109767.
The authors declare no competing financial interest.
Dedication
This work is dedicated in memory of Dr. Amy C. Anderson, Professor, University of Connecticut, an inspirational mentor and dear friend.
Supplementary Material
References
- Bartlett J. A.; DeMasi R.; Quinn J.; Moxham C.; Rousseau F. Overview of the effectiveness of triple combination therapy in antiretroviral-naive HIV-1 infected adults. AIDS 2001, 15, 1369–1377. 10.1097/00002030-200107270-00006. [DOI] [PubMed] [Google Scholar]
- Collier A. C.; Kalish L. A.; Busch M. P.; Gernsheimer T.; Assmann S. F.; Lane T. A.; Asmuth D. M.; Lederman M. M.; Murphy E. L.; Kumar P.; Kelley M.; Flanigan T. P.; McMahon D. K.; Sacks H. S.; Kennedy M. S.; Holland P. V.; Leukocyte-reduced red blood cell transfusions in patients with anemia and human immunodeficiency virus infection: the Viral Activation Transfusion Study: a randomized controlled trial. JAMA, J. Am. Med. Assoc. 2001, 285, 1592–1601. 10.1001/jama.285.12.1592. [DOI] [PubMed] [Google Scholar]
- Gulick R. M.; Mellors J. W.; Havlir D.; Eron J. J.; Meibohm A.; Condra J. H.; Valentine F. T.; McMahon D.; Gonzalez C.; Jonas L.; Emini E. A.; Chodakewitz J. A.; Isaacs R.; Richman D. D. 3-year suppression of HIV viremia with indinavir, zidovudine, and lamivudine. Ann. Intern. Med. 2000, 133, 35–39. 10.7326/0003-4819-133-1-200007040-00007. [DOI] [PubMed] [Google Scholar]
- Sepkowitz K. A. AIDS--the first 20 years. N. Engl. J. Med. 2001, 344, 1764–1772. 10.1056/NEJM200106073442306. [DOI] [PubMed] [Google Scholar]
- Yeni P. G.; Hammer S. M.; Carpenter C. C.; Cooper D. A.; Fischl M. A.; Gatell J. M.; Gazzard B. G.; Hirsch M. S.; Jacobsen D. M.; Katzenstein D. A.; Montaner J. S.; Richman D. D.; Saag M. S.; Schechter M.; Schooley R. T.; Thompson M. A.; Vella S.; Volberding P. A. Antiretroviral treatment for adult HIV infection in 2002: updated recommendations of the International AIDS Society-USA Panel. JAMA, J. Am. Med. Assoc. 2002, 288, 222–235. 10.1001/jama.288.2.222. [DOI] [PubMed] [Google Scholar]
- Mager P. P. The active site of HIV-1 protease. Med. Res. Rev. 2001, 21, 348–353. 10.1002/med.1012. [DOI] [PubMed] [Google Scholar]
- Ali A.; Reddy G. S.; Cao H.; Anjum S. G.; Nalam M. N.; Schiffer C. A.; Rana T. M. Discovery of HIV-1 protease inhibitors with picomolar affinities incorporating N-aryl-oxazolidinone-5-carboxamides as novel P2 ligands. J. Med. Chem. 2006, 49, 7342–7356. 10.1021/jm060666p. [DOI] [PubMed] [Google Scholar]
- Ali A.; Reddy G. S.; Nalam M. N.; Anjum S. G.; Cao H.; Schiffer C. A.; Rana T. M. Structure-based design, synthesis, and structure-activity relationship studies of HIV-1 protease inhibitors incorporating phenyloxazolidinones. J. Med. Chem. 2010, 53, 7699–7708. 10.1021/jm1008743. [DOI] [PMC free article] [PubMed] [Google Scholar]
- Altman M. D.; Ali A.; Reddy G. S. K. K.; Nalam M. N. L.; Anjum S. G.; Cao H.; Chellapan S.; Kairys V.; Fernandes M. X.; Gilson M. K.; Schiffer C. A. HIV-1 Protease Inhibitors from Inverse Design in the Substrate Envelope Exhibit Subnanomolar Binding to Drug-Resistant Variants. J. Am. Chem. Soc. 2008, 130, 6099–6113. 10.1021/ja076558p. [DOI] [PMC free article] [PubMed] [Google Scholar]
- Chellappan S.; Kairys V.; Fernandes M. X.; Schiffer C. A.; Gilson M. K. Evaluation of the Substrate Envelope Hypothesis for inhibitors of HIV-1 Protease. Proteins: Struct., Funct., Genet. 2007, 68, 561–567. 10.1002/prot.21431. [DOI] [PubMed] [Google Scholar]
- Chellappan S.; Kumar K.; Reddy G. S.; Ali A.; Nalam M. N.; Anjum S. G.; Cao H.; Kairys V.; Fernandes M. X.; Altman M. D.; Tidor B.; Rana T. M.; Schiffer C. A.; Gilson M. K. Design of mutation-resistant HIV protease inhibitors with the substrate envelope hypothesis. Chem. Biol. Drug Des. 2007, 69, 298–313. 10.1111/j.1747-0285.2007.00514.x. [DOI] [PubMed] [Google Scholar]
- Nalam M. N.; Ali A.; Altman M. D.; Reddy G. S.; Chellappan S.; Kairys V.; Ozen A.; Cao H.; Gilson M. K.; Tidor B.; Rana T. M.; Schiffer C. A. Evaluating the substrate-envelope hypothesis: structural analysis of novel HIV-1 protease inhibitors designed to be robust against drug resistance. Journal of virology 2010, 84, 5368–5378. 10.1128/JVI.02531-09. [DOI] [PMC free article] [PubMed] [Google Scholar]
- Nalam M. N.; Ali A.; Reddy G. S.; Cao H.; Anjum S. G.; Altman M. D.; Yilmaz N. K.; Tidor B.; Rana T. M.; Schiffer C. A. Substrate envelope-designed potent HIV-1 protease inhibitors to avoid drug resistance. Chem. Biol. 2013, 20, 1116–1124. 10.1016/j.chembiol.2013.07.014. [DOI] [PMC free article] [PubMed] [Google Scholar]
- Nalam M. N.; Schiffer C. A. New approaches to HIV protease inhibitor drug design II: testing the substrate envelope hypothesis to avoid drug resistance and discover robust inhibitors. Curr. Opin. HIV AIDS 2008, 3, 642–646. 10.1097/COH.0b013e3283136cee. [DOI] [PMC free article] [PubMed] [Google Scholar]
- King N. M.; Prabu-Jeyabalan M.; Nalivaika E. A.; Schiffer C. A. Combating susceptibility to drug resistance: lessons from HIV-1 protease. Chem. Biol. 2004, 11, 1333–1338. 10.1016/j.chembiol.2004.08.010. [DOI] [PubMed] [Google Scholar]
- Romano K. P.; Ali A.; Aydin C.; Soumana D.; Ozen A.; Deveau L. M.; Silver C.; Cao H.; Newton A.; Petropoulos C. J.; Huang W.; Schiffer C. A. The molecular basis of drug resistance against hepatitis C virus NS3/4A protease inhibitors. PLoS Pathog. 2012, 8, e1002832. 10.1371/journal.ppat.1002832. [DOI] [PMC free article] [PubMed] [Google Scholar]
- Romano K. P.; Ali A.; Royer W. E.; Schiffer C. A. Drug resistance against HCV NS3/4A inhibitors is defined by the balance of substrate recognition versus inhibitor binding. Proc. Natl. Acad. Sci. U. S. A. 2010, 107, 20986–20991. 10.1073/pnas.1006370107. [DOI] [PMC free article] [PubMed] [Google Scholar]
- Prabu-Jeyabalan M.; Nalivaika E. A.; Schiffer C. A. Substrate shape determines specificity of recognition for HIV-1 Protease: analysis of crystal structures of six substrate complexes. Structure 2002, 10, 369–381. 10.1016/S0969-2126(02)00720-7. [DOI] [PubMed] [Google Scholar]
- Cai Y.; Schiffer C. Decomposing the energetic impact of drug-resistant mutations: the example of HIV-1 protease-DRV binding. Methods Mol. Biol. 2012, 819, 551–560. 10.1007/978-1-61779-465-0_32. [DOI] [PMC free article] [PubMed] [Google Scholar]
- Cai Y.; Schiffer C. A. Decomposing the energetic impact of drug resistant mutations in HIV-1 Protease on binding DRV. J. Chem. Theory Comput. 2010, 6, 1358–1368. 10.1021/ct9004678. [DOI] [PMC free article] [PubMed] [Google Scholar]
- Chaudhury S.; Gray J. J. Identification of structural mechanisms of HIV-1 protease specificity using computational peptide docking: implications for drug resistance. Structure 2009, 17, 1636–1648. 10.1016/j.str.2009.10.008. [DOI] [PMC free article] [PubMed] [Google Scholar]
- Gron H.; Breddam K. Interdependency of the binding subsites in subtilisin. Biochemistry 1992, 31, 8967–8971. 10.1021/bi00152a037. [DOI] [PubMed] [Google Scholar]
- Larsen K. S.; Ostergaard H.; Bjelke J. R.; Olsen O. H.; Rasmussen H. B.; Christensen L.; Kragelund B. B.; Stennicke H. R. Engineering the substrate and inhibitor specificities of human coagulation Factor VIIa. Biochem. J. 2007, 405, 429–438. 10.1042/BJ20061901. [DOI] [PMC free article] [PubMed] [Google Scholar]
- Perona J. J.; Craik C. S. Structural basis of substrate specificity in the serine proteases. Protein Sci. 1995, 4, 337–360. 10.1002/pro.5560040301. [DOI] [PMC free article] [PubMed] [Google Scholar]
- Thompson R. C. Binding of peptides to elastase: implications for the mechanism of substrate hydrolysis. Biochemistry 1974, 13, 5495–5501. 10.1021/bi00724a007. [DOI] [PubMed] [Google Scholar]
- Thompson R. C.; Blout E. R. Elastase-catalyzed amide hydrolysis of tri- and tetrapeptide amides. Biochemistry 1973, 12, 66–71. 10.1021/bi00725a012. [DOI] [PubMed] [Google Scholar]
- Thompson R. C.; Blout E. R. Dependence of the kinetic parameters for elastase-catalyzed amide hydrolysis on the length of peptide substrates. Biochemistry 1973, 12, 57–65. 10.1021/bi00725a011. [DOI] [PubMed] [Google Scholar]
- Stoffler D.; Sanner M. F.; Morris G. M.; Olson A. J.; Goodsell D. S. Evolutionary analysis of HIV-1 protease inhibitors: Methods for design of inhibitors that evade resistance. Proteins: Struct., Funct., Genet. 2002, 48, 63–74. 10.1002/prot.10130. [DOI] [PubMed] [Google Scholar]
- Ragland D. A.; Nalivaika E. A.; Nalam M. N.; Prachanronarong K. L.; Cao H.; Bandaranayake R. M.; Cai Y.; Kurt-Yilmaz N.; Schiffer C. A. Drug resistance conferred by mutations outside the active site through alterations in the dynamic and structural ensemble of HIV-1 protease. J. Am. Chem. Soc. 2014, 136, 11956–11963. 10.1021/ja504096m. [DOI] [PMC free article] [PubMed] [Google Scholar]
- Cai Y.; Myint W.; Paulsen J. L.; Schiffer C. A.; Ishima R.; KurtYilmaz N. Drug Resistance Mutations Alter Dynamics of Inhibitor-Bound HIV-1 Protease. J. Chem. Theory Comput. 2014, 10, 3438–3448. 10.1021/ct4010454. [DOI] [PMC free article] [PubMed] [Google Scholar]
- Cai Y.; Yilmaz N. K.; Myint W.; Ishima R.; Schiffer C. A. Differential Flap Dynamics in Wild-type and a Drug Resistant Variant of HIV-1 Protease Revealed by Molecular Dynamics and NMR Relaxation. J. Chem. Theory Comput. 2012, 8, 3452–3462. 10.1021/ct300076y. [DOI] [PMC free article] [PubMed] [Google Scholar]
- Schrödinger Release 2015-4. Protein Preparation Wizard; Schrödinger: LLC, New York, NY, 2015.
- Sastry G. M.; Adzhigirey M.; Day T.; Annabhimoju R.; Sherman W. Protein and ligand preparation: parameters, protocols, and influence on virtual screening enrichments. J. Comput.-Aided Mol. Des. 2013, 27, 221–234. 10.1007/s10822-013-9644-8. [DOI] [PubMed] [Google Scholar]
- Jorgensen W. L.; Maxwell D. S.; Tirado-Rives J. Development and Testing of the OPLS All-Atom Force Field on Conformational Energetics and Properties of Organic Liquids. J. Am. Chem. Soc. 1996, 118, 11225–11236. 10.1021/ja9621760. [DOI] [Google Scholar]
- Jorgensen W. L.; Tirado-Rives J. The OPLS [optimized potentials for liquid simulations] potential functions for proteins, energy minimizations for crystals of cyclic peptides and crambin. J. Am. Chem. Soc. 1988, 110, 1657–1666. 10.1021/ja00214a001. [DOI] [PubMed] [Google Scholar]
- Shivakumar D.; Williams J.; Wu Y.; Damm W.; Shelley J.; Sherman W. Prediction of Absolute Solvation Free Energies using Molecular Dynamics Free Energy Perturbation and the OPLS Force Field. J. Chem. Theory Comput. 2010, 6, 1509–1519. 10.1021/ct900587b. [DOI] [PubMed] [Google Scholar]
- Schrödinger Release 2015-4. Desmond Molecular Dynamics System, D. E. Shaw Research, Maestro-Desmond Interoperability Tools; Schrödinger: New York, NY, 2015.
- Bowers K. J.; Chow E.; Xu H.; Dror R. O.; Eastwood M. P.; Gregersen B. A.; Klepeis J. L.; Kolossvary I.; Moraes M. A.; Sacerdoti F. D.; Salmon J. K.; Shan Y.; Shaw D. E.. Scalable algorithms for molecular dynamics simulations on commodity clusters, In Proceedings of the 2006 ACM/IEEE Conference on Supercomputing, ACM; Tampa, FL, 2006; p 84. [Google Scholar]
- Guo Z.; Mohanty U.; Noehre J.; Sawyer T. K.; Sherman W.; Krilov G. Probing the alpha-helical structural stability of stapled p53 peptides: molecular dynamics simulations and analysis. Chem. Biol. Drug Des. 2010, 75, 348–359. 10.1111/j.1747-0285.2010.00951.x. [DOI] [PubMed] [Google Scholar]
- Jorgensen W. L.; Chandrasekhar J.; Madura J. D.; Impey R. W.; Klein M. L. Comparison of simple potential functions for simulating liquid water. J. Chem. Phys. 1983, 79, 926–935. 10.1063/1.445869. [DOI] [Google Scholar]
- Ozen A.; Sherman W.; Schiffer C. A. Improving the Resistance Profile of Hepatitis C NS3/4A Inhibitors: Dynamic Substrate Envelope Guided Design. J. Chem. Theory Comput. 2013, 9, 5693–5705. 10.1021/ct400603p. [DOI] [PMC free article] [PubMed] [Google Scholar]
- Ozen A.; Haliloglu T.; Schiffer C. A. HIV-1 Protease and Substrate Coevolution Validates the Substrate Envelope As the Substrate Recognition Pattern. J. Chem. Theory Comput. 2012, 8, 703–714. 10.1021/ct200668a. [DOI] [PMC free article] [PubMed] [Google Scholar]
- Schrödinger Release 2015-4. Maestro; Schrödinger, LLC: New York, NY, 2015.
- Schiffer C.; Hermans J. Promise of advances in simulation methods for protein crystallography: implicit solvent models, time-averaging refinement, and quantum mechanical modeling. Methods Enzymol. 2003, 374, 412–461. 10.1016/S0076-6879(03)74019-1. [DOI] [PubMed] [Google Scholar]
Associated Data
This section collects any data citations, data availability statements, or supplementary materials included in this article.


