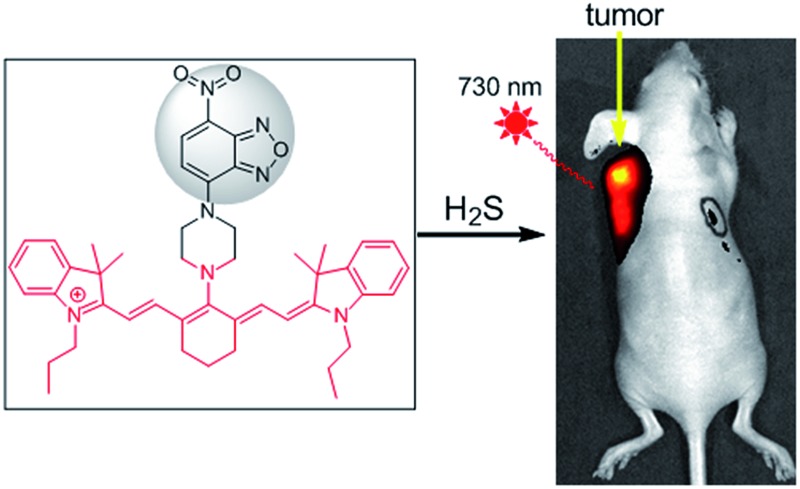
 A highly sensitive H2S-specific near-infrared fluorescence-enhanced probe was developed for real-time imaging of endogenous H2S in colorectal cancer cells (HCT116 and HT29) in mice.
Abstract
Near-infrared (NIR) fluorescence-based sensors capable of selective detection of H2S in vivo would be useful tools to understand the mechanisms of diseases. A new NIR fluorescence probe 1 was developed for the detection of endogenous H2S in colorectal cancer cells in mice. 1 displayed an 87-fold fluorescence enhancement at 796 nm (with excitation at 730 nm) when reacted with H2S in a buffer (pH 7.4). 1 was water-soluble, cell-membrane-permeable, had low cytotoxicity and high selectivity and sensitivity for H2S. The properties of 1 enable its use in monitoring endogenous H2S in living cells, tissues, and mice. The bioimaging results indicated that (1) d-Cys could induce endogenous H2S production in living cells and stimulate angiogenesis; (2) tail intravenous injection of 1 into mice generated strong fluorescence in the liver while intraperitoneal injection of d-Cys could further enhance fluorescence in the liver in vivo; (3) importantly, endogenous H2S in colorectal cancer cells (HCT116, HT29) in vitro and in murine tumor models could be quickly and selectively detected by intratumoral injection of 1. These results indicated that our new probe could serve as an efficient tool for the detection of cellular H2S in living animals and even for cancer diagnosis.
Introduction
Hydrogen sulfide (H2S) has long been known as a toxic gas, however recent studies indicated that endogenously produced H2S has important physiological functions, and was also named as the third gasotransmitter after nitric oxide and carbon monoxide.1 Endogenous H2S can be enzymatically produced by three distinctive pathways including cystathionine β-synthase (CBS), cystathionine γ-lyase (CSE), and 3-mercaptopyruvate sulfurtransferase (3-MST) coupling with cysteine aminotransferase (CAT).2 Accumulating evidence suggests that H2S influences a wide range of physiological and pathological processes,3–7 including the modulation of blood vessel tone and cardioprotection,3 the endogenous stimulation of angiogenesis4 and mitochondrial bioenergetics.5 H2S inhibited nuclear factor-kB activation in oxidized low-density lipoprotein-stimulated macrophages.6 H2S also plays important roles in tumor biology, and it is suggested that both the inhibition of H2S biosynthesis and elevation of H2S concentration beyond a certain threshold could exert anticancer effects.7,4b Nevertheless, the pharmacological character of H2S and the precise mechanisms by which H2S may be involved still remain largely unclear. Therefore, efficient tools for the visualization of endogenous H2S in vivo should be invaluable in further exploring H2S biology and even for the diagnosis of H2S-related diseases.
A fluorescence-based method has recently emerged as an efficient approach for the in situ and real-time detection of H2S in biological systems. Various fluorescence probes have been successfully employed to detect cellular H2S.8–16 However, H2S fluorescence probes for in vivo bioimaging are still rare,8 especially for the imaging of H2S-related diseases including cancers.11c Suitable fluorescence probes for the imaging of H2S in tissues or individuals are preferred to meet certain requirements, such as a NIR optical window, enhanced fluorescence, fast and sensitive response, good selectivity, water-solubility and low cytotoxicity simultaneously. Organic reactions of nucleophilic additions are not suitable for the development of turn-on NIR probes due to the interruption of a large conjugate system by H2S addition.10 The reduction of a nitro group is relatively slow in a NIR probe,12c while azide-based NIR probes are not employed for the imaging of H2S in animals.12 Thiolysis reactions should be one of ideal strategies for the development of NIR probes. Considering the concentration of GSH ranges from 1 to 15 mM depending on the cell types,17 we discovered a reaction of H2S-specific thiolysis of 7-nitro-1,2,3-benzoxadiazole (NBD) amines even in the presence of millimolar GSH,16 which was further employed herein for the development of a new NIR probe 1 (Scheme 1).
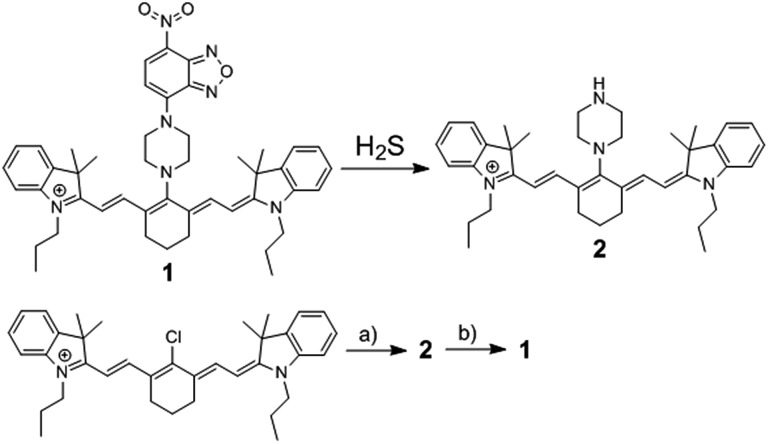
Scheme 1. The chemical structure of fluorescence probe 1, its reaction with H2S, and its synthetic routine. (a) Piperazine, 82.3%; (b) 7-nitro-1,2,3-benzoxadiazole chloride, 60.2%.
NIR light, especially at 700–900 nm, can improve the tissue depth penetration, offer low phototoxicity to cells and minimize the effect from background autofluorescence.18 Among NIR fluorochromes, cyanine dyes have excellent photophysical properties, outstanding biocompatibility, and low toxicity to living systems for the successful development of fluorescence probes.19 Herein we report a cyanine-based NIR probe 1 for the highly selective imaging of endogenous H2S in tissues and living mice. We also successfully applied probe 1 for monitoring intratumoral H2S by an in vivo fluorescence bioimaging technique, highlighting the potentially tumor-diagnostic value of this NIR probe.
Results and discussion
Synthesis and optical characterizations
The reaction of commercially available Cy7-Cl and piperazine in DMF provided 2,19b and the synthesis of 1 was easily achieved by coupling reaction of 2 and NBD-Cl (Scheme 1). A facile and economic synthesis is important for the wide use of such a probe. 1 was well characterized by 1H NMR, 13C NMR and HRMS.
Studies were carried out to use 1 for the detection of H2S under simulated physiological conditions (50 mM phosphate buffer saline (PBS), pH 7.4). The time-dependent absorbance (Fig. S1†) at NIR range for 1 exhibited a maximum at 700 nm, which shifted to around 740 nm after treatment with H2S. The NBD absorbance displayed a decrease at 450–500 nm and an increase at 565 nm, implying that H2S could cleave the NBD moiety from probe 1 to give 2. This was further supported by the HRMS results of 1, exhibiting a peak at m/z = 589.4268 after treatment with H2S, which corresponded to 2 ([M+] 589.4265). The absorbance of probe 1 at 700 nm exhibited a wide linear range in 2% DMSO-containing PBS (Fig. S2†), indicating that the probe had good water-solubility up to over 100 μM.
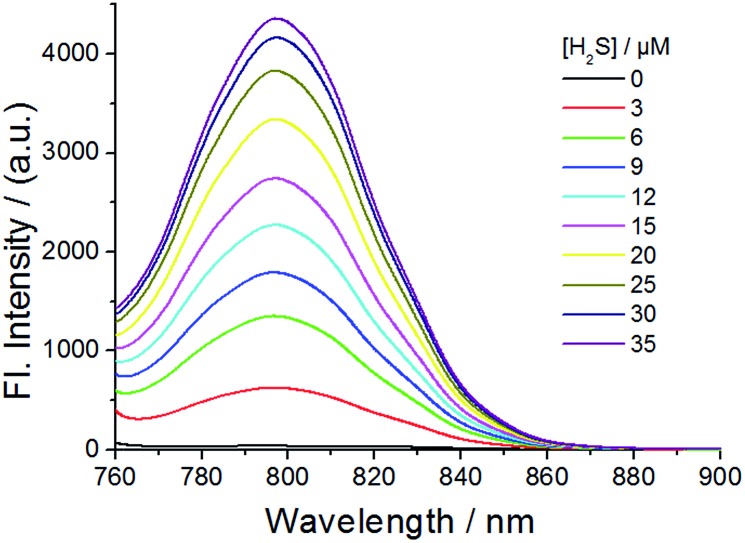
The fluorescence of probe 1 was checked in the absence and presence of H2S in PBS buffer (pH 7.4) (Fig. 1, 2 and S3–S8†). The excitation spectrum of probe 1 in the presence of H2S indicated multiple peaks (689 nm, 714 nm, 733 nm and 764 nm) in the NIR range, providing flexibility for choosing excitation conditions in the NIR range. As shown in Fig. 1, the emission of probe 1 was nearly completely quenched at 796 nm. It is possible that electron transfer might occur from the NBD recognition unit to the cyanine group, resulting in quenching of the fluorophore, which is called the PET (photo-induced electron transfer) effect.20 After reacting with H2S at 37 °C, the NBD part is moved, and hence the PET effect disappears, resulting in the recovery of fluorescence emission of the NIR cyanine. The titration experiments indicated that a higher H2S concentration induced a larger turn-on fluorescence response (Fig. 1), with an off–on response up to 87-fold higher at 796 nm. Further data analysis revealed an excellent linear relationship (r = 0.994) between the fluorescence signal at 796 nm and the concentration of H2S (3–20 μM). We further titrated a low-millimolar concentration of H2S toward the probe 1 at 37 °C and determined a detection limit of 39.6 nM (Fig. S5†) by the 3σ/k method,21 indicating the high sensitivity of our probe. To obtain the reaction kinetics, the time-dependent fluorescence at 796 nm was recorded for data analysis (Fig. S6–S8†). The thiolysis rate for 1 by H2S was found to be up to 14.9 M–1 s–1 at 37 °C. These results implied that probe 1 could react with H2S both sensitively and efficiently.
Fig. 1. Emission spectra of probe 1 (10 μM) in the presence of various concentrations of H2S at 37 °C for 30 min in PBS buffer (50 mM, pH 7.4). Excitation, 730 nm.
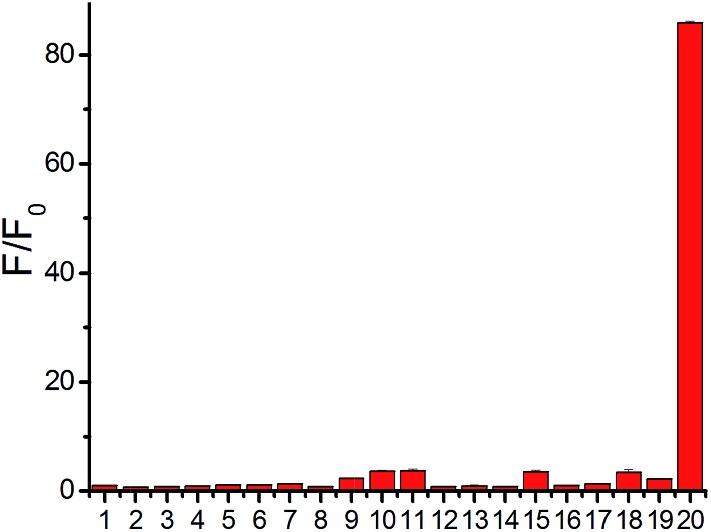
Fig. 2. Relative fluorescence intensity at 796 nm of probe 1 (10 μM) with various species at 37 °C for 30 min in PBS buffer. Lane 1, only probe; lane 2, 100 μM Fe3+; lane 3, 100 μM Zn2+; lane 4, 100 μM H2O2; lane 5, 100 μM ClO–; lane 6, 100 μM NO2 –; lane 7, 100 μM S2O3 2–; lane 8, 100 μM SO3 2–; lane 9, 1 mM Hcy; lane 10, 1 mM Cys; lane 11, 5 mM GSH; lane 12, 1 mM 2,2′-dithiodipyridine; lane 13, 1 mM 2,2′-dithiodipyridine + 100 μM H2S; lane 14, 1 mM cystamine; lane 15, 1 mM cystamine + 100 μM H2S; lane 16, 10 μM lysozyme; lane 17, 10 μM lysozyme + 100 μM dithiodipyridine + 50 μM H2S; lane 18, 10 μM BSA; lane 19, 10 μM BSA + 100 μM dithiodipyridine + 50 μM H2S; lane 20, 100 μM H2S.
A major challenge for H2S detection in biological systems is to develop a highly selective probe that exhibits a distinctive response to micromolar H2S concentrations over millimolar GSH concentrations. Probe 1 was incubated with various biological-related species in PBS buffer for 30 min and the maximum emission change at 796 nm was measured accordingly (Fig. 2). The tested species included reactive sulfur species (GSH, 5 mM; Cys, 1 mM; Hcy, 1 mM), reactive oxygen species (H2O2, ClO–), additional reactive sulfur species (SO3 2–, S2O3 2–), anions (NO2 –), cations (Zn2+, Fe3+), low-molecular weight species and protein persulfides.22 The fluorescence intensity enhancement for any tested molecule in PBS buffer (pH 7.4) was very small except for H2S (Fig. 2), indicating the high selectivity of our NIR probe.15
Fluorescence imaging of H2S in living cells by 1
To test the biological applicability of the NIR probe, we firstly examined whether it can be used to detect H2S in living cells. Herein, mouse endothelial cell line (bEnd.3, with a low background endogenous H2S level) was employed for studying H2S-related angiogenesis.4 The results indicated that the 1-treated cells (bEnd.3) showed weak fluorescence while the addition of both probe 1 and H2S to the cells resulted in obvious fluorescence, and a higher H2S concentration induced stronger fluorescence (Fig. S9†), implying that 1 could be used for the visualization of a change in H2S levels. The control experiments of aminooxyacetic acid (AOAA)-pretreated cells showed much weaker fluorescence than that of cells in the absence of an inhibitor (Fig. S10†), implying that 1 could be used for the detection of endogenous H2S in cells lines with a low background H2S level. Bright-field images show that cells retained a good morphology after incubation with 1, suggesting good biocompatibility with the probe. The biocompatibility of 1 was further evaluated using cells by MTT assay (Fig. S11†). The results indicated that the probe possesses low cytotoxicity at the test concentration.
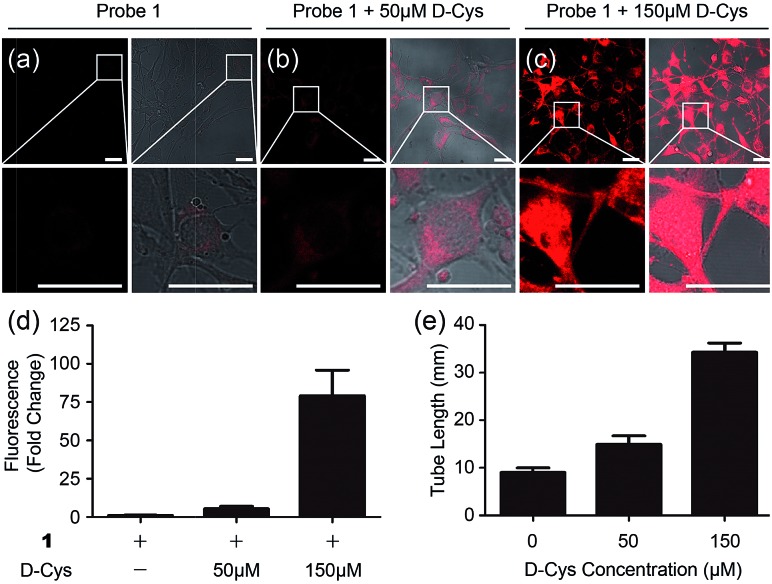
To test whether 1 could detect endogenous production of H2S in living cells, we employed d-Cys as a stimulant because our previous work indicated that d-Cys can induce enzymatic H2S production in mitochondria from HEK293 cells.16a Cells with 1 displayed weak fluorescence, while in the d-Cys-stimulated cells strong fluorescence could be observed (Fig. 3a–c), implying that d-Cys induced endogenous H2S production. The average fluorescence of the images (Fig. 3d) implied that a higher concentration of d-Cys induced more H2S production in cells, and such an effect was further employed for the in vitro angiogenesis assay in the presence of d-Cys (Fig. S12†). The results indicated the tube length of the 50 μM d-Cys treated group became about 1.5-fold higher than that of the vehicle-treated group, while the 150 μM d-Cys treated group increased 2.5-fold (Fig. 3e). Therefore, d-Cys could induce endogenous H2S production in living cells and stimulate angiogenesis, which has not been observed previously. Taken together, these results indicated that probe 1 can be used for the study of endogenous H2S production and its biological functions.
Fig. 3. Microscope images of d-Cys-induced H2S in living cells and the angiogenesis assay in the presence of d-Cys. (a–c) Fluorescence images and overlap pictures of fluorescence and bright-field images of cells with 10 μM of probe 1, with 50 μM of d-Cys and then 10 μM of probe, with 150 μM of d-Cys and then 10 μM of the probe, respectively. Scale bar, 25 μm. (d) The average fluorescence intensity of fluorescence images in panels (a–c). (e) Quantitative tube length at indicated d-Cys concentrations in Fig. S12.† .
In vivo fluorescence imaging of H2S in mice by 1
The high selectivity and excitation/emission wavelength of 1 in the NIR range shows it should be suitable for visualization of endogenous H2S in vivo. We firstly examined the suitability of 1 for visualizing exogenous H2S in mice. Mice were intraperitoneally (i.p.) cavity injected with probe 1 and Na2S, and then imaged using Xenogen IVIS Spectrum (IVIS Lumina II), a small animal in vivo imaging system with a 710 nm excitation filter and an ICG emission filter. The results (Fig. S13 and S14†) indicated that the mouse treated with both Na2S and the probe displayed much higher fluorescence than that treated only with the probe, and time-dependent images showed that the fluorescence response in vivo was fast with a t 1/2 of less than 10 min, which is comparable with in vitro kinetic studies (Fig. S8†). The results indicated that the NIR probe possessed a desirable penetration depth for in vivo imaging, and could be further used to investigate endogenous H2S in living mice and tissues.
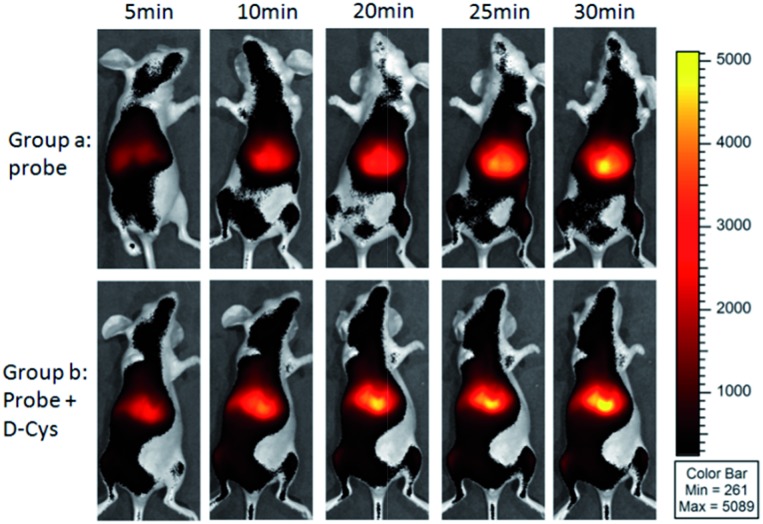
As shown in Fig. 4, the mice in group a were intravenously injected with probe 1 for 0–30 min, and intense time-dependent enhanced fluorescence could be observed in the liver of living mice. We also investigated the d-Cys-induced H2S in living mice with probe 1. The mice in group b were i.p. injected with d-Cys. After 30 min, the mice were intravenously injected with probe 1. A time-dependent fluorescence increase in the liver was also observed (Fig. 4). The average fluorescence of group b was about 10–20% higher than that of group a at various time points (Fig. S15†), implying that d-Cys could be metabolized into H2S in living mice and greatly occurred in the liver. These results were further confirmed by tissue imaging from the intravenous injection in mice (Fig. S16†). Fluorescence imaging indicated that H2S was produced in the tissues of the liver and the kidney, with the fluorescence intensity of the liver being larger than that of the kidney. While in the case of d-Cys-induced H2S, stronger fluorescence was observed for both liver and kidney tissues than that of the uninduced mice. The western blotting results indicated that the H2S-produced enzymes (e.g. CBS) in the liver are more expressed than that of the kidney (Fig. S16F†), which is consistent with our fluorescence imaging results. Similar results of endogenous H2S in the liver were also observed with the injection of a lower amount of probe 1 in another group of mice (Fig. S17 and S18†). These observations clearly demonstrate that 1 is an effective probe for endogenous H2S at the organism level.
Fig. 4. Representative fluorescence images for visualizing endogenous H2S with tail intravenous injection of probe 1 (150 μM, 200 μL) in living mice. For group a, time-dependent images of a mouse via only injection of probe 1; for group b, time-dependent images of a mouse via i.p. injection of d-Cys, and after 30 min tail intravenous injection of probe 1.
Fluorescence imaging of endogenous H2S in cancer cells and in mice by 1
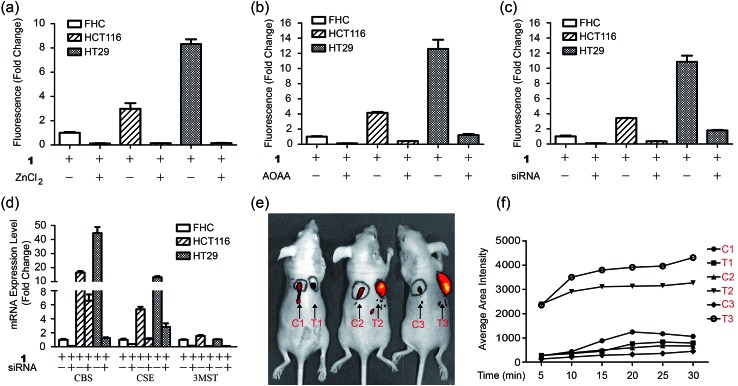
Importantly, we hope to use the NIR H2S probe to image H2S-related cancers in vivo. Herein human colorectal epithelial cancer cell lines HCT116 and HT29 were selected as model biological systems and human normal colorectal epithelial cell line FHC was used as a control.7c We tested the fluorescence images of these cell lines with probe 1 (Fig. 5a and S19†). The results indicated that the 1-treated cancer cells (HCT116 or HT29) showed stronger fluorescence than that of the FHC cells. The control experiments of ZnCl2-pretreated cells showed nearly no fluorescence for all cell lines. Changes of the endogenous H2S level in living cells by inhibitors AOAA or siRNA were further performed by the gene-knockdown-based fluorescence imaging strategy from our previous work.11d,23 Normal cells and specific gene-silencing cells were used for the bioimaging of endogenous H2S with probe 1 (Fig. S20†). The fluorescence of AOAA-treated or siRNA-treated cells was significantly weaker than that of the corresponding untreated cells (Fig. 5b and c). The mRNA expression level of H2S-produced enzymes of all cell lines and siRNA-silenced cells were checked by quantitative real-time PCR (Fig. 5d). The results indicated that both cancer cells (HCT116, HT29) expressed more H2S-produced enzymes, CBS and CSE, than that of the control cells (FHC), which explained the higher H2S level in cancer cells from our fluorescence imaging results. The expression of the H2S-produced enzymes could be downregulated via RNAi to give a low endogenous H2S level in living cancer cells, which could be visualized by our NIR probe.
Fig. 5. Fluorescence imaging of endogenous H2S in CBS-overexpressed cancer cells in mice. (a) Average fluorescence of images of living cells (FHC, HCT116, HT29) in the presence or absence of ZnCl2. (b) Average fluorescence of images of living cells in the presence or absence of inhibitor AOAA. (c) Average fluorescence of images of living cells in the presence or absence of siRNAs. (d) The mRNA expression level for H2S-produced enzymes in three cells lines in the presence or absence of siRNAs. (e) In vivo fluorescence images of mice with skin-pop (s.p.) or intratumoral injection of probe 1. The left injection positions (C1, C2, C3) were for control purposes, while the right injection positions (T1, T2, T3) were for FHC, HCT116, and HT29 grafted cell positions. Observed tumors were formed in the HCT116 (T2) and HT29 (T3) xenograft mice. (f) The time-dependent average fluorescence of C1–C3, T1–T3 positions in mice in panel (e).
Now that probe 1 could detect endogenous H2S in colorectal cancer cells, imaging of intratumoral H2S in vivo was further tested. FHC, HCT116, and HT29 cells were grafted into the nude mouse, respectively, to produce murine xenograft tumor models. After the direct skin-pop (s.p.) injection of 1 in PBS buffer into the tumors of HCT116- or HT29-xenograft mice, the emission was collected in the NIR range. Control experiments contained (1) the s.p. injection of 1 into other nontumoral parts of the same mice and (2) a FHC-xenograft mice (Fig. 5e). To kinetically observe the change in the fluorescence intensity, time-dependent experiments were performed (Fig. 5f, S21 and S22†). The results indicated that strong fluorescence in the tumor part could be observed quickly after intratumoral injection (5 min), while the control experiments only showed very weak fluorescence under the same conditions. Time-dependent fluorescence intensity measurements of these mice (Fig. 5d) indicated that the fluorescence of HCT116 and HT29 xenograft tumors is much higher than that of other parts (C1–C3, T1). Pre-injection of inhibitor AOAA significantly decreased the intratumoral fluorescence (Fig. S23†). Considering that H2S could be a biomarker in CBS- or CSE-overexpressed cancer cells (colorectal and ovarian cancers),7c we proposed that our probe 1 combined with fluorescence bioimaging in the NIR range could provide a potential tool for the in vivo monitoring of endogenous H2S in the tumor. To our knowledge, this is the first time a NIR probe has been used for the monitoring of H2S in tumors in vivo.24
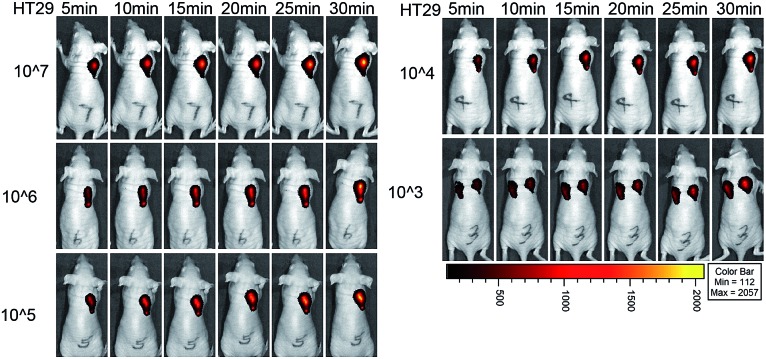
Moreover, we used the NIR probe to test the detection limit of colorectal cancer cells in situ in living mice (Fig. 6). Mice were injected with different numbers of HT29 cells and the probe was used to image the cancer cells at 24 h after injection. A significant fluorescence signal was detected in the cell-injected region even at 5 min for 107 cancer cells. After 30 min, a strong fluorescence signal could be observed for 103 to 107 HT29 cells in living mice, and the signal intensity for 103 cells was stronger than that for the PBS control (Fig. S24†). Taking the results from the in vitro and in vivo experiments together, we believe that the NIR probe is highly sensitive for imaging endogenous H2S in cancer cells and in mice with an excellent detection limit.
Fig. 6. Cancer cell detection limit and sensitivity of the NIR probe in living mice. Fluorescence images of mice with injection of 107, 106, 105, 104 and 103 HT29 cells at different time points. The control of only the PBS-injected position was in the left part of the mouse which was injected with 103 HT29 cells in the right part.
Conclusions
In summary, we have developed a new NIR fluorescence probe 1 capable of real-time imaging of endogenous H2S in cells, tissues (containing tumors) and mice. 1 is highly selective, has enhanced fluorescence (87-fold), a fast-response, is water soluble and has a low cytotoxicity with both an excitation and emission larger than 700 nm. The properties of 1 enable its use for noninvasive in vivo imaging of endogenous H2S without interfering with biological autofluorescence. Fluorescence imaging combined with the tail intravenous injection of 1 revealed that endogenous H2S heavily existed in the liver of living mice and d-Cys could induce more H2S production in the liver in vivo. Moreover, the endogenous H2S in colorectal cancer cells and in the tumors of mice could be detected by our probe tool. This new probe could serve as an efficient tool for the detection of cellular H2S in living animals and even for tumor diagnosis.
Acknowledgments
This work was supported by NSFC (21332004, 21402007, 81272356, 81672747), the Fundamental Research Funds for the Central Universities (YS1401) and Tianjin Municipality Science and Technology Commission (15JCYBJC50100).
Footnotes
References
- (a) Wang R. Physiol. Rev. 2012;92:791. doi: 10.1152/physrev.00017.2011. [DOI] [PubMed] [Google Scholar]; (b) Kolluru G. K., Shen X., Bir S. C., Kevil C. G. Nitric Oxide. 2013;35:5. doi: 10.1016/j.niox.2013.07.002. [DOI] [PMC free article] [PubMed] [Google Scholar]
- Li L., Rose P., Moore P. K. Annu. Rev. Pharmacol. Toxicol. 2011;51:169. doi: 10.1146/annurev-pharmtox-010510-100505. [DOI] [PubMed] [Google Scholar]
- Liu Y. H., Lu M., Hu L. F., Wong P. T., Webb G. D., Bian J. S. Antioxid. Redox Signaling. 2012;17:141. doi: 10.1089/ars.2011.4005. [DOI] [PubMed] [Google Scholar]
- (a) Papapetropoulos A., Pyriochou A., Altaany Z., Yang G., Marazioti A., Zhou Z., Jeschke M. G., Branski L. K., Herndon D. N., Wang R., Szabó C. Proc. Natl. Acad. Sci. U. S. A. 2009;106:21972. doi: 10.1073/pnas.0908047106. [DOI] [PMC free article] [PubMed] [Google Scholar]; (b) Coletta C., Módis K., Szczesny B., Brunyánszki A., Oláh G., CS Rios E., Yanagi K., Ahmad A., Papapetropouloos A., Szabo C. Mol. Med. 2015;21:1. doi: 10.2119/molmed.2015.00035. [DOI] [PMC free article] [PubMed] [Google Scholar]
- Módis K., Ju Y., Ahmad A., Untereiner A. A., Altaany Z., Wu L., Szabó C., Wang R. Pharmacol. Res. 2016;113:116. doi: 10.1016/j.phrs.2016.08.023. [DOI] [PMC free article] [PubMed] [Google Scholar]
- Du J., Huang Y., Yan H., Zhang Q., Zhao M., Zhu M., Liu J., Chen S. X., Bu D., Tang C., Jin H. J. Biol. Chem. 2014;289:9741. doi: 10.1074/jbc.M113.517995. [DOI] [PMC free article] [PubMed] [Google Scholar]
- (a) Szabo C. Nat. Rev. Drug Discovery. 2016;15:185. doi: 10.1038/nrd.2015.1. [DOI] [PMC free article] [PubMed] [Google Scholar]; (b) Wu D., Si W., Wang M., Lv S., Ji A. Nitric Oxide. 2015;50:38. doi: 10.1016/j.niox.2015.08.004. [DOI] [PubMed] [Google Scholar]; (c) Hellmich M. R., Coletta C., Chao C., Szabo C. Antioxid. Redox Signaling. 2015;22:424. doi: 10.1089/ars.2014.5933. [DOI] [PMC free article] [PubMed] [Google Scholar]
- For selected reviewers: ; (a) Lin V. S., Chen W., Xian M., Chang C. J. Chem. Soc. Rev. 2015;44:4596. doi: 10.1039/c4cs00298a. [DOI] [PMC free article] [PubMed] [Google Scholar]; (b) Yu F. B., Han X. Y., Chen L. X. Chem. Commun. 2014;50:12234. doi: 10.1039/c4cc03312d. [DOI] [PubMed] [Google Scholar]
- (a) Qian Y., Karpus J., Kabil O., Zhang S. Y., Zhu H. L., Banerjee R., Zhao J., He C. Nat. Commun. 2011;2:495. doi: 10.1038/ncomms1506. [DOI] [PubMed] [Google Scholar]; (b) He L. W., Lin W. Y., Xu Q. Y., Wei H. P. Chem. Commun. 2015;51:1510. doi: 10.1039/c4cc08522a. [DOI] [PubMed] [Google Scholar]; (c) Qian Y., Zhang L., Ding S. T., Deng X., He C., Zheng X. E., Zhu H. L., Zhao J. Chem. Sci. 2012;3:2920. [Google Scholar]; (d) Feng X., Zhang T., Liu J.-T., Miao J.-Y., Zhao B.-X. Chem. Commun. 2016;52:3131. doi: 10.1039/c5cc09267a. [DOI] [PubMed] [Google Scholar]
- (a) Chen Y. C., Zhu C. C., Yang Z. H., Chen J. J., He Y. F., Jiao Y., He W. J., Qiu L., Cen J. J., Guo Z. J. Angew. Chem., Int. Ed. 2013;52:1688. doi: 10.1002/anie.201207701. [DOI] [PubMed] [Google Scholar]; (b) Wang X., Sun J., Zhang W., Ma X., Lv J., Tang B. Chem. Sci. 2013;4:2551. [Google Scholar]; (c) Li H. D., Yao Q. C., Fan J. L., Jiang N., Wang J. Y., Xia J., Peng X. J. Chem. Commun. 2015;51:16225. doi: 10.1039/c5cc06612c. [DOI] [PubMed] [Google Scholar]
- (a) Zhang L., Meng W. Q., Lu L., Xue Y. S., Li C., Zou F., Liu Y., Zhao J. Sci. Rep. 2014;4:5870. doi: 10.1038/srep05870. [DOI] [PMC free article] [PubMed] [Google Scholar]; (b) Henthorn H. A., Pluth M. D. J. Am. Chem. Soc. 2015;137:15330. doi: 10.1021/jacs.5b10675. [DOI] [PMC free article] [PubMed] [Google Scholar]; (c) Wu Z., Liang D., Tang X. Anal. Chem. 2016;88:913. doi: 10.1021/acs.analchem.6b02459. [DOI] [PubMed] [Google Scholar]; (d) Ke B., Wu W., Liu W., Liang H., Gong D., Hu X., Li M. Anal. Chem. 2016;88:592. doi: 10.1021/acs.analchem.5b03636. [DOI] [PubMed] [Google Scholar]; (e) Wei L., Zhu Z., Li Y., Yi L., Xi Z. Chem. Commun. 2015;51:10463. doi: 10.1039/c5cc03707g. [DOI] [PubMed] [Google Scholar]
- (a) Yu F., Li P., Song P., Wang B., Zhao J., Han K. Chem. Commun. 2012;48:2852. doi: 10.1039/c2cc17658k. [DOI] [PubMed] [Google Scholar]; (b) Sun W., Fan J., Hu C., Cao J., Zhang H., Xiong X., Wang J., Cui S., Sun S., Peng X. Chem. Commun. 2013;49:3890. doi: 10.1039/c3cc41244j. [DOI] [PubMed] [Google Scholar]; (c) Wang R., Yu F., Chen L., Chen H., Wang L., Zhang W. Chem. Commun. 2012;48:11757. doi: 10.1039/c2cc36088h. [DOI] [PubMed] [Google Scholar]; (d) Zheng Y., Zhao M., Qiao Q., Liu H., Lang H., Xu Z. Dyes Pigm. 2013;98:367. [Google Scholar]
- (a) Sasakura K., Hanaoka K., Shibuya N., Mikami Y., Kimura Y., Komatsu T., Ueno T., Terai T., Kimura H., Nagano T. J. Am. Chem. Soc. 2011;133:18003. doi: 10.1021/ja207851s. [DOI] [PubMed] [Google Scholar]; (b) Wu H., Krishnakumar S., Yu J., Liang D., Qi H., Lee Z.-W., Deng L.-W., Huang D. Chem.–Asian J. 2014;9:3604. doi: 10.1002/asia.201402860. [DOI] [PubMed] [Google Scholar]; (c) Liu J., Guo X., Hu R., Liu X., Wang S., Li S., Li Y., Yang G. Anal. Chem. 2016;88:1052. doi: 10.1021/acs.analchem.5b04248. [DOI] [PubMed] [Google Scholar]
- Huang Z. J., Ding S. S., Yu D. H., Huang F. H., Feng G. Q. Chem. Commun. 2014;50:9185. doi: 10.1039/c4cc03818e. [DOI] [PubMed] [Google Scholar]
- (a) Chen S., Ma C., Yuan M.-S., Wang W., Wang D.-E., Chen S.-W., Wang J. RSC Adv. 2016;6:85529. [Google Scholar]; (b) Chen H., Lin W., Cui H., Jiang W. Chem.–Eur. J. 2015;21:733. doi: 10.1002/chem.201404718. [DOI] [PubMed] [Google Scholar]; (c) Cao X., Lin W., Zheng K., He L. Chem. Commun. 2012;48:10529. doi: 10.1039/c2cc34031c. [DOI] [PubMed] [Google Scholar]; (d) Maity D., Raj A., Samanta P. K., Karthigeyan D., Kundu T. K., Pati S. K., Govindaraju T. RSC Adv. 2014;4:11147. [Google Scholar]
- (a) Wang R. Y., Li Z. F., Zhang C. Y., Li Y. Y., Xu G. C., Zhang Q. Z., Li L. Y., Yi L., Xi Z. ChemBioChem. 2016;17:962. doi: 10.1002/cbic.201600060. [DOI] [PubMed] [Google Scholar]; (b) Wei C., Wei L., Xi Z., Yi L. Tetrahedron Lett. 2013;54:6937. [Google Scholar]; (c) Pak Y. L., Li J., Ko K. C., Kim G., Lee J. Y., Yoon J. Anal. Chem. 2016;88:5476. doi: 10.1021/acs.analchem.6b00956. [DOI] [PubMed] [Google Scholar]; (d) Wei C., Zhu Q., Liu W. W., Chen W. B., Xi Z., Yi L. Org. Biomol. Chem. 2014;12:479. doi: 10.1039/c3ob41870g. [DOI] [PubMed] [Google Scholar]; (e) Karakuş E., Üçüncü M., Emrullahoğlu M. Anal. Chem. 2016;88:1039. doi: 10.1021/acs.analchem.5b04163. [DOI] [PubMed] [Google Scholar]
- (a) Marí M., Morales A., Colell A., García-Ruiz C., Kaplowitz N., Fernández-Checa J. C. Biochim. Biophys. Acta. 2013;1830:3317. doi: 10.1016/j.bbagen.2012.10.018. [DOI] [PMC free article] [PubMed] [Google Scholar]; (b) Noctor G., Mhamdi A., Chaouch S., Han Y., Neukermans J., Marouez-Garcia B., Oueval G., Foyer C. H. Plant, Cell Environ. 2012;35:454. doi: 10.1111/j.1365-3040.2011.02400.x. [DOI] [PubMed] [Google Scholar]
- (a) Slooter M. D., Bierau K., Chan A. B., Löwik C. W. Connect. Tissue Res. 2015;56:153. doi: 10.3109/03008207.2015.1012586. [DOI] [PubMed] [Google Scholar]; (b) Manley M. Chem. Soc. Rev. 2014;43:8200. doi: 10.1039/c4cs00062e. [DOI] [PubMed] [Google Scholar]
- (a) Sun W., Guo S., Hu C., Fan J., Peng X. Chem. Rev. 2016;116:7768. doi: 10.1021/acs.chemrev.6b00001. [DOI] [PubMed] [Google Scholar]; (b) Yin J., Kwon Y., Kim D., Lee D., Kim G., Hu Y., Ryu J.-H., Yoon J. J. Am. Chem. Soc. 2014;136:5351. doi: 10.1021/ja412628z. [DOI] [PubMed] [Google Scholar]; (c) Vahrmeijer A. L., Hutteman M., Van der Vorst J. R., Van de Velde C. J. H., Frangioni J. V. Nat. Rev. Clin. Oncol. 2013;10:507. doi: 10.1038/nrclinonc.2013.123. [DOI] [PMC free article] [PubMed] [Google Scholar]
- Loudet A., Burgess K. Chem. Rev. 2007;107:4891. doi: 10.1021/cr078381n. [DOI] [PubMed] [Google Scholar]
- Long G. L., Winefordner J. D. Anal. Chem. 1983;55:712A. [Google Scholar]
- Pan J., Carroll K. S. ACS Chem. Biol. 2013;8:1110. doi: 10.1021/cb4001052. [DOI] [PMC free article] [PubMed] [Google Scholar]
- Yi L., Wei L., Wang R., Zhang C., Zhang J., Tan T., Xi Z. Chem.–Eur. J. 2015;21:15167. doi: 10.1002/chem.201502832. [DOI] [PubMed] [Google Scholar]
- During the revision and resubmission of this manuscript (first submission on Oct. 16th 2016), a paper (Chem. Sci., DOI: 10.1039/c6sc04703c) for imaging of HCT116 tumors based on H2S as a biomarker was published.
Associated Data
This section collects any data citations, data availability statements, or supplementary materials included in this article.


