

Abstract
Dietary methionine restriction (MR) increases longevity and improves healthspan in rodent models. Young male C57BL/6J mice were placed on MR to assess effects on bone structure and formation. Mice were fed diets containing 0.86% or 0.12% methionine for 5 weeks. Fasting blood plasma was analyzed for metabolic and bone-related biomarkers. Tibiae were analyzed by histomorphometry, while femurs were analyzed by micro-CT and biomechanically using 4-point bending. MR mice had reduced plasma glucose and insulin, while FGF21 and FGF23 increased. Plasma levels of osteocalcin and osteoprotegrin were unaffected, but sclerostin and procollagen I decreased. MR induced bone marrow fat accretion, antithetical to the reduced fat depots seen throughout the body. Cortical bone showed significant decreases in Bone Tissue Density (BTD). In trabecular bone, mice had decreased BTD, bone surface, trabecula and bone volume, and trabecular thickness. Biomechanical testing showed that on MR, bones were significantly less stiff and had reduced maximum load and total work, suggesting greater fragility. Reduced expression of RUNX2 occurred in bone marrow of MR mice. These results suggest that MR alters bone remodeling and apposition. In MR mice, miR-31 in plasma and liver, and miR-133a, miR-335-5p, and miR-204 in the bone marrow was elevated. These miRNAs were shown previously to target and regulate Osterix and RUNX2 in bone, which could inhibit osteoblast number and function. Therefore, dietary MR in young animals alters bone structure by increasing miRNAs in bone and liver that can target RUNX2.
Keywords: Methionine restriction, Bone, miRNA, RUNX2
Methionine restriction (MR) provides beneficial effects through improved metabolism and increased lifespan. The effects of MR were shown to occur in many different types of organisms including rodents, drosophila, nematodes, and yeast (1–8). Although there are beneficial effects of MR, it was reported that it reduces body size in rodents (9,10).
Previous MR studies reported growth restriction throughout the body of young growing male mice and rats (9,10). One study examined MR and high fat diets (HFD) and reported that bone mass density (BMD) and bone mineral content (BMC) were reduced in HFD-MR compared to HFD-CF mice (9). In rats, a similar finding was seen in which MR rats were smaller, had reduced bone mass by micro-computed tomography (micro-CT), and decreased biomechanical strength as measured by 3-point bending (10). However, neither of these studies examined how MR could affect osteoblast and osteoclast differentiation and function.
MR also may affect bone function owing to the increased circulating levels of fibroblast growth factor 21 (FGF21) and homocysteine. FGF21 is a hormone secreted by the liver during fasting (11) and during MR (9,12). In addition to the beneficial effect of increasing insulin sensitivity, it was reported to block somatic cell growth and cause bone loss in mice over-expressing FGF21 in the liver. The increased bone loss was due to the induction of PPAR-γ, which increased adipogenesis while inhibiting osteoblast differentiation (13). Rodents on MR become hyperhomocysteinemic due to decreased activity of cystathionine β-synthase (CBS) (14). Lower CBS levels reduced blood flow to bone resulting in lower bone mass due to changes in bone remodeling (15).
An additional layer of bone regulation occurs through microRNAs (miRNAs, miRs). MiRNAs are small single-stranded noncoding RNAs that have emerged as post-transcriptional regulators of gene expression (16,17). Increasing numbers of miRNAs were identified that regulate osteoblast differentiation and bone formation either by targeting negative regulators of osteogenesis or by targeting osteogenic factors (18–20). DKK1, a Wnt inhibitor that promotes osteogenesis, is targeted by miRNAs (21), whereas other miRNAs target RUNX2, which can inhibit osteoblast differentiation (22). Osteoclast differentiation and function also can be affected by miRNAs (23). This present study examines how MR affects bones from young animals and how these changes may be due in part by MR altering expression levels of miRNAs involved in bone cell differentiation and formation.
Material and Methods
Animals
All studies were approved by the Institutional Animal Care and Use Committee of the Orentreich Foundation for the Advancement of Science. Male C57BL/6J mice were purchased from the Jackson Laboratories (Bar Harbor, ME). Mice were housed in a conventional animal facility maintained at 20 ± 2°C, with 50 ± 10% relative humidity and with a 12 h light: 12 h dark photoperiod. Mice were 3 weeks old at the initiation of the study and 8 weeks old upon termination. Food and water were provided ad libitum. Upon arrival, the mice were acclimatized for one week and fed Purina Lab Chow #5001 (St. Louis, MO). Afterwards, they were weight matched and placed on either CF (0.86% methionine w/w) or MR (0.12% methionine w/w) diets (Research Diets, New Brunswick, NJ) for 5 weeks. Body weights and food consumption were monitored twice weekly. On the day of sacrifice, animals were fasted for 4 hours at the beginning of the light cycle to establish physiological baseline. Mice were sacrificed by CO2 asphyxiation. Blood was collected from the retro-orbital plexus, and plasma was collected, flash frozen, and stored at −80°C until analyzed.
Tissue preparation
The left tibiae of mice were dissected, fixed in 70% ethanol and non-decalcified thin sections (5 μm) of bones were used for histology and histomorphometry. Right femurs were fixed in 70% ethanol for micro-CT analysis. Right tibias were fixed in 10% neural-buffered formalin for 24 hours, rinsed in water, decalcified in 4% EDTA and bone marrow fat was measured. The left femur was isolated and stored in PBS for mechanical testing. All mice were injected with calcein at seven days and 24 hours prior to euthanasia to label bone-forming surfaces in trabecular bone; mice were injected with 30 mg calcein/kg body weight by intraperitoneal injection (Sigma C-0875) (Sigma-Aldrich, St. Louis, MO).
Plasma biochemistry and bone biomarkers
N-terminal propeptide of type I procollagen (PINP) (Immunodiagnostic Systems, Fountain Hills, AZ), FGF-21 (Millipore Corp., Billerica, MA); and leptin, insulin-like growth factor-1 (IGF-1), and adiponectin (R&D Systems, Minneapolis, MN) were determined by ELISA. Multiplex analysis was conducted using a Luminex 200 system at the Human Immune Monitoring Core at the Mount Sinai Icahn School of Medicine (New York, NY) using the metabolites for osteoprotegerin (OPG) and osteocalcin, FGF-23, interleukin-6 (IL-6), insulin, sclerostin (SOST), and tumor necrosis factor alpha (TNF-α) (MBNMAG-41K, Millipore Corp., Danvers, MA).
Histomorphometry
Microscopic analysis of static and dynamic parameters was performed using an Olympus microscope interfaced with the Osteomeasure system software and hardware (Osteometrics, Atlanta, GA). Software calculations of various parameters were based on formulas defined by Parfitt, et al. (1987) (24). All static parameters were measured on trabecular bone beginning immediately under the growth plate in the primary spongiosa excluding endosteal surfaces. Field size for static parameters was 350 microns and the area measured under the growth plate extended 700 microns under the growth plate where most of the trabecular bone was located. Dynamic parameters of bone formation were read similarly using a Nikon microscope equipped with epifluorescence to visualize pulse-labeled calcein on the bone surfaces. The histomorphometrical analysis and bone processing was performed by the Orthopaedic Histology and Histomorphometry Laboratory, Department of Orthopaedics and Rehabilitation, Yale School of Medicine.
Micro-CT
Femurs were analyzed by micro-computed tomography using a Scanco microCT-35 (Scanco Medical, Bruttisellen, Switzerland) at a maximum 10 μm voxel size, with an integration time of 500 ms and energy of 55 kVp. 2D views and 3D volume renderings of the micro-CT data were generated with AltaViewer software, version 1.1.2 (Numira Biosciences, Salt Lake City, UT). Measurements for the trabecular bone include trabecular volume (TV, mm3), bone volume (BV, mm3), BV/TV, Connective density (Conn-dens, 1/mm3), structure model index (SMI), trabecular number (Tb.N, 1/mm), trabecular thickness (Tb.Th, mm), trabecular spacing (Tb.Sp, mm), Apparent density of TV, bone tissue density (of BV), bone surface (BS, mm2), BS/BV, and DA. Cortical bone measurements include TV (mm3), BV(mm3), BV/TV, cortical thickness (Ct.Th, mm), Apparent density (1/mm3), Bone tissue density (1/mm3), BS, BS/BV (1/mm), endosteal radius (mm), periosteal radius (mm), endosteal circumference (mm), periosteal circumference (mm), and moment of inertia (pMOI, mm4). The Yale micro-CT facility at Yale Medical School was used to perform the micro-CT analysis.
Measurement of marrow fat
Long bones were dissected free of soft tissues and fixed in 10% neutral buffered formalin (Fisher #SF100-4) overnight at 4°C with gentle agitation. The next day, bones were washed in cool running tap water. The bones were decalcified in 4% EDTA for 15 days at 4°C, changing the EDTA every 3–4 days. The bones were then stained for lipid using a 1:1 mixture of 2% aqueous osmium tetroxide (Polysciences Inc, Warrington, PA) and 5% potassium dichromate for 48 hrs (34). The bones were then washed in cool running tap water for 2 hrs. Whole bones were imaged using micro-CT performed in water with energy of 55kVp, an integration time of 500 ms, and a maximum isometric voxel size of 10 μm (the “high” resolution setting with a 20mm sample holder) using a Scanco microCT-35. When creating volumes of interest (VOI), the interface between the decalcified bone and the marrow adipose tissue (MAT) is usually apparent, facilitating placement of graphical objects. When segmentation is applied, MAT can be visualized unencumbered by the surrounding bone. The data is a volumetric measurement analogous to the volumetric bone measurement, bone volume/total volume (BV/TV). As such, it is more sensitive and provides a better representation of the physical distribution of MAT than 2-dimentional data. The Yale micro-CT facility at Yale Medical School was used to perform the micro-CT analysis.
Mechanical testing
All femurs were loaded to failure using four-point bending. All whole bone tests were conducted by loading the femur in the anterior to posterior direction, such that the posterior quadrant was subjected to tensile loads. The widths of the lower and upper supports of the four-point bending apparatus were 7 mm and 3 mm, respectively. Tests were conducted with a deflection rate of 0.05mm/sec using a servohydraulic testing machine (Instron model 8874; Instron Corp., Norwood, MA). The load and mid-span deflection were acquired directly at a sampling frequency of 200 Hz. Load-deflection curves were analyzed for stiffness, maximum load, and work to fracture. Yield was defined as a 10% reduction in the secant stiffness relative to the initial tangent stiffness. Post-yield deflection, which is defined as the deflection at failure minus the deflection at yield, was measured. Femurs were tested at room temperature and kept moist with phosphate-buffered saline (PBS). Dr. Tommasini in the Department of Orthopaedics and Rehabilitation, Department of Biomedical Engineering at Yale School of Medicine performed the mechanical testing.
Bone marrow, liver, and plasma RNA isolation and RT-PCR
Soft tissue was removed from femurs and tibias, and then the epiphyses of the bone were removed. Cold PBS was used to flush the bone marrow. Samples were centrifuged for 5 min at 1000 rpm. The bone marrow pellets were flash frozen in liquid nitrogen. Tri-reagent (Molecular Research Center, Inc., Cincinnati, OH) was used to isolate the RNA according to the manufacturer’s procedure. Total RNA was converted to cDNA using the Verso cDNA synthesis kit (Thermo Fisher Scientific, Waltham, MA) according to the manufacturer’s instructions. Primers to mRNAs were generated using NCBI Primer-BLAST, which uses Primer3 (25) (Supplementary Table S1). Real-time PCR was performed using a SYBR-green GoTaq qPCR system (Promega, Madison, WI), with 40 cycles at 95°C for 15 sec, and then 60°C for 1 min using Applied Biosystems StepOne Plus Real-Time PCR System. Ct values were analyzed using the ΔΔ−Ct method (26) and normalized to hypoxanthine guanine phosphoribosyl transferase (HPRT).
Tri-reagent (Molecular Research Center, Inc., Cincinnati, OH) was used to isolate bone marrow or liver (50 mg) total RNA according to the manufacturer’s procedure. RNA isolated from bone marrow or liver was made into cDNA using Universal cDNA synthesis kit II with UniSp6 RNA Spike-in (Exiqon, Woburn, MA) according to the manufacturer’s instructions. Bone marrow and liver cDNA samples served as a template for miRNA quantitative real-time PCR (qPCR) using ExiLENT SYBR ® Green Master Mix, with UniSp6 RNA Spike-in. Exiqon-validated primers were used to detect miRNAs (Supplemental Table S2). qPCR assays were performed using Applied Biosystems StepOne Plus Real-Time PCR System with 40 cycles at 95°C for 15 sec, and then 60°C for 1 min. Ct values were analyzed using the ΔΔ−Ct method (26) and samples were normalized to mmu-miR103-5p. At the end of the PCR cycles, melting curve analyses were performed.
Total RNA was isolated from plasma using the miRCURY™ RNA isolation kit– biofluids, and included UniSp2 RNA Spike-in to monitor the technical consistency of the RNA isolations. No problems with hemolysis were seen as measured by visualizing the plasma, and by measuring mmu-miR23a and mmu-miR451 levels in the samples. RNA (19 μl) was reverse transcribed in 50 μl reactions using the miRCURY LNA™ Universal RT microRNA PCR, Polyadenylation and cDNA synthesis kit (Exiqon, Woburn, MA). Each reverse transcriptase reaction included the addition of an artificial RNA spike-in (UniSp6) to monitor efficiency of the reaction. cDNA was diluted 50 × and assayed in 10 μl PCR reactions according to the protocol for miRCURY LNA™ Universal RT microRNA PCR. The amplification was performed in a LightCycler® 480 Real-Time PCR System (Roche) in 384 well plates. The amplification curves were analyzed using the Roche LC software, both for determination of Cp (by the 2nd derivative method) and for melting curve analysis. Exiqon Services (Vedbaek, Denmark) performed the experiment on the plasma.
Statistical analyses
Data are presented as means ± standard deviations (SD). Comparisons between two groups were conducted using Student’s unpaired two-sided t-tests. 2-way ANOVA with Sidak multiple comparison tests was used in the 4-point bending analysis. All analyses were performed using Prism 6 (GraphPad Software, La Jolla, CA).
Results
MR alters physiology and plasma bone markers in mice
Young mice were fed MR diet for 5 weeks to determine whether the physiology of the animal can be altered rapidly. Mice gained 12.8 g on average on the CF diet, while mice on the MR diet gained only 2.6 g of body weight (Figure 1).
Figure 1.
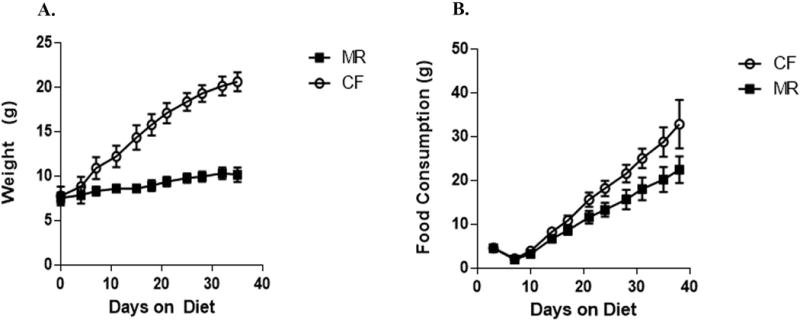
Food consumption and body weight of male mice on CF or MR diet for 5 weeks. Means are plotted with standard error bars. A. Change in body weight over 5 weeks on CF and MR diet. B. Accumulative food consumption over 5 weeks on CF and MR diet.
Previous studies revealed decreased plasma levels of insulin and glucose in mice on MR diet for 10–12 weeks (9). Interestingly, plasma levels of insulin and glucose were significantly decreased in the MR mice (insulin p<0.01 and glucose p<0.001) (Figure 2). Increased levels of FGF-21 were seen in mice after 5 weeks on diet (Figure 2). To determine whether there were any changes in the plasma to indicate altered bone function, levels of PINP, osteocalcin, OPG, FGF-23, and sclerostin were measured. Levels of PINP and sclerostin were both reduced. The decreased levels of PINP suggests that MR may slow down bone resorption (27). MR inhibits osteocyte function by reducing sclerostin levels. Levels of FGF-23 increased significantly, where as osteocalcin and OPG levels did not change for the duration of the study (Figure 2) suggesting that osteoblast function and bone formation was not affected in mice on MR for five weeks. Unaltered OPG levels in MR mice may indicate that osteoblasts were functioning normally and this could suggest that MR did not adversely affect OPG regulation of osteoclasts (Figure 2) (29). Levels of TNF-α were not changed suggesting that MR does not affect inflammatory processes, although future studies will need to examine other inflammatory markers to confirm this finding.
Figure 2.
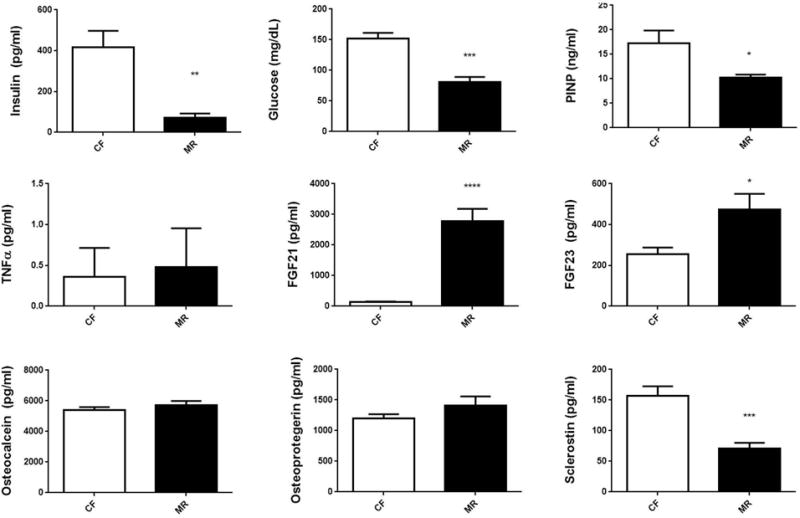
Plasma bone and metabolic markers in male C57B6/J mice on CF or MR diet for 5 weeks. Student unpaired 2-tailed t-test with an alpha=5.0%. **** p≤0.0001, *** p≤0.001, ** p≤0.01, * p≤0.05.
MicroCT analysis and histomorphometry of bones from mice on MR
Micro-CT was performed on the trabecular and cortical bone from mice on CF and MR 5-week diets to examine the bone microarchitecture. In trabecular bone, apparent density of TV (CF, 114 ± 26 mm3 versus MR, 64.3 ± 14 mm3) and bone tissue density of BV (CF, 830 ± 9.3 1/mm3 versus MR, 814 ± 13 1/mm3) were decreased significantly (Table 1). In cortical bone, TV, BV, cortical thickness (Ct.Th), bone surface (BS), endosteal and periosteal radius, and circumference were all decreased significantly (Table 1). BS/BV was increased significantly (p<0.05) in the cortical bone and in trabecular bone (Table 1).
Table 1.
Micro-CT of trabecular and cortical bones from 3-week-old male C57B6/J mice on MR diet for 5 weeks.
| CF | MR | ||||||||||||
|---|---|---|---|---|---|---|---|---|---|---|---|---|---|
|
|
|
||||||||||||
| Trabecular | mean | SD | n | mean | SD | n | |||||||
| TV (mm3) | 2.80 | ± | 0.31 | 8 | 2.20 | ± | 0.17*** | 7 | |||||
| BV (mm3) | 0.344 | ± | 0.09 | 8 | 0.169 | ± | 0.04*** | 7 | |||||
| BV/TV | 0.123 | ± | 0.03 | 8 | 0.076 | ± | 0.01** | 7 | |||||
| Conn-Dens. (1/mm3) | 496 | ± | 155 | 8 | 399 | ± | 130 | 7 | |||||
| SMI | 1.86 | ± | 0.30 | 8 | 2.28 | ± | 0.17** | 7 | |||||
| Tb.N (1/mm) | 5.50 | ± | 0.53 | 8 | 4.98 | ± | 0.27* | 7 | |||||
| Tb.Th (mm) | 0.033 | ± | 0.00 | 8 | 0.028 | ± | 0.001**** | 7 | |||||
| Tb.Sp (mm) | 0.180 | ± | 0.02 | 8 | 0.199 | ± | 0.01* | 7 | |||||
| Apparent Density (of TV) (mm3) | 114 | ± | 26 | 8 | 64.3 | ± | 14*** | 7 | |||||
| Bone Tissue Density (of BV) (1/mm3) | 830 | ± | 9.3 | 8 | 814 | ± | 13* | 7 | |||||
| BS (mm2) | 27.6 | ± | 6.1 | 8 | 16.7 | ± | 3.1*** | 7 | |||||
| BS/BV (1/mm) | 82.3 | ± | 4.8 | 8 | 103.8 | ± | 6.2**** | 7 | |||||
| DA | 1.83 | ± | 0.07 | 8 | 1.63 | ± | 0.06**** | 7 | |||||
|
| |||||||||||||
| CF
|
MR
|
||||||||||||
| Cortical | mean | SD | n | mean | SD | n | |||||||
|
| |||||||||||||
| TV (mm3) | 0.898 | ± | 0.07 | 8 | 0.564 | ± | 0.03**** | 7 | |||||
| BV (mm3) | 0.791 | ± | 0.07 | 8 | 0.478 | ± | 0.03**** | 7 | |||||
| BV/TV | 0.881 | ± | 0.02 | 8 | 0.846 | ± | 0.01** | 7 | |||||
| Ct.Th (1/mm3) | 0.131 | ± | 0.01 | 8 | 0.100 | ± | 0.008**** | 7 | |||||
| Apparent Density (mm3) | 895 | ± | 31 | 8 | 845 | ± | 33** | 7 | |||||
| Bone Tissue Density (1/mm3) | 971 | ± | 28 | 8 | 929 | ± | 34* | 7 | |||||
| BS (mm2) | 12.1 | ± | 1.1 | 8 | 9.70 | ± | 0.24**** | 7 | |||||
| BS/BV (1/mm) | 15.2 | ± | 1.4 | 8 | 20.3 | ± | 1.3**** | 7 | |||||
| endosteal radius (mm) | 0.770 | ± | 0.09 | 8 | 0.638 | ± | 0.03** | 7 | |||||
| periosteal radius (mm) | 0.900 | ± | 0.08 | 8 | 0.738 | ± | 0.02*** | 7 | |||||
| endosteal circumference (mm) | 4.83 | ± | 0.56 | 8 | 4.01 | ± | 0.17** | 7 | |||||
| periosteal circumference (mm) | 5.65 | ± | 0.52 | 8 | 4.63 | ± | 0.15*** | 7 | |||||
| pMOI | 0.270 | ± | 0.05 | 8 | 0.118 | ± | 0.01**** | 7 | |||||
Student unpaired 2-tailed t-test with an alpha=5.0%.
p≤0.0001,
p≤0.001,
p≤0.01,
p≤0.05,
p≤0.10
The structural model index (SMI) provides a descriptive way to examine the strength of bones based on the rod-like and plate-like shape of the trabecular bone. Trabecular bones that were rod-like shape indicate that the bones were weaker than plate-like trabecular bones (30). Young mice on CF had bones that were more plate-like, but became more rod-shaped when mice were on MR diet (Table 1). The conversion from plate-like to rod-like trabecula indicated less intertrabecular connectivity and suggested deterioration of trabecular bone microarchitecture, which could result in weaker bones.
To examine the physiological changes occurring in the bone of mice on MR, static and dynamic histometric analysis was performed. In mice on MR for five weeks, a trend was seen for increased levels of BS/BV (p<0.01) and decreased trabecular thickness (Tb.Th) (p<0.10) and a decrease trend in OTh (p<0.10) (Table 2). Bone resorption (OcS/BS) and bone formation indicators (OV/BV, OS/BS) did not change (Table 2), suggesting that the changes in bone physiology did not alter the number of osteoclasts or osteoblasts in the bone. These data suggest that although number of osteoclasts and osteoblasts did not change in MR mice, osteoblast function may be attenuated, but not in osteoclasts.
Table 2.
Static histomorphometry of bones from 3-week-old male C57B6/J mice on MR diet for 5 weeks.
| CF
|
MR
|
|||||||
|---|---|---|---|---|---|---|---|---|
| mean | SD | n | mean | SD | n | |||
| BV/TV (%) | 18.6 | ± | 4.6 | 8 | 15.6 | ± | 2.5 | 7 |
| OV/TV (%) | 1.17 | ± | 0.29 | 8 | 0.937 | ± | 0.31 | 7 |
| OV/BV (%) | 6.42 | ± | 1.6 | 8 | 5.92 | ± | 1.5 | 7 |
| BS/BV (%) | 60.8 | ± | 6.5 | 8 | 66.9 | ± | 5.6ф | 7 |
| OS/BS (%) | 27.5 | ± | 5.1 | 8 | 26.2 | ± | 4.6 | 7 |
| ObS/BS (%) | 15.3 | ± | 3.8 | 8 | 14 | ± | 2.1 | 7 |
| ObS/OS (%) | 55.5 | ± | 5.8 | 8 | 54.7 | ± | 10 | 7 |
| OcS/BS (%) | 5.69 | ± | 1.8 | 8 | 7.32 | ± | 2 | 7 |
| TbTh (μm) | 33.3 | ± | 3.9 | 8 | 30.1 | ± | 2.4ф | 7 |
| OTh (μm) | 3.79 | ± | 0.44 | 8 | 3.35 | ± | 0.38ф | 7 |
| NOb/TAR (1/mm2) | 163 | ± | 40 | 8 | 144 | ± | 32 | 7 |
| NOb/BPm (1/mm) | 14.8 | ± | 3.7 | 8 | 13.8 | ± | 2.3 | 7 |
| NOb/Opm (1/mm) | 53.3 | ± | 5.2 | 8 | 53.9 | ± | 12 | 7 |
| Nob/Obpm (1/mm) | 96.4 | ± | 7.7 | 8 | 98.1 | ± | 8.2 | 7 |
| NOc/TAR(1/mm2) | 19 | ± | 7.1 | 8 | 21.6 | ± | 5.4 | 7 |
| NOc/BPm (1/mm) | 1.71 | ± | 0.64 | 8 | 2.12 | ± | 0.63 | 7 |
| TbSp (μm) | 150 | ± | 28 | 8 | 166 | ± | 31 | 7 |
| TbN (1/mm) | 5.55 | ± | 0.78 | 8 | 5.19 | ± | 0.67 | 7 |
Student unpaired 2-tailed t-test with an alpha=5.0%.
p≤0.10
Dynamic histomorphometry provided further evidence that osteoblast activity was affected. Both BFR/BV and DLS/BS were significantly increased in mice on MR (917 ± 141μm3/μm3/day versus 1140 ± 144 μm3/μm3/day, and 25.7 ± 5.1 % versus 30.5 ± 3.0 %, respectively) (Table 3). Mineral apposition rate (MAR) and OV/BV (indicator of osteoid formation) were not different in mice on the CF or MR diet. These data provides evidence to suggest that mineral apposition rate and osteoid formation were not affected by MR. Bones from mice on MR and CF diet were stained and examined for alkaline phosphatase activity, von Kossa staining, and TRAP staining. TRAP staining of osteoclasts did not appear to be different between CF and MR mice, but there was reduced alkaline phosphatase and von Kossa staining in the MR femurs (Figure 3), indicating that MR affects activity of osteocytes and osteoblasts, and less effect on osteoclasts.
Table 3.
Dynamic histomorphometry on bones from 3-week-old male C57B6/J mice on MR diet for 5 weeks.
| CF
|
MR
|
|||||||
|---|---|---|---|---|---|---|---|---|
| mean | SD | n | mean | SD | n | |||
| BV/TV (%) | 20.9 | ± | 5.1 | 8 | 19.5 | ± | 3.6 | 7 |
| MS/BS (%) | 34.3 | ± | 4.5 | 8 | 37.4 | ± | 2 | 7 |
| MAR (μm) | 1.13 | ± | 0.21 | 8 | 1.18 | ± | 0.1 | 7 |
| BFR/BS (μm3/μm2/d) | 143 | ± | 39 | 8 | 161 | ± | 20 | 7 |
| BFR/BV (μm3/μm3/d) | 917 | ± | 141 | 8 | 1140 | ± | 144** | 7 |
| BFR/TV (mm3/μm3/d) | 192 | ± | 66 | 8 | 223 | ± | 48 | 7 |
| SLS/BS (%) | 17.3 | ± | 12 | 8 | 13.8 | ± | 5.2 | 7 |
| DLS/BS (%) | 25.7 | ± | 5.1 | 8 | 30.5 | ± | 3.0* | 7 |
| IR.L.TH. (μm) | 6.79 | ± | 1.3 | 8 | 7.04 | ± | 0.6 | 7 |
| BFR (%) | 39.2 | ± | 11 | 8 | 44 | ± | 5.5 | 7 |
Student unpaired 2-tailed t-test with an alpha=5.0%.
p≤0.01
p≤0.05,
p≤0.10
Figure 3.
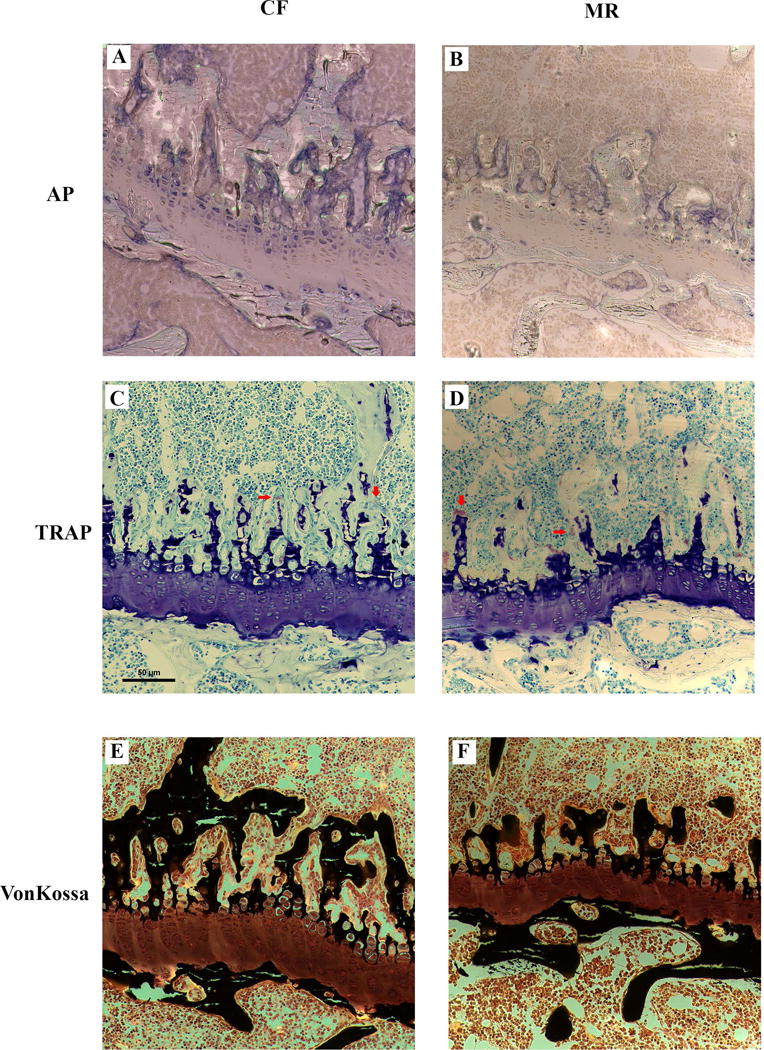
Representative histological sections of a femur growth plate from male mice on CF and MR diet for 5 weeks stained for alkaline phosphatase (AP), Tartrate-resistant acid phosphatase (TRAP), and von Kossa staining for bone tissue. Decreased AP and von Kossa staining were seen in the femurs of MR mice. Red arrows point to osteoclasts. Scale bar = 50 μm.
MR increases bone marrow adiposity in mice
Bone marrow adiposity is associated with aging (31,32) and can correlate to weak bones and inhibition of osteoblast differentiation (33). Young mice were tested on whether bone marrow fat increased in a short 5-week MR diet. Femurs were decalcified and then stained with osmium to detect bone marrow fat and analyzed with micro-CT. Bones were divided into four regions (volume of interest (VOI) VOI1-VOI4 (34)) representing the epiphyseal (VOI1), metaphyseal (VOI2), metaphysic (VOI3), and diaphysis (VOI4) of the long bone and marrow fat was measured by micro-CT. All four regions had increased amounts of fat due to MR diet (p<0.0001; Table 4). Bone marrow was examined for UCP1 expression by RT-PCR, as an indicator of brown-beige fat and was elevated (Figure 5) yet when examined histologically, the adipocytes were unilocular and not multilocular like beige or brown fat which occurs in the visceral fat of MR mice (data not shown).
Table 4.
Bone marrow fat measured by micro-CT in 3-week-old male C57B6/J mice on MR diet for 5 weeks.
| CF
|
MR
|
|||||||
|---|---|---|---|---|---|---|---|---|
| mean | SD | n | mean | SD | n | |||
| Epiphyseal (VOI1) | 0.0353 | ± | 0.028 | 8 | 0.2248 | ± | 0.103** | 8 |
| Metaphyseal (VOI2) | 0.0215 | ± | 0.014 | 8 | 0.3334 | ± | 0.169** | 8 |
| Metaphysis (VOI3) | 0.0088 | ± | 0.007 | 8 | 0.2462 | ± | 0.190** | 8 |
| Diaphysis (VOI4) | 0.0034 | ± | 0.002 | 8 | 0.1582 | ± | 0.134* | 8 |
Two-way ANOVA for overall diet effect was strongly significant (p<0.0001). VOI was trended towards significance (p=0.10).
Figure 5.
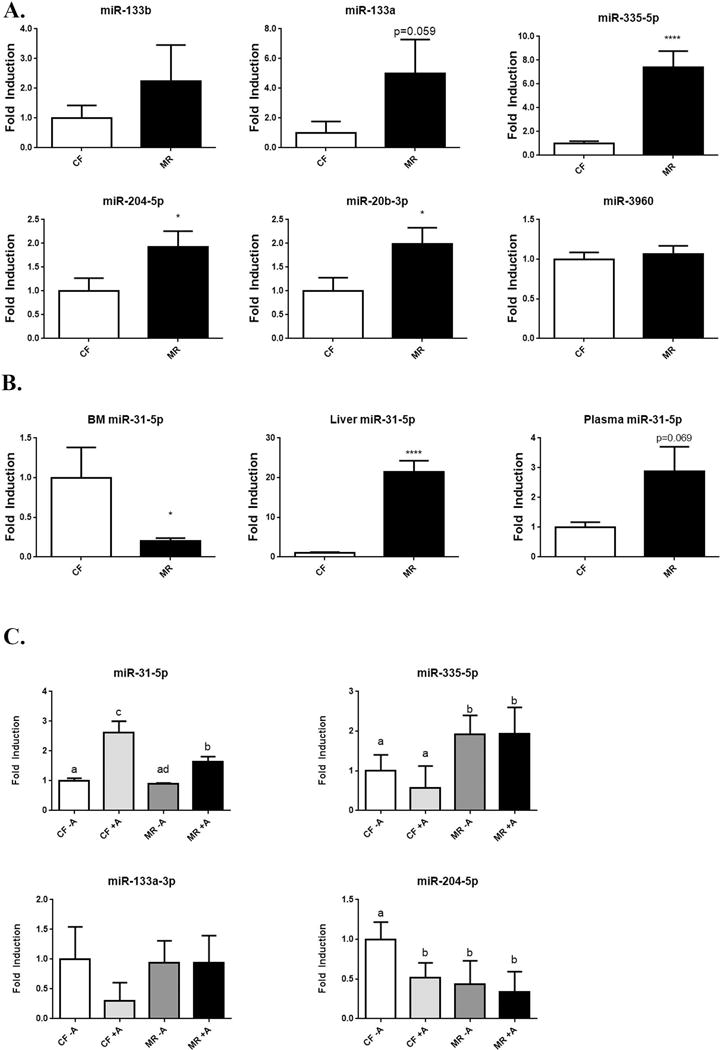
Expression of miRNA from bone marrow in CF and MR mice. RT-PCR of miRNAs that target RUNX2. A. Changes in miRNA expression that can affect osteoblast function and differentiation. N=4/group. B. miR-31-5p expressed in bone marrow (BM), liver, and plasma of mice on CF and MR diet for 5 weeks. N= 4/group in BM, N=8/group in liver, and N=6/group in plasma. Student unpaired 2-tailed t-test with an alpha=5.0%. **** p≤0.0001, * p≤0.05.
Biomechanical properties of bones of mice on MR diet
This micro-CT and histomorphometric data suggest that mice on MR have weaker bones. Four-point bending of femurs was performed on the CF and MR fed mice to test this hypothesis. The length of the femur in mice on MR diet was shorter than femurs from mice on CF diet (p<0.0001). Stiffness (CF, 93.5 ± 13 N/mm vs. MR, 78.6 ± 12 N/mm), Yield Stiffness (CF, 84.1 ± 12 N/mm vs. MR, 70.8 ± 11 N/mm), Total Work (CF, 43.5 ± 4.1 N-mm vs. MR, 20.6 ± 12 N-mm), and Work Post Yield (CF, 3.41 ± 0.97 N-mm vs. MR, 1.88 ± 1.3 N-mm) were significantly decreased in mice on MR diet, demonstrating that the bones were not just weaker but also more brittle.
MR alters gene expression in bone marrow, which may alter osteoblast and osteoclast precursors function
To understand further how MR may alter both osteoprogenitors and precursors of osteoclast differentiation and function, RNA from bone marrow of mice on CF and MR diets were examined by RT-PCR. Bone marrow is comprised of the osteoprogenitors, in addition to the precursors of osteoclasts. Genes involved in osteoblast differentiation, function, and osteogenesis, were examined for changes due to MR diet. During differentiation, osteoblasts secrete collagen1A (COL1A1), which eventually becomes a part of type 1 collagen (35). Gene expression levels of collagen 1A also were not altered in mice on MR. (Figure 4). RUNX2 was decreased by 50%, which would result in decreased differentiation and maturation of osteoprogenitors. Both DMP1 and osteocalcin are proteins involved in the formation of osteoid and mineralized matrix that comprise bone. Decreased levels of DMP1 suggest that osteoblast maturation was hindered and mineralized matrix formation was decreased in mice on MR. Gene expression of osteocalcin (OG1), a non-collagenous protein found in bone, also was diminished in bone marrow of MR mice, further suggesting that the composition of bone from MR mice was compromised (Figure 4).
Figure 4.
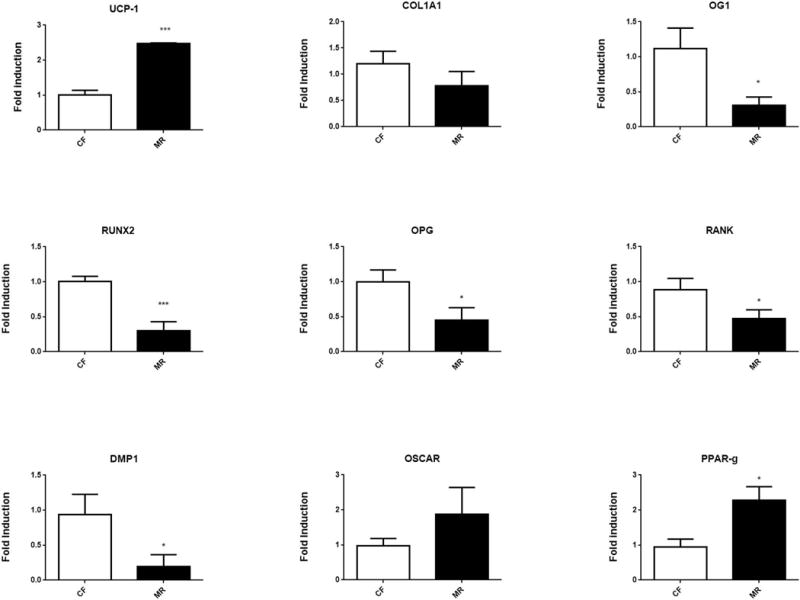
Transcriptional expression of genes involved in osteoblast and osteoclast function detected from bone marrow. RT-PCR was performed on RNA isolated from mice on MR or CF diet for 5 weeks. N=8/group. Student unpaired 2-tailed t-test with an alpha=5.0%. *** p≤0.001, * p≤0.05.
To determine if there were changes in, differentiation and function of precursors of osteoclast, levels of OSCAR, OPG, and Receptor Activator of Nuclear Factor κ B (RANK) were examined. No significant changes in OSCAR expression suggest that initial osteoclast differentiation was not affected. OPG levels were reduced in bone marrow of MR mice suggesting that the release of inhibition of osteoclast differentiation may allow for increased numbers of mature osteoclasts, (Figure 4), however no obvious changes in osteoclasts numbers were seen. RANK ligand (L) binds to RANK, which then binds to TRAF6. TRAF6 stimulates the activation of the c-jun N-terminal kinase (JNK) and nuclear factor kappa-β (NF-kβ) pathways which trigger differentiation and activation of osteoclasts (36). Because RANK expression was decreased in the bone marrow of MR mice, this suggests that osteoclast differentiation was attenuated. The decreased levels of OPG and RANK suggest that the initial differentiation of osteoclasts from progenitor cells was inhibited (Figure 4). However, those osteoclasts that have already differentiated can still function in a MR environment and do not seem to be affected.
The role of PPAR-γ in bone formation and adipogenesis is important to mention in the context of MR. Previously, PPAR-γ was shown to inhibit osteoblast differentiation (37), but it also can promote osteoclast differentiation (38). Increased levels of PPAR-γ occurred in MR mice (Figure 4), which suggested that in our model PPAR-γ could be affecting both populations of cells, resulting in more fragile bones by unbalancing the functions of osteoclasts and osteoblasts in the bone environment.
MR increases miRNAs that target RUNX2 in bone
Recently several miRNAs were reported to alter osteoblast differentiation and function (39). Moreover the effects of MR on miRNA profile in bone are unknown. Using both TargetScan Mouse (Release 6.2, June 2012, http://www.targetscan.org/mmu_61/) and the literature (16,17,20,21,39–41), miRNAs known to affect osteoblast function and target Runx2 expression was examined for changes in the MR mice. MiR-133a, miR-335-5p, miR-204-5p, and miR-20b-3p were elevated in the bone marrow of MR mice, whereas expression levels of miR-3960 and miR-338-3p were not different between CF and MR mice (Figure 5A). Expression of miR-31-5p was decreased in the bone marrow, but it was elevated 2.9 fold in the plasma (p=0.07) and 21 fold (p<0.0001) in the liver of MR mice. These higher levels of miR-31-5p in liver and plasma with the lower levels of miR-31-5p in bone may suggest that a compensatory mechanism exist to maintain levels of miR-31-5p in bone (Figure 5B). One of the downstream targets of miR-31-5p is Satb2, a transcription factor that functions with Runx2 to turn on gene expression to differentiate mesenchymal stem cells to osteoblasts (39). In our experiments, MR did not cause a notable change of Satb2 expression in bone (Figure 6).
Figure 6.
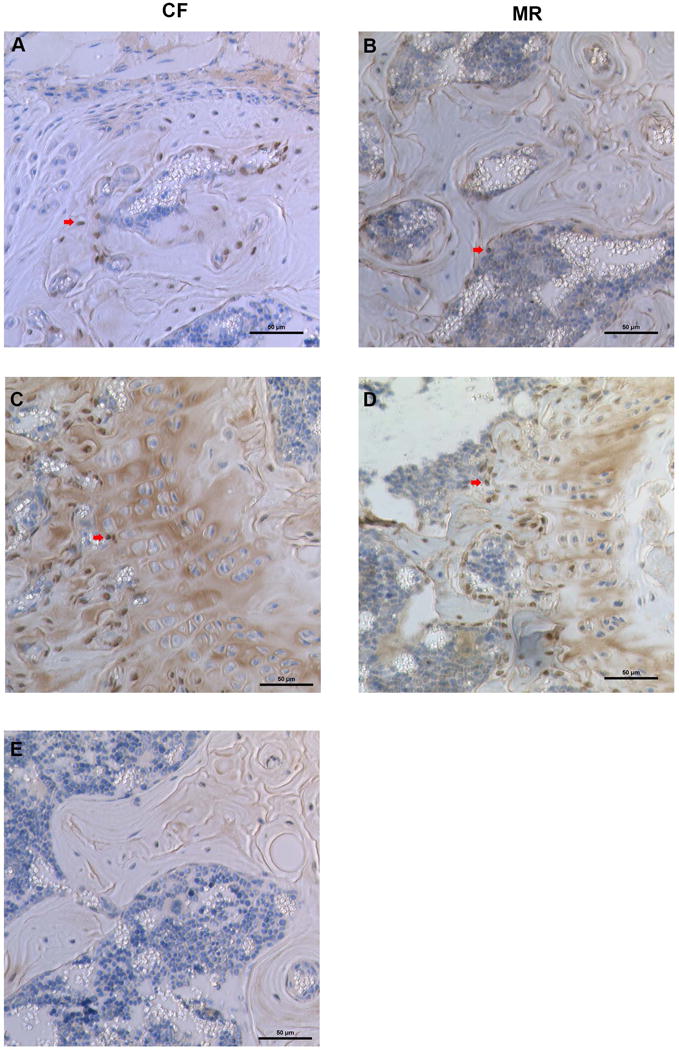
Expression of Satb2 in osteoblasts of mice on CF or MR diet. Arrow points to osteoblasts stained for Satb2. A. and C. are images from bones of mice on CF diet. B. and D. are images from bones of mice on MR diet. A and B are trabecular bone, C and D are images from the growth plate.
Discussion
Rodents on MR diet were shown to have an increased lifespan and improved health (6,9). At least one clinical trial demonstrated that these beneficial effects of MR seen in rodents occurred similarly in humans (42). MR improves health by improving insulin sensitivity and glucose metabolism with reduced accumulation of hepatic triglycerides (12,43), oxidative stress (3,44), and adiposity in many of the depots in the body (45). Although these are wonderful benefits, it is not clear whether all tissues will benefit from MR. Growth restriction was seen in young male rodents on MR (9,10) and mice on MR become hyperhomocysteinemic, which could lead to reduced blood flow in bone and retard growth (15,46,47). In rats and mice, MR was reported to reduce bone mass density and mineral content when compared to bones of CF mice (9,10). In those studies, it was suggested that these losses were due to the over-expression of FGF-21 in the liver (9) and an increase in PPAR-γ that could inhibit osteoblast differentiation and deregulate the function of osteoclasts (13,38).
In this study, mice on MR diet were examined for physiological, transcriptional, and epigenetic changes in bone. As seen in previous studies, male mice on MR had both reduced growth and weight (Figure 1). Bones were examined by micro-CT confirmed that both trabecular and cortical bone volume (BV) were reduced (Table 1) and Trabecular thickness (Tb.Th) and number (Tb.N) were significantly reduced on MR diet. Bone microarchitecture by static histomorphometry revealed reduced trabecular thickness (Table 2); however, measured dynamic histomorphometry suggest that bone formation rate was increased in mice on MR (Table 3). Using a combination of osmium labeling and micro-CT, marrow adipocytes were examined in the femurs of mice on CF and MR diets. A significant increase in bone marrow fat was measured in all four regions of the femurs (Table 4). Additionally, bone strength, measured using 4-point bending, demonstrated that mice on MR were less stiff and more fragile in bones than the control mice (Table 5). It remains to be determined whether the bone marrow fat was related to the fragility of the bones, or whether it was just coincidence that MR bones contained more fat and had increased fragility.
Table 5.
Four-point bending of femurs from 3-week-old male C57B6/J mice on MR diet for 5 weeks.
| CF
|
MR
|
|||||||
|---|---|---|---|---|---|---|---|---|
| mean | SD | n | mean | SD | n | |||
| Femur length [mm] | 14.5 | ± | 0.66 | 8 | 11.6 | ± | 0.58**** | 5 |
| Stiffness [N/mm] | 93.5 | ± | 13 | 8 | 78.6 | ± | 12*** | 5 |
| Yield Stiffness [N/mm] | 84.1 | ± | 12 | 8 | 70.8 | ± | 11** | 5 |
| Max Load [N] | 20.7 | ± | 3.4 | 8 | 14.2 | ± | 2.0 | 5 |
| Yield Load [N] | 13.6 | ± | 2.0 | 8 | 8.75 | ± | 2.5 | 5 |
| Fracture Load [N] | 16.6 | ± | 3.5 | 8 | 10.6 | ± | 2.4 | 5 |
| Post-yield Deflection [mm] | 0.691 | ± | 0.10 | 8 | 0.445 | ± | 0.19 | 5 |
| Disp at Yield [mm] | 0.159 | ± | 0.03 | 8 | 0.122 | ± | 0.04 | 5 |
| Disp at Fx [mm] | 0.849 | ± | 0.11 | 8 | 0.566 | ± | 0.21 | 5 |
| Disp at Max Load [mm] | 0.406 | ± | 0.14 | 8 | 0.422 | ± | 0.17 | 5 |
| Total Work [N-mm] | 43.5 | ± | 4.1 | 8 | 20.6 | ± | 12**** | 5 |
| Work to Yield [N-mm] | 3.41 | ± | 0.97 | 8 | 1.88 | ± | 1.3 | 5 |
| Work Post-yield [N-mm] | 40.1 | ± | 3.7 | 8 | 18.7 | ± | 11**** | 5 |
Two-way ANOVA with Sidak multiple comparison test.
p≤0.0001,
p≤0.001,
p≤0.01,
p≤0.05.
Both bone biomarkers in plasma (Figure 2) and gene expression in bone marrow (Figure 4) were examined to determine whether the key regulators of osteoblast and osteoclast function and differentiation are altered in the plasma and bone marrow of mice on MR diet. Although osteocalcin and OPG protein levels were not changed in the plasma, there was a reduction in PINP (p<0.05) and sclerostin (p<0.05) in the plasma of MR mice (Figure 2), suggesting that osteocyte activity was attenuated. In bone marrow the osteoclast regulator, OSCAR, did not change, whereas RANK and OPG, which induce osteoclast activity through the RANK/RANKL/OPG pathway, were reduced in MR mice (Figure 4). RUNX2 and OG1 that regulate osteoblast differentiation and function were reduced (Figure 4). These changes suggest that the effects of MR on gene expression are targeting the osteoprogenitor cell population, and this could indicate that these cells are more sensitive to MR. In a preliminary experiment, primary cultures from bone marrow of MR mice were cultured and treated to differentiate them into osteocytes or osteoclasts after 10 days. However, removing cells from the MR environment resulted in rapid reversal of the MR phenotype in osteoblast or osteoclast differentiation (data not shown). Therefore, experiments were limited to examining osteoprogenitor cells derived from bone marrow of MR mice at the time of sacrifice to examine the gene expression changes.
Nutrient status affects the activity of one-carbon metabolism, which includes both the folate and methionine cycles that generate S-adenosylmethionine (SAM) (48). The methionine cycle generates SAM, which DNA methyltransferases use to transfer the methyl group to histones that can epigenetically regulate gene expression by methylation. Changes in nutrient status can correspond with epigenetic changes, such as methylation (48) or miRNAs (49), but in bone little is known about these epigenetic changes. Because MR clearly reduced levels of RUNX2, we examined whether miRNAs that target RUNX2, and could affect osteoblast differentiation and function, were altered in the MR mice. Interestingly, several of the miRNAs (miR-133a, miR-335-5p, miR-204-5p, and miR-20b-3) that can target RUNX2 (20,39,50) were increased in the MR bone environment (Figure 5). Our working model is that the affect of MR on bone was in part due to the elevated levels of miRNAs that inhibit RUNX2 expression and therefore inhibits osteoblast differentiation and function (Figure 7). In summary, the affect of MR on young bones was most pronounced by hindering osteoprogenitors differentiation. The increased levels of miRNAs that target osteoprogenitor differentiation and function prevent these cells from forming bone efficiently (Figure 7). Osteoclast function was changed minimally by MR, suggesting that there was an imbalance occurring between osteoblast and osteoclast function in MR mice resulting in more fragile bones. In conclusion, the effect on bone by MR was exacerbated in younger animals, the potential use of MR to improve metabolism in adult animals is still advantageous, where effects of MR on bone are minimal.
Figure 7.
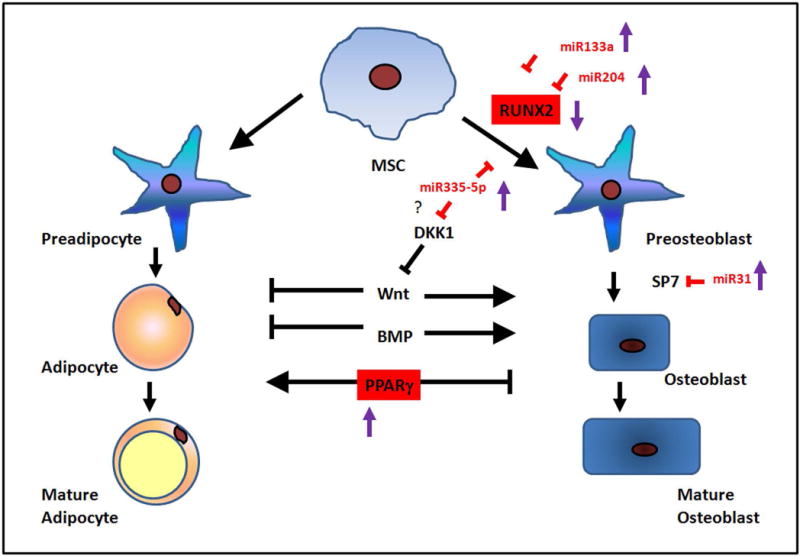
Summary model of MR affecting proteins and miRNAs involved in osteoblast function and differentiation. MR mice have reduced expression of RUNX2 and increased levels of PPARγ. MiR-133a, miR-204, and miR-335-5p were increased and inhibited the differentiation of mesenchymal stem cells (MSC) to preosteoblasts. MiR-31-5p can inhibit the transcription factor SP7 and prevent differentiation of preosteoblasts to osteoblasts. Red labeling and squares indicate proteins and miRNAs changed in MR mice.
Supplementary Material
Figure Abbreviations
- AP
alkaline phosphatase
- CF
control fed
- MR
dietary methionine restriction
- TRAP
Tartrate-resistant acid phosphatase
References
- 1.Brown-Borg HM, Rakoczy S, Wonderlich JA, Armstrong V, Rojanathammanee L. Altered dietary methionine differentially impacts glutathione and methionine metabolism in long-living growth hormone-deficient Ames dwarf and wild-type mice. Longev Healthspan. 2014;3(1):10. doi: 10.1186/2046-2395-3-10. [DOI] [PMC free article] [PubMed] [Google Scholar]
- 2.Cabreiro F, Au C, Leung KY, Vergara-Irigaray N, Cocheme HM, Noori T, et al. Metformin retards aging in C. elegans by altering microbial folate and methionine metabolism. Cell. 2013;153(1):228–39. doi: 10.1016/j.cell.2013.02.035. [DOI] [PMC free article] [PubMed] [Google Scholar]
- 3.Johnson JE, Johnson FB. Methionine restriction activates the retrograde response and confers both stress tolerance and lifespan extension to yeast, mouse and human cells. PloS one. 2014;9(5):e97729. doi: 10.1371/journal.pone.0097729. [DOI] [PMC free article] [PubMed] [Google Scholar]
- 4.Lee BC, Kaya A, Ma S, Kim G, Gerashchenko MV, Yim SH, et al. Methionine restriction extends lifespan of Drosophila melanogaster under conditions of low amino-acid status. Nature communications. 2014;5:3592. doi: 10.1038/ncomms4592. [DOI] [PMC free article] [PubMed] [Google Scholar]
- 5.Miller RA, Buehner G, Chang Y, Harper JM, Sigler R, Smith-Wheelock M. Methionine-deficient diet extends mouse lifespan, slows immune and lens aging, alters glucose, T4, IGF-I and insulin levels, and increases hepatocyte MIF levels and stress resistance. Aging cell. 2005;4(3):119–25. doi: 10.1111/j.1474-9726.2005.00152.x. [DOI] [PMC free article] [PubMed] [Google Scholar]
- 6.Orentreich N, Matias JR, DeFelice A, Zimmerman JA. Low methionine ingestion by rats extends life span. The Journal of nutrition. 1993;123(2):269–74. doi: 10.1093/jn/123.2.269. [DOI] [PubMed] [Google Scholar]
- 7.Richie JP, Jr, Leutzinger Y, Parthasarathy S, Malloy V, Orentreich N, Zimmerman JA. Methionine restriction increases blood glutathione and longevity in F344 rats. FASEB journal: official publication of the Federation of American Societies for Experimental Biology. 1994;8(15):1302–7. doi: 10.1096/fasebj.8.15.8001743. [DOI] [PubMed] [Google Scholar]
- 8.Ruckenstuhl C, Netzberger C, Entfellner I, Carmona-Gutierrez D, Kickenweiz T, Stekovic S, et al. Lifespan extension by methionine restriction requires autophagy-dependent vacuolar acidification. PLoS Genet. 2014;10(5):e1004347. doi: 10.1371/journal.pgen.1004347. [DOI] [PMC free article] [PubMed] [Google Scholar]
- 9.Ables GP, Perrone CE, Orentreich D, Orentreich N. Methionine-restricted C57BL/6J mice are resistant to diet-induced obesity and insulin resistance but have low bone density. PloS one. 2012;7(12):e51357. doi: 10.1371/journal.pone.0051357. [DOI] [PMC free article] [PubMed] [Google Scholar]
- 10.Huang TH, Lewis JL, Lin HS, Kuo LT, Mao SW, Tai YS, et al. A methionine-restricted diet and endurance exercise decrease bone mass and extrinsic strength but increase intrinsic strength in growing male rats. The Journal of nutrition. 2014;144(5):621–30. doi: 10.3945/jn.113.187922. [DOI] [PubMed] [Google Scholar]
- 11.Zhang Y, Xie Y, Berglund ED, Coate KC, He TT, Katafuchi T, et al. The starvation hormone, fibroblast growth factor-21, extends lifespan in mice. Elife. 2012;1:e00065. doi: 10.7554/eLife.00065. [DOI] [PMC free article] [PubMed] [Google Scholar]
- 12.Perrone CE, Mattocks DA, Plummer JD, Chittur SV, Mohney R, Vignola K, et al. Genomic and metabolic responses to methionine-restricted and methionine-restricted, cysteine-supplemented diets in Fischer 344 rat inguinal adipose tissue, liver and quadriceps muscle. Journal of nutrigenetics and nutrigenomics. 2012;5(3):132–57. doi: 10.1159/000339347. [DOI] [PubMed] [Google Scholar]
- 13.Wei W, Dutchak PA, Wang X, Ding X, Wang X, Bookout AL, et al. Fibroblast growth factor 21 promotes bone loss by potentiating the effects of peroxisome proliferator-activated receptor gamma. Proceedings of the National Academy of Sciences of the United States of America. 2012;109(8):3143–8. doi: 10.1073/pnas.1200797109. [DOI] [PMC free article] [PubMed] [Google Scholar]
- 14.Elshorbagy AK, Valdivia-Garcia M, Refsum H, Smith AD, Mattocks DA, Perrone CE. Sulfur amino acids in methionine-restricted rats: hyperhomocysteinemia. Nutrition. 2010;26(11–12):1201–4. doi: 10.1016/j.nut.2009.09.017. [DOI] [PubMed] [Google Scholar]
- 15.Tyagi N, Kandel M, Munjal C, Qipshidze N, Vacek JC, Pushpakumar SB, et al. Homocysteine mediated decrease in bone blood flow and remodeling: role of folic acid. Journal of orthopaedic research: official publication of the Orthopaedic Research Society. 2011;29(10):1511–6. doi: 10.1002/jor.21415. [DOI] [PMC free article] [PubMed] [Google Scholar]
- 16.Lian JB, Stein GS, van Wijnen AJ, Stein JL, Hassan MQ, Gaur T, et al. MicroRNA control of bone formation and homeostasis. Nat Rev Endocrinol. 2012;8(4):212–27. doi: 10.1038/nrendo.2011.234. [DOI] [PMC free article] [PubMed] [Google Scholar]
- 17.Zhao X, Xu D, Li Y, Zhang J, Liu T, Ji Y, et al. MicroRNAs regulate bone metabolism. J Bone Miner Metab. 2014;32(3):221–31. doi: 10.1007/s00774-013-0537-7. [DOI] [PubMed] [Google Scholar]
- 18.Hassan MQ, Maeda Y, Taipaleenmaki H, Zhang W, Jafferji M, Gordon JA, et al. miR-218 directs a Wnt signaling circuit to promote differentiation of osteoblasts and osteomimicry of metastatic cancer cells. The Journal of biological chemistry. 2012;287(50):42084–92. doi: 10.1074/jbc.M112.377515. [DOI] [PMC free article] [PubMed] [Google Scholar]
- 19.Hu R, Li H, Liu W, Yang L, Tan YF, Luo XH. Targeting miRNAs in osteoblast differentiation and bone formation. Expert Opin Ther Targets. 2010;14(10):1109–20. doi: 10.1517/14728222.2010.512916. [DOI] [PubMed] [Google Scholar]
- 20.Pi C, Li YP, Zhou X, Gao B. The expression and function of microRNAs in bone homeostasis. Front Biosci (Landmark Ed) 2015;20:119–38. doi: 10.2741/4301. [DOI] [PubMed] [Google Scholar]
- 21.Zhang J, Tu Q, Bonewald LF, He X, Stein G, Lian J, et al. Effects of miR-335–5p in modulating osteogenic differentiation by specifically downregulating Wnt antagonist DKK1. J Bone Miner Res. 2011;26(8):1953–63. doi: 10.1002/jbmr.377. [DOI] [PMC free article] [PubMed] [Google Scholar]
- 22.Zhang Y, Xie RL, Gordon J, LeBlanc K, Stein JL, Lian JB, et al. Control of mesenchymal lineage progression by microRNAs targeting skeletal gene regulators Trps1 and Runx2. The Journal of biological chemistry. 2012;287(26):21926–35. doi: 10.1074/jbc.M112.340398. [DOI] [PMC free article] [PubMed] [Google Scholar]
- 23.Tang P, Xiong Q, Ge W, Zhang L. The role of microRNAs in osteoclasts and osteoporosis. RNA Biol. 2014;11(11):1355–63. doi: 10.1080/15476286.2014.996462. [DOI] [PMC free article] [PubMed] [Google Scholar]
- 24.Parfitt AM, Drezner MK, Glorieux FH, Kanis JA, Malluche H, Meunier PJ, et al. Bone histomorphometry: standardization of nomenclature, symbols, and units. Report of the ASBMR Histomorphometry Nomenclature Committee. J Bone Miner Res. 1987;2(6):595–610. doi: 10.1002/jbmr.5650020617. [DOI] [PubMed] [Google Scholar]
- 25.Ye J, Coulouris G, Zaretskaya I, Cutcutache I, Rozen S, Madden TL. Primer-BLAST: a tool to design target-specific primers for polymerase chain reaction. BMC bioinformatics. 2012;13:134. doi: 10.1186/1471-2105-13-134. [DOI] [PMC free article] [PubMed] [Google Scholar]
- 26.Livak KJ, Schmittgen TD. Analysis of relative gene expression data using real-time quantitative PCR and the 2(-Delta Delta C(T)) Method. Methods. 2001;25(4):402–8. doi: 10.1006/meth.2001.1262. [DOI] [PubMed] [Google Scholar]
- 27.Koivula MK, Risteli L, Risteli J. Measurement of aminoterminal propeptide of type I procollagen (PINP) in serum. Clinical biochemistry. 2012;45(12):920–7. doi: 10.1016/j.clinbiochem.2012.03.023. [DOI] [PubMed] [Google Scholar]
- 28.Li X, Zhang Y, Kang H, Liu W, Liu P, Zhang J, et al. Sclerostin binds to LRP5/6 and antagonizes canonical Wnt signaling. The Journal of biological chemistry. 2005;280(20):19883–7. doi: 10.1074/jbc.M413274200. [DOI] [PubMed] [Google Scholar]
- 29.Udagawa N, Takahashi N, Yasuda H, Mizuno A, Itoh K, Ueno Y, et al. Osteoprotegerin produced by osteoblasts is an important regulator in osteoclast development and function. Endocrinology. 2000;141(9):3478–84. doi: 10.1210/endo.141.9.7634. [DOI] [PubMed] [Google Scholar]
- 30.Zhou B, Liu XS, Wang J, Lu XL, Fields AJ, Guo XE. Dependence of mechanical properties of trabecular bone on plate-rod microstructure determined by individual trabecula segmentation (ITS) J Biomech. 2014;47(3):702–8. doi: 10.1016/j.jbiomech.2013.11.039. [DOI] [PMC free article] [PubMed] [Google Scholar]
- 31.Breault SR, Heye T, Bashir MR, Dale BM, Merkle EM, Reiner CS, et al. Quantitative dynamic contrast-enhanced MRI of pelvic and lumbar bone marrow: effect of age and marrow fat content on pharmacokinetic parameter values. AJR American journal of roentgenology. 2013;200(3):W297–303. doi: 10.2214/AJR.12.9080. [DOI] [PubMed] [Google Scholar]
- 32.Roldan-Valadez E, Pina-Jimenez C, Favila R, Rios C. Gender and age groups interactions in the quantification of bone marrow fat content in lumbar spine using 3T MR spectroscopy: a multivariate analysis of covariance (Mancova) Eur J Radiol. 2013;82(11):e697–702. doi: 10.1016/j.ejrad.2013.07.012. [DOI] [PubMed] [Google Scholar]
- 33.de Paula FJ, de Araujo IM, Carvalho AL, Elias J, Jr, Salmon CE, Nogueira-Barbosa MH. The Relationship of Fat Distribution and Insulin Resistance with Lumbar Spine Bone Mass in Women. PloS one. 2015;10(6):e0129764. doi: 10.1371/journal.pone.0129764. [DOI] [PMC free article] [PubMed] [Google Scholar]
- 34.Scheller EL, Troiano N, Vanhoutan JN, Bouxsein MA, Fretz JA, Xi Y, et al. Use of osmium tetroxide staining with microcomputerized tomography to visualize and quantify bone marrow adipose tissue in vivo. Methods in enzymology. 2014;537:123–39. doi: 10.1016/B978-0-12-411619-1.00007-0. [DOI] [PMC free article] [PubMed] [Google Scholar]
- 35.Wei J, Shimazu J, Makinistoglu MP, Maurizi A, Kajimura D, Zong H, et al. Glucose Uptake and Runx2 Synergize to Orchestrate Osteoblast Differentiation and Bone Formation. Cell. 2015;161(7):1576–91. doi: 10.1016/j.cell.2015.05.029. [DOI] [PMC free article] [PubMed] [Google Scholar]
- 36.Ikeda F, Nishimura R, Matsubara T, Tanaka S, Inoue J, Reddy SV, et al. Critical roles of c-Jun signaling in regulation of NFAT family and RANKL-regulated osteoclast differentiation. The Journal of clinical investigation. 2004;114(4):475–84. doi: 10.1172/JCI19657. [DOI] [PMC free article] [PubMed] [Google Scholar]
- 37.Wahli W. PPAR gamma: ally and foe in bone metabolism. Cell metabolism. 2008;7(3):188–90. doi: 10.1016/j.cmet.2008.02.005. [DOI] [PubMed] [Google Scholar]
- 38.Wan Y, Chong LW, Evans RM. PPAR-gamma regulates osteoclastogenesis in mice. Nat Med. 2007;13(12):1496–503. doi: 10.1038/nm1672. [DOI] [PubMed] [Google Scholar]
- 39.Deng Y, Wu S, Zhou H, Bi X, Wang Y, Hu Y, et al. Effects of a miR-31, Runx2, and Satb2 regulatory loop on the osteogenic differentiation of bone mesenchymal stem cells. Stem Cells Dev. 2013;22(16):2278–86. doi: 10.1089/scd.2012.0686. [DOI] [PubMed] [Google Scholar]
- 40.Liu H, Sun Q, Wan C, Li L, Zhang L, Chen Z. MicroRNA-338–3p regulates osteogenic differentiation of mouse bone marrow stromal stem cells by targeting Runx2 and Fgfr2. Journal of cellular physiology. 2014;229(10):1494–502. doi: 10.1002/jcp.24591. [DOI] [PubMed] [Google Scholar]
- 41.Zhang Y, Xie RL, Croce CM, Stein JL, Lian JB, van Wijnen AJ, et al. A program of microRNAs controls osteogenic lineage progression by targeting transcription factor Runx2. Proceedings of the National Academy of Sciences of the United States of America. 2011;108(24):9863–8. doi: 10.1073/pnas.1018493108. [DOI] [PMC free article] [PubMed] [Google Scholar]
- 42.Epner DE, Morrow S, Wilcox M, Houghton JL. Nutrient intake and nutritional indexes in adults with metastatic cancer on a phase I clinical trial of dietary methionine restriction. Nutrition and cancer. 2002;42(2):158–66. doi: 10.1207/S15327914NC422_2. [DOI] [PubMed] [Google Scholar]
- 43.Plaisance EP, Greenway FL, Boudreau A, Hill KL, Johnson WD, Krajcik RA, et al. Dietary methionine restriction increases fat oxidation in obese adults with metabolic syndrome. The Journal of clinical endocrinology and metabolism. 2011;96(5):E836–40. doi: 10.1210/jc.2010-2493. [DOI] [PMC free article] [PubMed] [Google Scholar]
- 44.Caro P, Gomez J, Sanchez I, Garcia R, Lopez-Torres M, Naudi A, et al. Effect of 40% restriction of dietary amino acids (except methionine) on mitochondrial oxidative stress and biogenesis, AIF and SIRT1 in rat liver. Biogerontology. 2009;10(5):579–92. doi: 10.1007/s10522-008-9200-4. [DOI] [PubMed] [Google Scholar]
- 45.Lees EK, Krol E, Grant L, Shearer K, Wyse C, Moncur E, et al. Methionine restriction restores a younger metabolic phenotype in adult mice with alterations in fibroblast growth factor 21. Aging cell. 2014;13(5):817–27. doi: 10.1111/acel.12238. [DOI] [PMC free article] [PubMed] [Google Scholar]
- 46.Kalani A, Kamat PK, Voor MJ, Tyagi SC, Tyagi N. Mitochondrial epigenetics in bone remodeling during hyperhomocysteinemia. Molecular and cellular biochemistry. 2014;395(1–2):89–98. doi: 10.1007/s11010-014-2114-3. [DOI] [PMC free article] [PubMed] [Google Scholar]
- 47.Vijayan V, Khandelwal M, Manglani K, Singh RR, Gupta S, Surolia A. Homocysteine alters the osteoprotegerin/RANKL system in the osteoblast to promote bone loss: pivotal role of the redox regulator forkhead O1. Free radical biology & medicine. 2013;61:72–84. doi: 10.1016/j.freeradbiomed.2013.03.004. [DOI] [PubMed] [Google Scholar]
- 48.Mentch SJ, Locasale JW. One-carbon metabolism and epigenetics: understanding the specificity. Ann N Y Acad Sci. 2015 doi: 10.1111/nyas.12956. [DOI] [PMC free article] [PubMed] [Google Scholar]
- 49.Beckett EL, Martin C, Choi JH, King K, Niblett S, Boyd L, et al. Folate status, folate-related genes and serum miR-21 expression: Implications for miR-21 as a biomarker. BBA Clin. 2015;4:45–51. doi: 10.1016/j.bbacli.2015.06.006. [DOI] [PMC free article] [PubMed] [Google Scholar]
- 50.Gao J, Yang T, Han J, Yan K, Qiu X, Zhou Y, et al. MicroRNA expression during osteogenic differentiation of human multipotent mesenchymal stromal cells from bone marrow. Journal of cellular biochemistry. 2011;112(7):1844–56. doi: 10.1002/jcb.23106. [DOI] [PubMed] [Google Scholar]
Associated Data
This section collects any data citations, data availability statements, or supplementary materials included in this article.