Abstract
Monocarboxylate transporters (MCTs) belong to the SLC16 family within the major facilitator superfamily of transmembrane transporters. MCT8 is a thyroid hormone transporter mutated in the Allan-Herndon-Dudley syndrome, a severe psychomotor retardation syndrome. MCT10 is closely related to MCT8 and is known as T-type amino acid transporter. Both transporters mediate T3 transport, but although MCT8 also transports rT3 and T4, these compounds are not efficiently transported by MCT10, which, in contrast, transports aromatic amino acids. Based on the 58% amino acid identity within the transmembrane regions among MCT8 and MCT10, we reasoned that substrate specificity may be primarily determined by a small number of amino acid differences between MCT8 and MCT10 along the substrate translocation channel. Inspecting the homology model of MCT8 and a structure-guided alignment between both proteins, we selected 8 amino acid positions and prepared chimeric MCT10 proteins with selected amino acids changed to the corresponding amino acids in MCT8. The MCT10 mutant harboring 8 amino acid substitutions was stably expressed in Madin-Darby canine kidney 1 cells and found to exhibit T4 transport activity. We then successively reduced the number of amino acid substitutions and eventually identified a minimal set of 2–3 amino acid exchanges which were sufficient to allow T4 transport. The resulting MCT10 chimeras exhibited KM values for T4 similar to MCT8 but transported T4 at a slower rate. The acquisition of T4 transport by MCT10 was associated with complete loss of the capacity to transport Phe, when Tyr184 was mutated to Phe.
Monocarboxylate transporter (MCT)8 (SLC16A2) (1) is a transmembrane transport protein of the major facilitator superfamily (MFS) and mediates import and export of iodothyronines across the plasma membrane (1). Mutations in MCT8 lead to the Allan-Herndon-Dudley syndrome (OMIM 300523), a severe X-linked psychomotor retardation syndrome (2–5). This finding has renewed interest in the transporter molecules that mediate thyroid hormone uptake across cellular membranes (6). The first thyroid hormone transporter identified was organic anion-transporting polypeptide (Oatp)3 (7) followed by Oatp1 (8) both belonging to organic anion transporting polypeptide subfamily of MFS. A closely related transporter is Oatp14 (Slco1c1), which selectively transports T4 and is expressed along the blood-brain barrier (9). L-type amino acid transporters were also found to transport thyroid hormones (10, 11). The T-type amino acid transporter (TAT1), also known as MCT10 (SLC16A10), is a very good T3, but less active T4, transporter (12). Finally, the liver-specific sodium-taurocholate transporting polypeptide (Slc10a1) was also found to transport thyroid hormones (8) but belongs to an entirely different class of transporters.
Several gene families have evolved the ability to bind or transport thyroid hormones. We are interested in the question whether they converged on one way to recognize the ligand or whether there are fundamentally different ways to transport thyroid hormones across the membrane (13). There is no experimental structure for any of these thyroid hormone transporters. Homology models have been generated for Oatp14, MCT8, L-type amino acid transporters (Lat)1, and Lat2 (14–17). We have been trying to delineate the ligand-protein interactions in MCT8 and identified several amino acids which are involved in transport activity. We first focused on charged amino acids within the transmembrane region and suggested a role in transport for Arg445 and Asp498 (15). Both amino acids are mutated in patients (18, 19), and their potential interaction has been subsequently confirmed by others (20). We then noted that, in analogy to binding the ligand in the T3 receptor, thyroid hormone may fit between His and Arg pairs spaced about 15 Å apart in MCT8 (21). Binding of thyroid hormones to their various binding proteins is mediated mainly by hydrophobic pockets and few polar interactions (22). A role for His192 in T3 uptake by MCT8 was independently confirmed (23), and a His likely plays a role in thyroid hormone binding in deiodinases (24). Taken together, these results suggest that our homology model allows to make reasonably good predictions about possible roles of individual amino acids in MCT8.
MFS transporters exhibit a central substrate translocation channel formed by the surface of 2 6-helix bundles which are comprised of transmembrane helix (TMH)1–TMH6 and TMH7–TMH12 (25). In order to more precisely locate amino acids participating in substrate transport, we chose to compare MCT8 and MCT10 and relate differences in amino acids along the proposed substrate translocation channel with substrate specificity of the 2 proteins. MCT8 and MCT10 share 58% amino acid identity within the transmembrane regions (12). Both transporters mediate T3 uptake, but MCT8 is a much better T4 transporter, whereas MCT10 (SLC16A10) is not good at transporting T4 but is capable of aromatic amino acid uptake (26). Based on the homology model of MCT8, a set of 8 amino acid positions along the substrate translocation channel of MCT10 was chosen and all amino acids were exchanged to the corresponding amino acids present in MCT8 yielding a chimeric MCT10x8 protein. Because this mutant protein was capable of T4 uptake with similar characteristics as MCT8, we tried to identify the minimal set of amino acid positions required to allow chimeric MCT10 uptake of T4. We show here that exchange of a minimal set of 3 amino acids in MCT10 is sufficient to make MCT10x3 an active T4 transporter, and 2 proteins with double mutations achieved T4 uptake, albeit at lower rates. Aromatic amino acid uptake by MCT10 mutants capable of T4 transport was generally reduced and entirely abrogated in those MCT10 chimeras that contained the Y184F exchange.
Materials and Methods
Cell culture
Stably transfected Madin-Darby canine kidney (MDCK1) cells were cultured in DMEM/F12 (1:1) (GIBCO) + 10% fetal calf serum (GIBCO) + 1% penicillin (5000 U/mL)/streptomycin (5000 μg/mL). Two days before the experiments, 50 000–70 000 cells per well were seeded into 24-well plates. One day before the experiment, a medium change to DMEM/F12 without serum was performed in order to prevent competition with amino acids or iodothyronines present in serum.
Site-directed mutagenesis
Mutations for creating MCT10MCT8 chimeras were introduced in human MCT10 using QuikChange Lightning Site-Directed Mutagenesis kit (Agilent Technologies) with primers given in Table 1. Plasmids were stably transfected into MDCK1 cells as described previously (27).
Table 1.
Oligonucleotide Sequences Used to Introduce Amino Acid Exchanges in MCT10
| Q88H | Q88Hfwd 5′-GTGTTCGGCATCCATAACGCTTGCGGGGT-3′ |
| Q88Hrev 5′-ACCCCGCAAGCGTTATGGATGCCGAACAC-3′ | |
| A90S | A90Sfwd 5′-GGTGTTCGGCATCCAGAACTCTTGCGGGGTGCTCTTCGTGTCC-3′ |
| A90Srev 5′-GGACACGAAGAGCACCCCGCAAGAGTTCTGGATGCCGAACACC-3′ | |
| V93I | V93Ifwd 5′-CCAGAACGCTTGCGGGATCCTCTTCGTGTCCATGCTGG-3′ |
| V93Irev 5′-CCAGCATGGACACGAAGAGGATCCCGCAAGCGTTCTGG-3′ | |
| S121A | S121Afwd 5′-CATGGGTAGGTTCTCTCGCCATGGGGATGATTTTC-3′ |
| S121Arev 5′-GAAAATCATCCCCATGGCGAGAGAACCTACCCATG-3′ | |
| Y184F | Y184Ffwd 5′-GGCTGCTCCTTTGCATTCCAGCCTTCATTGG-3′ |
| Y184Frev 5′-CCAATGAAGGCTGGAATGCAAAGGAGCAGCC-3′ | |
| T207S | T207Sfwd 5′-GGTGAATGGCATTGTCTCTGCTGGCAGCAGTGTCTTCAC-3′ |
| T207Srev 5′-GTGAAGACACTGCTGCCAGCAGAGACAATGCCATTCACC-3′ | |
| H317Y | H317Yfwd 5′-TGTGCCTTATGTTCACTTGATGAAATATGTAAATGAAAGATTTCAAGATG-3′ |
| H317Yrev5′-CATCTTGAAATCTTTCATTTACATATTTCATCAAGTGAACATAAGGCACA-3′ | |
| E325I | E325Ifwd 5′-GATGAAACATGTAAATGAAAGATTTCAAGATATAAAAAATAAAGAGGTTGTTCTCATGTGCATT-3′ |
| E325Irev 5′-AATGCACATGAGAACAACCTCTTTATTTTTTATATCTTGAAATCTTTCATTTACATGTTTCATC-3′ |
Surface biotinylation and Western blotting
Surface biotinylation was used for the detection and purification of cell surface proteins as previously described (21). Briefly, equal amounts of 10 μL of biotinylated protein were separated on 10% SDS gels, transferred onto nitrocellulose membranes, and probed with a Human influenza hemagglutinin (HA) tag antibody (Abcam). An antibody directed against β-actin (Rockland) was used for loading control.
Radioactive thyroid hormone uptake experiments
125I-T3 and 125I-T4 (PerkinElmer), respectively, was purified from iodide ions by adsorption chromatography as described previously (15) and finally resuspended in uptake buffer (125mM NaCl, 5mM KCl, 1.3mM CaCl2, 1.2mM MgCl2, 25mM HEPES, and 5.6mM glucose; pH 7.4). Iodothyronines were first dissolved in DMSO (1000-fold final concentration) and then in uptake buffer.
For competitive inhibition studies, cells were exposed to 10nM 125I-T3 tracer in uptake buffer for 3 or 10 minutes in the presence or not of 10μM iodothyronine or 1mM tryptophane (Trp). Buffer was removed, cells were washed with ice-cold PBS and lysed in 40mM NaOH. Radioactivity of the lysate was measured in a γ-counter (Wizard; PerkinElmer). For time-course assays, stably transfected cell lines were incubated with 10nM 125I-T3 or 1nM125I-T4 (added with 10nM nonradioactive T4), respectively, for 1–30 minutes at 37°C. Cells were washed, lysed, and radioactivity associated with the cells was determined. For the determination of Michaelis constants KM, MDCK1 cells were incubated for 3–10 minutes with T4 at concentrations ranging from 500nM to 12μM containing 125I-T4 as tracer (15). A Michaelis-Menten transport mechanism was assumed for calculations (GraphPad 4.0; GraphPad, Inc).
Each experiment was performed on at least 2 different days with different batches of cells in triplicate. Radioactivity associated with empty vector-transfected cells was subtracted as background.
Liquid chromatography–tandem mass spectrometry (LC-MS2)-based uptake assays
For efflux-assays MDCK1 cells were first loaded with 10nM T3 or T4 for 30 minutes. Cells were briefly washed with PBS and uptake buffer without thyroid hormone was added for 5 minutes. After incubation, the cell lysate and supernatant was prepared for LC-MS2 measurement.
For the determination of apparent Michaelis constants, MDCK1 cells were incubated for 5 minutes with rT3 at concentrations ranging from 500nM to 12μM. After incubation, cells were washed once with ice cold PBS and prepared for LC-MS2 measurement.
For substrate mix endpoint assays, MDCK1 cells were incubated for 30 minutes in a 100nM substrate mix (of each T4, T3, rT3, 3,5-diiodo-L-thyronine [3,5-T2], and 3′,5′-diiodo-L-thyronine [3′,5′-T2]) dissolved in uptake buffer. After incubation, cells were washed once with ice cold PBS and prepared for LC-MS2 measurement.
Sample preparation consisted of a fast alkaline lysis of the cells, followed by internal standard (IS) addition and liquid-liquid extraction (28). In short, cells cultured in a 24-well plate format were lysed with 100-μL 0.1N NaOH and 100-μL homogenization buffer (250mM sucrose, 20mM HEPES, and 1mM EDTA at pH 7.4) for 3 minutes on ice; 20-μL glacial acetic acid and IS were added. The liquid was transferred to a tube. Wells were washed with 10-μL glacial acetic acid in 90-μL homogenization buffer. After transfer to the tube, the liquid was incubated for 30 minutes at 37°C. This was followed by 2 1-mL isopropanol-methyl tert-butyl ether (30:70 vol/vol) extractions. The combined extracts were evaporated. The pellet was resuspended in 100-μL 50% methanol with 0.1% formic acid. Detection of iodothyronines was performed by LC-MS2 (28) with the modification that 40 μL of sample extract was injected. Quantification was based on a standard curve, with correction for extraction efficiency using the IS. Each experiment was performed on at least 2 different days with different batches of cells in triplicate. Uptake associated with empty vector-transfected cells was subtracted as background.
Uptake measurements in Xenopus oocytes
In vitro transcription of 5-μg plasmid DNA were performed using the mMessage mMachine T7 kit (Life Technologies) following the manufacturer's protocol. Xenopus laevis oocyte preparation and cRNA injection were accomplished by EcoCyte Bioscience. Oocytes were injected with 30-ng cRNA. Injected oocytes were kept in Barth's buffer (88mM NaCl, 1mM KCl, 2.4mM NaHCO3, 0.82mM MgSO4, 0.66mM NaCO3, 0.75mM CaCl2, and 50mM HEPES in dH2O [pH 7.4] + 10 mg/L gentamycin) for additional 3 days before performing uptake measurements at room temperature. Radioactive compounds were dissolved in Barth's buffer with the following concentrations: 10nM 125I-T3 and 0.5mM Phe plus 4nM 3H-Phe. Oocytes were incubated with tracer (for 3–20 min for T3 time course and 20 min for Phe endpoint assay, respectively), washed with ice cold PBS and lysed with 40mM NaOH. Absorbed radioactivity of each oocyte was measured using γ- or β-counters (LB2111 Multi Crystal, Berthold Technologies, Wizard; PerkinElmer). H2O injected oocytes served as negative controls.
Results
Amino acids that determine differences in substrate specificity between MCT10 and MCT8
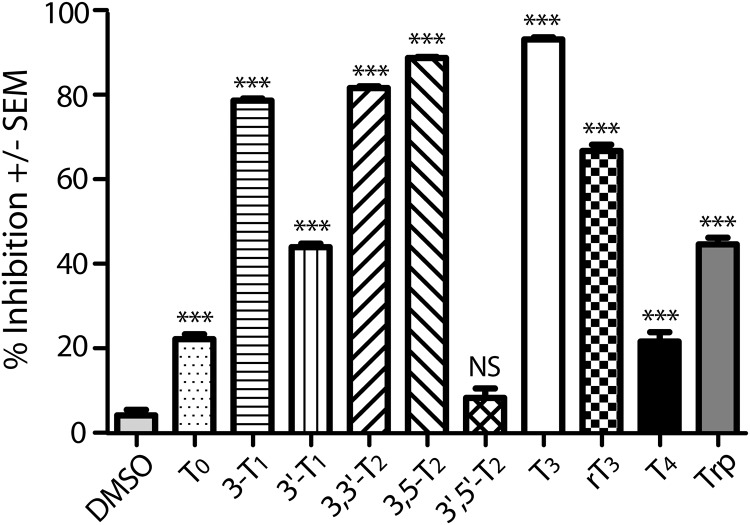
Previously, we have systematically investigated the molecular determinants of MCT8 substrates by competing uptake of the canonical 125I-T3 substrate with a 1000-fold (for thyroid hormones) excess of unlabeled test compounds (15). This analysis demonstrated that efficient transport by MCT8 requires an L-amino acid moiety and one iodine atom in each ring (3- and 3′ positions) of the thyronine phenolether. Here, we present a similar analysis for MCT10 (Figure 1). The data show that T3, rT3, and 3,3′-diiodo-L-thyronine (3,3′-T2) inhibit MCT10 and are thus potential substrates. T4, in contrast, was a rather weak inhibitor of MCT10 and may not be a substrate of MCT10 at all. 3-T1 inhibited MCT10, whereas it is not a known MCT8 substrate or inhibitor. Inhibition of MCT10-mediated T3 uptake by 3,5-T2 suggests that MCT10 may be the elusive 3,5-T2 transporter. Consistent with its known activity as a Trp transporter, MCT10-mediated T3 uptake was inhibited by 1mM Trp (Figure 1).
Figure 1. Substrate spectrum of MCT10.
Competition experiments were performed by coincubating 10nM 125I-T3 with 1μM various iodothyronines or 1mM Trp in MDCK1 cells stably expressing MCT10. Cell associated radioactivity was measured after 3 minutes. 125I-T3 uptake of cells transfected with pcDNA3 was considered as background and subtracted. Uptake without test compound was set to 0% inhibition. ***, P < .001; NS, not significant vs Dimethyl Sulfoxide.
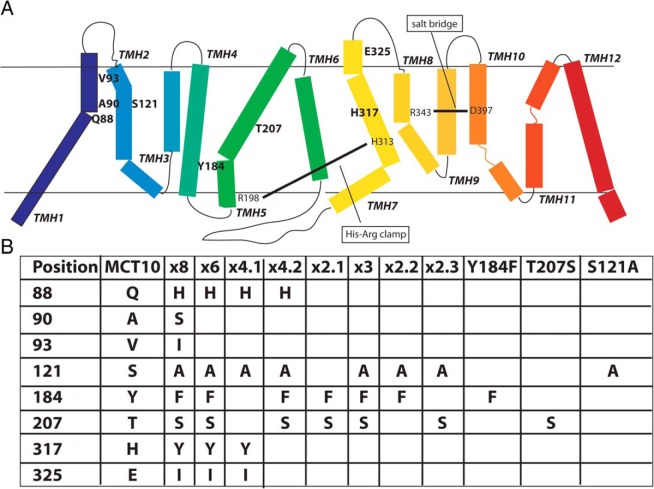
We wanted to identify those amino acids which prevent MCT10 from transporting T4. An amino acid sequence alignment between MCT10 and MCT8 revealed 49% identity and 63% similarity (Supplemental Figure 1). Based on our MCT8 homology model (15), we marked those amino acids which lined the presumed substrate translocation channel. Among those amino acid positions that differ between MCT10 and MCT8, we selected 8 positions and prepared an MCT10MCT8 chimera with the corresponding amino acids mutated to those found in MCT8: Q88H, A90S, V93I, S121A, Y184F, T207S, H317Y, and E325I. For brevity, this mutant is designated MCT10x8. The positions of mutated amino acids are indicated in bold type in the schematic representation of MCT10 (Figure 2A). During the course of this study, we prepared a number of mutant MCT10 proteins, which are summarized in Figure 2B. Compared with MCT10x8, MCT10x6 does not carry the A90S and the V93I exchanges, because these amino acids are bigger in MCT8 than in MCT10, and it is unlikely that bigger amino acids would help accommodate a bigger substrate. We prepared 4 MCT10x4 chimeras, which are permutations of 4 couples of amino acid exchanges from MCT10x8. Only MCT10x4.1 and MCT10x4.2 were informative. MCT10x3 is MCT10x4.2 less the Q88H exchange, which we knew from previous work not to be essential. Finally, 3 MCT10x2 chimeras, representing permutations of the exchanges in MCT10x3, and the respective 3 single mutants were prepared.
Figure 2. Amino acid substitutions in MCT10.
A, Schematic representation of MCT10 based on the model of MCT8 (15). The 8 target amino acids of MCT10x8 are represented in boldface. Known interactions in MCT8 (salt bridge, His-Arg clamp) are indicated for orientation. B, Overview of all amino acid exchanges of the relevant MCT10MCT8 chimeras. The colors correspond to A.
Biochemical characterization of MCT10MCT8 chimeric proteins
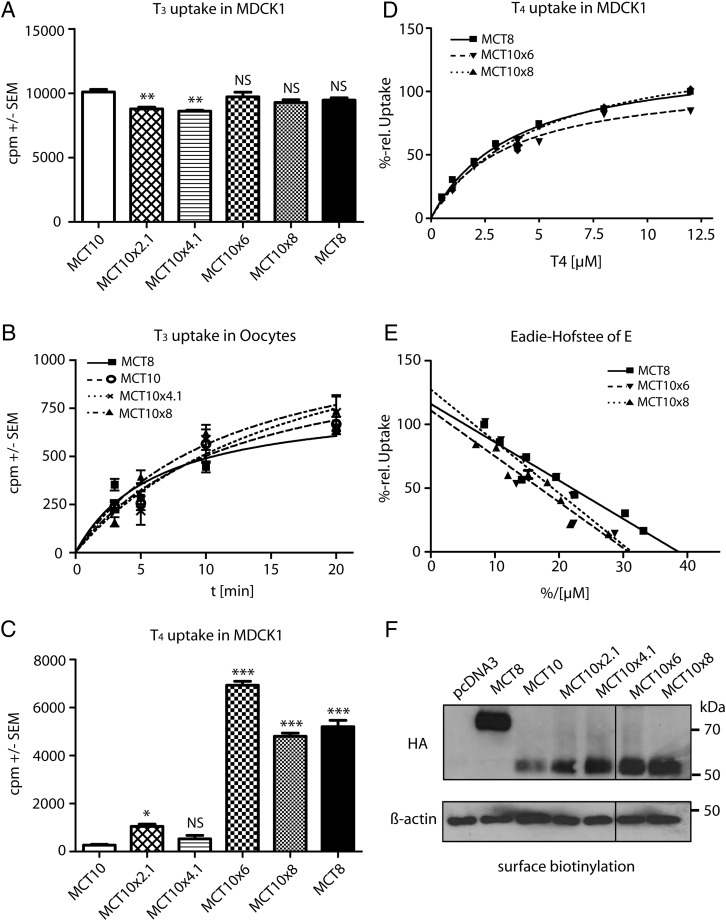
We then asked whether T3 uptake activity is preserved in the chimeric MCT10MCT8 proteins. We performed 125I-T3 uptake experiments in stably transfected MDCK1 cells selected for similar MCT10 expression. In an endpoint assay, 125I-T3 uptake was similar among all wild-type and chimeric proteins (Figure 3A). We then injected equal amounts of in vitro transcribed transporter cRNA into Xenopus oocytes. Chimeras MCT10x8 and MCT10x4.1 exhibited similar T3 transport activity as MCT8 (Figure 3B).
Figure 3. Biochemical characterization of MCT10MCT8 chimeric proteins.
A, Uptake of 10nM 125I-T3 after 30 minutes in stably transfected MDCK1 cells expressing various MCT10MCT8 chimeras and the wild-type MCT8 and MCT10, respectively. Uptake of cells transfected with pcDNA3 was considered as background and subtracted. B, T3 time-course experiment in Xenopus oocytes. Oocytes injected with the appropriate cRNA were exposed to 10nM 125I-T3 for 3–20 minutes, mock-injected oocytes served as background control. T3 uptake over time is not changed in MCT10x4.1 and MCT10x8 compared with MCT10. C, Uptake of 10nM 125I-T4 after 30 minutes in stably transfected MDCK1 cells expressing various MCT10MCT8 chimeras and the wild-type MCT8 and MCT10, respectively. Uptake into mock-transfected cells was subtracted. MCT10x8 and MCT10x6 gained the ability to transport T4. D, Determination of KM values for T4 of MCT10MCT8 chimeras in relation to MCT8. Uptake into mock-transfected cells was subtracted as background. Measurements were performed with increasing concentrations of T4 for 3 minutes. Uptake of MCT8 at highest concentration (12.5μM) was set to 100%. E, Eadie-Hofstee plot of data from D, revealing similar KM values for MCT10x8 and MCT10x6 compared with MCT8. F, Western blotting for anti-HA tag with 10-μL biotinylated and affinity-purified plasma membrane protein fraction of MDCK1 stably expressing MCT10MCT8 chimeras MCT10 and MCT8 wild type. β-Actin served as loading control. All chimeras reached the cell surface and were expressed in a similar manner. *, P < .5; **, P < .01; ***, P < .001; NS, not significant.
Subsequently we tested whether any of the MCT10MCT8 chimeras acquired the ability to take up 125I-T4 in stably transfected MDCK1 cells. MCT8 served as the positive control. MCT10x8 and MCT10x6 showed T4 uptake rates similar to MCT8, whereas MCT10x4.1 and MCT10x2.1 exhibited no significant activity above MCT10 negative controls (Figure 3C). Kinetic analysis yielded similar Michaelis constants for T4 of 3.0 ± 0.2μM for MCT8, 3.6 ± 0.2μM for MCT10x8, and 4.1 ± 0.4μM for MCT10x6 (Figure 3, D and E). To assess protein expression levels and translocation to the plasma membrane, we biotinylated membrane proteins with the cell-impermeable Sulfo-NHS-SS-Biotin, purified these from cell lysates and performed Western blot experiments with anti-HA tag antibody directed against an N-terminal HA-tag cloned into all expression constructs (Figure 3F) (27). Surface expression levels of the MCT10MCT8 chimeras analyzed were not reduced in comparison with wild-type MCT10 in MDCK1 cells. Accordingly, up to 8 amino acid exchanges in MCT10 chimeras did not disturb protein translocation to the cell surface.
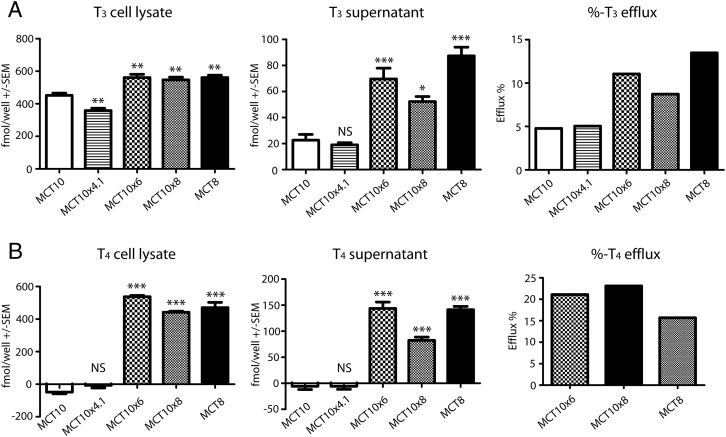
We then asked whether MCT10MCT8 chimeric proteins capable of T4 uptake were also able to release T4. First, we preloaded MDCK1 cells with T3 and assessed its accumulation by LC-MS2 analysis, exchanged the incubation buffer and then followed T3 release into buffer. T3 release was more similar in MCT10MCT8 cells and MCT8 than in MCT10 cells (Figure 4A). We then preloaded cells with T4 and again followed its release into the buffer (Figure 4B). As shown in the previous experiment, MCT10 was not able to take up T4. Again, MCT10x6 and MCT10x8 exhibited T4 uptake and release very similar to MCT8, whereas MCT10x4.1 was incapable of T4 accumulation or release.
Figure 4. Efflux of substrates by MCT10 chimeras compared with MCT10 and MCT8.
MDCK1 cells expressing various MCT10MCT8 chimeras and the wild-type MCT8 and MCT10, respectively, were incubated for 30 minutes with 10nM substrate (A) T3, or (B) T4 After substrate-loading, cells were washed briefly with PBS and incubated for 5 minutes with uptake buffer w/o substrate. Substrates from cell lysate and supernatant were extracted and measured by LC-MS2. The background of empty-vector transfected cells was subtracted. MCT10x6 and MCT10x8 mirror the uptake and efflux of MCT8, whereas MCT10x4.1 behaved like MCT10. *, P < .5; **, P < .01; ***, P < .001; NS, not significant.
The substrate spectra of MCT10MCT8 chimeric proteins
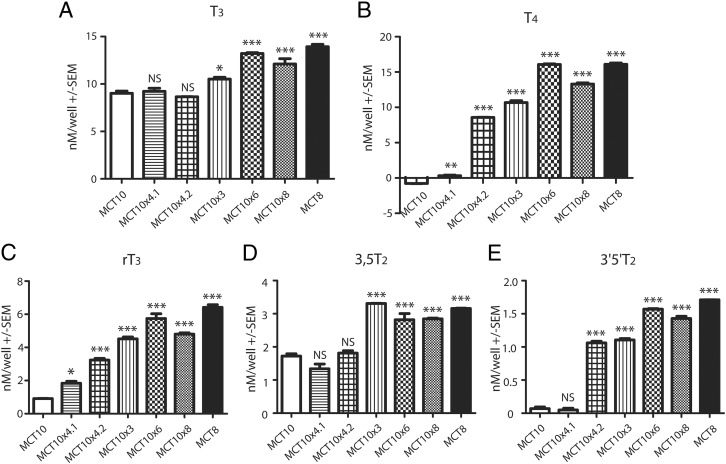
To obtain a quick overview whether the amino acid exchanges changed the substrate spectra of MCT10MCT8 chimeric proteins in comparison with MCT10, a mixture of several iodothyronines at 100nM concentration was prepared, and stably transfected MDCK1 cells expressing MCT10MCT8 proteins were exposed to the mixture. After 30 minutes, cells were washed and iodothyronines associated with the cells or release into the supernatant were extracted and analyzed by LC-MS2. We now included additional MCT10MCT8 chimeric proteins, MCT10x4.2 (which is another out of 4 permutations of MCT10x4 chimeras with MCT10x4.3 and MCT10x4.4 incapable of T4 uptake, data not shown) and MCT10x3 (derived from MCT10x4.2 lacking Q88H, because this change does not influence T4 uptake as shown previously) (21). As demonstrated in above experiments with 125I-T3 or 125I-T4 as substrates, T3 was taken up by all MCT10MCT8 chimeras with MCT10x6 and MCT10x8 resembling the efficiency of MCT8, whereas the other chimeras behaved more like MCT10 (Figure 5A). T4 was not a substrate for MCT10 and MCT10x4.1, whereas MCT10x3, MCT10x4.2, MCT10x6, and MCT10x8 were capable of T4 transport (Figure 5B). These amino acid exchanges further changed the substrate spectra of MCT10MCT8 chimeras: uptake of rT3 was very weak in MCT10 but approached MCT8 levels in MCT10x6 and was only slightly lower in MCT10x8 and MCT10x3. Uptake of rT3 was intermediate in MCT10x4.2 and still lower in MCT8x4.1 (Figure 5C).
Figure 5. Substrate spectra of MCT10MCT8 chimeras compared with MCT10 and MCT8.
MDCK1 cells expressing various MCT10MCT8 chimeras and the wild-type MCT8 and MCT10, respectively, were incubated for 30 minutes with 100nM each of the indicated substrates. Substrates from cell lysate was extracted and measured by LC-MS2. The background of empty-vector transfected cells was subtracted. MCT10x3, MCT10x4.2, MCT10x6, and MCT10x8 mirror the substrate spectrum of MCT8, whereas MCT10x4.1 shows the same substrate specificity as MCT10. **, P < .01; ***, P < .001.
The superiority of direct uptake measurements over competition experiments was evident in the case of 3,5-T2 as substrate. In accordance with the competition experiments in Figure 1, 3,5-T2 is an MCT10 substrate, but MCT10x3, MCT10x6, and MCT10x8 as well as MCT8 accumulated more 3,5-T2 than MCT10. Note, however, the different scale as compared with T3 and T4 uptake (Figure 5D). The pattern of uptake of 3′,5′-T2 by MCT10MCT8-expressing cells resembled the uptake of rT3 (Figure 5E). MCT10x4.2 appeared to differentiate between substrates carrying 2 iodine atoms in positions 3,5 and 3′,5′, respectively.
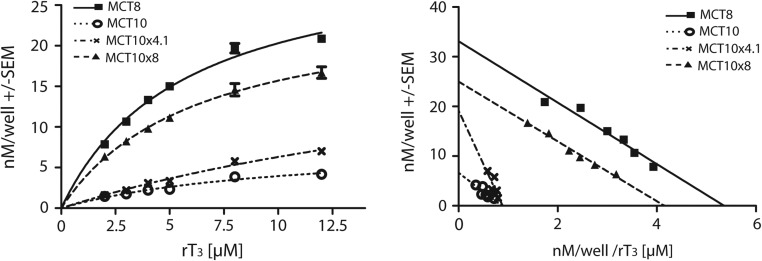
Because the LC-MS2 measurements confirmed our data of the competitive inhibition studies (Figure 1), except for rT3, we examined rT3 uptake more deeply and determined the Michaelis constants (KM) for rT3 for one chimera more resembling MCT8 (MCT10x8) and one resembling MCT10 (MCT10x4.1) as well as the 2 wild-type transporters (Figure 6). Kinetic analysis yielded an almost identical KM value of 6.2 ± 0.8μM for MCT8 and 6.0 ± 0.4μM for MCT10x8. The Michaelis constant of 7.6 ± 2.3μM for MCT10 was in a similar range, but its maximum velocity (vmax) was 80% lower compared with MCT8. Interestingly, the MCT10x4.1 chimera showed an elevated KM of 21.5 ± 8.6μM, whereas its vmax was increased to 285% compared with the MCT10. These findings confirmed the results of the previous experiment with the substrate mixture (Figure 5C).
Figure 6. Determination of rT3 KM values.
A, MDCK1 cells stably transfected with MCT10x4.1, MCT10x8, MCT10, and MCT8 were incubated with increasing concentrations of rT3 for 5 minutes. rT3 from cell lysate was extracted and measured by LC-MS2. The background of empty-vector transfected cells was subtracted as background. B, Eadie-Hofstee plots of data from A, revealing very similar KM values for MCT8 and MCT10x8. *, P < .05; **, P < .01; ***, P < .001; NS, not significant.
Two combinations of 2 amino acid exchanges are sufficient to turn MCT10 into a T4 transporter
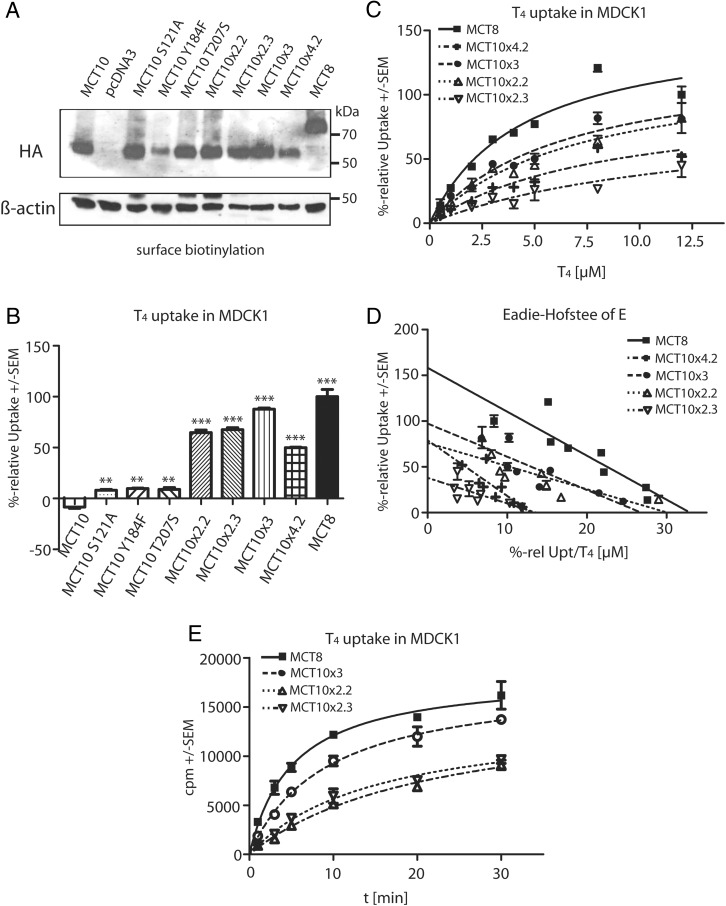
Our experiments showed that MCT10x3 and MCT10x4.2 were capable of T4 uptake and had 2 amino acid exchanges in common (Y184F and T207S). The corresponding mutant was designated MCT10x2.1, albeit it was a weak T4 transporter. In contrast, the additional presence of S121A in MCT10x3 allowed T4 uptake at a KM of 3.8 ± 0.5μM. We therefore combined S121A each with Y184F and T207S substitutions creating chimeras MCT10x2.2 and MCT10x2.3, respectively. In addition, single amino acid replacements of the critical amino acids were prepared and the MCT10MCT8 chimeric proteins stably expressed in MDCK1 cells (Figure 7A). All these mutants mediated T3 uptake in the LC-MS2 assay (not shown). Both 2-fold chimeras, MCT10x2.2 and MCT10x2.3, were capable of T4 uptake, whereas the chimeras with only a single amino acid exchange all behaved like MCT10 and did not mediate T4 uptake (Figure 7B). KM determinations revealed values of 2.7 ± 0.6μM and 3.4 ± 0.8μM for the MCT10x2.2 and MCT10x2.3 chimeras, respectively, which is in the range of MCT8 or even better (Figure 7, C and D). Increased incubation times of 10 minutes instead of 3 minutes were necessary to perform these measurements, because these mutants mediated slower T4 uptake than MCT8 (Figure 7E). Although vmax determinations of recombinantly expressed proteins are inherently difficult to interpret in a cellular system, it is obvious that the MCT10x2 and MCT10x3 chimeras mediate slower T4 uptake than MCT8, because of lower vmax and not because of higher KM.
Figure 7. Biochemical characterization of additional MCT10MCT8 chimeric proteins.
All experiments were performed in stably transfected MDCK1 cells expressing various MCT10MCT8 chimeras and the wild-type MCT8 and MCT10, respectively. Uptake into mock-transfected cells was subtracted as background. A, Western blotting for anti-HA tag with 10-μL biotinylated and affinity-purified plasma membrane protein fraction of MDCK1 cells. β-Actin served as loading control. All chimeras reached the cell surface and were expressed at a similar level. B, Uptake of 10nM 125I-T4 after 30 minutes. MCT10x4.2, MCT10x3.1, MCT10x2.2, and MCT10x2.3 gained the ability to transport T4, whereas the chimeras with a single mutation behaved like MCT10. C, Determination of KM values of T4 transporting MCT10MCT8 chimeras in relation to MCT8. Measurements were performed with increasing concentrations of T4 for 10 minutes (MCT8 3 min). Uptake of MCT8 at the highest concentration (12.5μM) was set to 100%. D, Eadie-Hofstee plot of data from C, revealing similar KM but decreased vmax values compared with MCT8. E, T4 time-course experiment. MDCK1 cells were exposed to 10nM 125I-T4 for 1–30 minutes. MCT10x2.2 and MCT10x2.3 show a slower uptake of T4 compared with MCT8.
Effects of structure guided mutagenesis on aromatic amino acid uptake
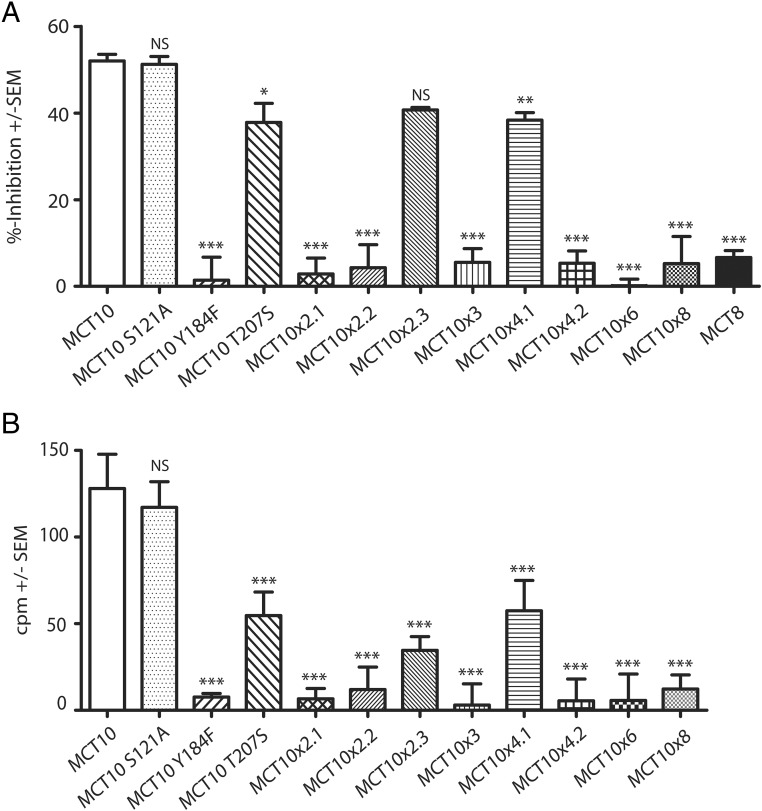
Do MCT10MCT8 chimeras that have acquired T4 as a new substrate retain the ability to transport aromatic amino acids? To answer this question, we performed experiments in which we competed 10nM 125I-T3 with 1mM Trp during uptake experiments with MDCK1 cells transfected with all our MCT10MCT8 chimeras (Figure 8A). MCT10 served as a positive control, showing strong inhibition, whereas the T3 uptake of the negative control MCT8 remained almost unaffected by Trp coincubation. A careful analysis revealed that all MCT10MCT8 chimeras which contained a single amino acid exchange, Y184F, did not show any significant competition of T3 uptake by Trp.
Figure 8. Effect of amino acid exchanges on amino acid uptake in MDCK1 cells and Xenopus oocytes.
A, Competition uptake of 125I-T3 (10nM) and Trp (1mM) after 10 minutes in MCT10 chimeras compared with wild-type MCT8 and MCT10. All chimeras including the Y184F mutation show no significant inhibition. B, 3H-Phe uptake activity of MCT10 chimera expressed in Xenopus oocytes after 20 minutes. Only the oocytes injected with MCT10-cRNA, which did not include a Tyr184 mutation, showed a clear accumulation of 3H-Phe. *, P < .5; **, P < .01; ***, P < .001; NS, not significant.
In order to formally address aromatic amino acid uptake in these MCT10MCT8 chimeras, we performed direct 3H-Phe uptake experiments in Xenopus oocytes injected with transporter cRNA. The cells were incubated with 0.5mM 3H-Phe over a period of 20 minutes and MCT8-expressing and mock-injected oocytes served as negative controls, whereas MCT10-injected cells served as positive control. Besides MCT10, only the single mutants MCT10S121A and MCT10T207S and the chimeras MCT10x2.3 and MCT10x4.1 showed significant Phe uptake activity (Figure 8B). Phe uptake was incompatible with the Y184F amino acid exchange. These findings identify the critical role of Tyr184 in the transport process of aromatic amino acids by MCT10.
Discussion
A structure-guided approach greatly facilitated this study
The highly homologous proteins MCT10 and MCT8 are both efficient T3 transporters, yet differ in their substrate spectra. MCT10 is incapable of T4 transport, whereas MCT8 cannot transport aromatic amino acids. MCT8 is an efficient T4 transporter but does not transport amino acids. We therefore reasoned that differences in amino acids lining the substrate translocation channel should determine substrate specificity. Given the high homology between MCT10 and MCT8, we hypothesized that exchanging amino acids that occupy the same position in both proteins is unlikely to disrupt protein structure. This tenet held, because all MCT10MCT8 proteins expressed at similar levels and translocated to the plasma membrane. This study was greatly facilitated by inspection of our MCT8 homology model (15). Amino acid alignment suggests that both MCT8 and MCT10 share the critical amino acids (numbered according to MCT8) Arg445, Asp498, and His415 identified by us and others (15, 20, 21, 23), and both proteins share very similar structures. The MCT8 model helped to select amino acids likely to contact the substrate, because they are predicted to line the interface of the 2 6-helix bundles of which MCT8 and MCT10 are composed. We then prepared a series of MCT10MCT8 chimeric proteins harboring up to 8 amino acid exchanges (MCT10x8) corresponding to amino acids found in MCT8. Starting from MCT10x8, which exhibited efficient T4 uptake in stably transfected MDCK1 cells, we were able to identify the MCT10x3 mutant which is only slightly slower than MCT8 in T4 uptake, and arrived at 2 MCT10x2 mutants which still can transport T4, but at lower rates. Exchanging only 2 pairs of amino acids, ie, S121A+Y184F and S121A+T207S were enough to bestow MCT10 with the capacity to transport T4. It is intriguing to see that, in the first instance, only 2 oxygen atoms are effectively removed from the protein, and in the second instance an oxygen and a methyl group are removed from MCT10. Although our initial working hypothesis was to identify those amino acids that directly interact with the 5′-iodine of T4, it now appears as if these mutations simply create space along the interface of the 2 domains of the transporter. All these amino acid exchanges appeared unlikely choices at the outset of our study. This finding underlines the usefulness of our approach, because 3 out of 515 amino acids means that 0.6% of all MCT10 amino acids were exchanged. If these positions had been known from the beginning, but suitable amino acids had to be found by systematic testing, 203 = 8000 combinations had to be assessed. The model thus has greatly facilitated our analysis of MCT-mediated iodothyronine transport and allowed to conduct this study with only about 15 mutant proteins. A similar study comparing MCT1 and MCT4 sensitivity towards an inhibitor has been recently performed by Halestrap and coworkers (29). Their homology model of MCT1 is also based on the structure of GlpT (30).
Substrate spectra of MCT10MCT8 proteins
Although transport of T4 was our primary goal to achieve, we were clearly interested in how the mutations affected the substrate spectrum of MCT10. Because of the slow uptake of the MCT10x2 chimeric proteins, we studied MCT10x3, which is a more effective T4 transporter and contains all exchanges present in the MCT10x2 mutants. We employed LC-MS2 analyses available in our laboratory to study a number of iodothyronines as substrates. T3 uptake was not affected by any of the mutants described in this work. Reverse T3 is a very weak MCT10 substrate. MCT10x8, MCT10x6, and, to a slightly lesser extent MCT10x3, accepted rT3 as a substrate, but even MCT10x4.1 and MCT10x4.2 displayed rT3 uptake above MCT10, albeit at high KM and low velocity. It is interesting that MCT10x8, MCT10x6, and MCT10x3 accepted both 3,5-T2 and 3′,5′-T2, whereas MCT10x4.2 effectively enhanced 3′,5′-T2 uptake, but not 3,5-T2 uptake, over MCT10.
MCT10 chimeras MCT10x8, MCT10x6, MCT10x4.2, and MCT10x3 all are able to accommodate 2 iodines in the phenolic ring, whereas the MCT10x4.1 chimera apparently does not tolerate the lack of 2 phenolic ring iodines. To delineate the mechanism behind this observation will, ultimately, require an investigation that takes dynamic movements during substrate translocation of the protein and the ligand into consideration. The creation of space, however, to expand the substrate spectrum, has been observed with experiments on Lat2, which acts as a 3,3′-T2 and (to a lesser degree) T3 transporter, but does not transport rT3 and T4 (31). In a subsequent publication, the authors hypothesized that the substrate specificity in Lat2 is accomplished due to steric hindrance in the binding pocket of the transporter. Indeed, by shortening the side chains of specific amino acids, 3,3′-T2 transport was increased, whereas side chain enlargements led to a decreased 3,3′-T2 uptake (17). It should be noted that there may be a fundamental difference between LAT (and related transporters) and MCT family members in that LATs are known to bind the amino acid moiety of the substrate via main chain interactions (as shown in the crystal structures of AdiC and ApcT, see Ref. 17), whereas no such interactions have been described for MCTs. In this respect, the narrow substrate specificity of MCT8 has not yet been elucidated (15).
Ala121 occupies a critical position at the end of the substrate channel
The S121A mutation in MCT10 is common to MCT10x3 and both active MCT10x2 combinations, and is required to expand the substrate specificity of MCT10 to include T4. The Ser in this position is highly conserved among the MCT family, with MCT8 being the only member which harbors an Ala (Ala224) in this position. At first glance, it seems very remarkable that Ala has such a strong effect on MCT10 substrate specificity, because its side chain is rather nonpolar, and it probably may not interact directly with the substrate but rather interacts with the surface of the domain comprised of TMH7–TMH12. Because of its prominent position in our MCT10 model at the end of the substrate translocation channel (inside open conformation) the change from a Ser to an Ala has consequences for the structure of the transporter. The loss of 1 oxygen atom may create a little more space and allow increased flexibility of the transporter during domain movements and facilitated accommodation the bulkier substrate, T4.
The critical role of the amino acid at this position is underlined by 2 pathogenic mutations that have been repeatedly found in MCT8, A224T (32, 33), and A224V (2, 34, 35). Both amino acid substitutions introduce small functional groups, ie, hydroxyl and methyl groups, and 2 substituents at the Cβ atom thus reducing flexibility of the side chain. Our findings support our previous hypothesis that Ala224 might be vital in the switching process between the inside-open and the outside-open conformations (36).
Thr207 might have an impact on the substrate pocket size
Thr207 is located in TMH5 at the interface to TMH8. The hydroxyl side chain points towards the substrate channel. The biochemical properties of the exchanged amino acids are very similar, both containing a hydroxyl group, so the difference between both amino acids is the removal of the methyl group at the Cβ position again creating more space at the interface of the 2 domains. Again, the amino acid replacement appears to create space for domain movements rather than specifically probe the properties of the substrate. To our knowledge, a pathogenic mutation at the corresponding position in MCT8 (Ser310) is not known.
Tyr184 is vital for the transport of aromatic amino acids by MCT10
MCT10 is the only member of the MCT family which transports aromatic amino acids and therefore is also known as T-type amino acid transporter. T3 uptake by MCT10 can be competed with aromatic amino acids (37). Our data give a first hint and demonstrate that Tyr184 is absolutely necessary to allow transport of aromatic amino acids in MCT10. Trp does not interfere with T3 uptake in mutants containing the Y184F substitution. In addition, the simple removal of the phenolic oxygen at the side chain of amino acid 184 is sufficient to abrogate Phe uptake. The hydroxyl group of Tyr184 thus might directly interact with the amino acid substrate, whereas it interferes with T4 uptake in MCT10. We are not aware of pathogenic mutations affecting Phe287, located at the corresponding position in MCT8.
In conclusion, we expected to identify amino acid side chains which specifically probe the 5′-iodine in T4, but identified very minor changes (removal of hydroxyl groups in Y184F and S121A plus the removal of a methyl group in T207S) which appear to create space for easier interdomain movements. This space may be required to accommodate the bulkier T4 and rT3 substrates. Clearly, we cannot exclude that other not yet identified amino acids specifically interact with the substrate. Moreover, it remains so far enigmatic, why the hydroxyl of Tyr184 is essential for aromatic amino acid transport. Definite knowledge about transporter/substrate interactions will need to await analysis of crystal structures of MCT8 or MCT10 in different conformations in order to account for the dynamic changes during substrate transport. Until then, our homology model of MCT8 and its comparison with MCT10 may serve as useful approximations.
Acknowledgments
We thank the initial MCT8 model and discussions with Dr Gunnar Kleinau, Berlin. We also thank Simone Arndt and Tobias Lindenberg for technical assistance.
Present address for A.K.: Leibniz-Institut für Molekulare Pharmakologie, 13125 Berlin, Germany.
This work was supported by Deutsche Forschungsgemeinschaft Grants SCHW914/3-1 and SCHW914/4-1 (to U.S.) and KO922/17-1 (to J.K.) and by grants from Universitätsklinikum Bonn (U.S.).
Disclosure Summary: The authors have nothing to disclose.
Funding Statement
This work was supported by Deutsche Forschungsgemeinschaft Grants SCHW914/3-1 and SCHW914/4-1 (to U.S.) and KO922/17-1 (to J.K.) and by grants from Universitätsklinikum Bonn (U.S.).
Footnotes
- 3,3′-T2
- 3,3′-diiodo-L-thyronine
- 3,5-T2
- 3,5-diiodo-L-thyronine
- 3′,5′-T2
- 3′,5′-diiodo-L-thyronine
- HA
- Human influenza hemagglutinin
- IS
- internal standard
- Lat
- L-type amino acid transporters
- LC-MS2
- Liquid chromatography–tandem mass spectrometry
- MCT
- monocarboxylate transporter
- MDCK
- Madin-Darby canine kidney
- MFS
- major facilitator superfamily
- OATP
- organic anion-transporting polypeptide
- SLC
- solute carrie family
- TAT1
- T-type amino acid transporter
- TMH
- transmembrane helix
- Trp
- tryptophane.
References
- 1. Friesema EC, Ganguly S, Abdalla A, Manning Fox JE, Halestrap AP, Visser TJ. Identification of monocarboxylate transporter 8 as a specific thyroid hormone transporter. J Biol Chem. 2003;278(41):40128–40135. [DOI] [PubMed] [Google Scholar]
- 2. Friesema EC, Grueters A, Biebermann H, et al. Association between mutations in a thyroid hormone transporter and severe X-linked psychomotor retardation. Lancet. 2004;364(9443):1435–1437. [DOI] [PubMed] [Google Scholar]
- 3. Dumitrescu AM, Liao XH, Best TB, Brockmann K, Refetoff S. A novel syndrome combining thyroid and neurological abnormalities is associated with mutations in a monocarboxylate transporter gene. Am J Hum Genet. 2004;74(1):168–175. [DOI] [PMC free article] [PubMed] [Google Scholar]
- 4. Schwartz CE, May MM, Carpenter NJ, et al. Allan-Herndon-Dudley syndrome and the monocarboxylate transporter 8 (MCT8) gene. Am J Hum Genet. 2005;77(1):41–53. [DOI] [PMC free article] [PubMed] [Google Scholar]
- 5. Allan W, Herndon CN, Dudley FC. Some examples of the inheritance of mental deficiency: apparently sex-linked idiocy and microcephaly. Am J Ment Defic. 1944;48:325–334. [Google Scholar]
- 6. Hennemann G, Docter R, Friesema EC, de Jong M, Krenning EP, Visser TJ. Plasma membrane transport of thyroid hormones and its role in thyroid hormone metabolism and bioavailability. Endocr Rev. 2001;22(4):451–476. [DOI] [PubMed] [Google Scholar]
- 7. Abe T, Kakyo M, Sakagami H, et al. Molecular characterization and tissue distribution of a new organic anion transporter subtype (oatp3) that transports thyroid hormones and taurocholate and comparison with oatp2. J Biol Chem. 1998;273(35):22395–22401. [DOI] [PubMed] [Google Scholar]
- 8. Friesema EC, Docter R, Moerings EP, et al. Identification of thyroid hormone transporters. Biochem Biophys Res Comm. 1999;254(2):497–501. [DOI] [PubMed] [Google Scholar]
- 9. Sugiyama D, Kusuhara H, Taniguchi H, et al. Functional characterization of rat brain-specific organic anion transporter (Oatp14) at the blood-brain barrier: high affinity transporter for thyroxine. J Biol Chem. 2003;278(44):43489–43495. [DOI] [PubMed] [Google Scholar]
- 10. Blondeau JP, Beslin A, Chantoux F, Francon J. Triiodothyronine is a high-affinity inhibitor of amino acid transport system L1 in cultured astrocytes. J Neurochem. 1993;60(4):1407–1413. [DOI] [PubMed] [Google Scholar]
- 11. Friesema EC, Docter R, Moerings EP, et al. Thyroid hormone transport by the heterodimeric human system L amino acid transporter. Endocrinology. 2001;142(10):4339–4348. [DOI] [PubMed] [Google Scholar]
- 12. Friesema EC, Jansen J, Jachtenberg JW, Visser WE, Kester MH, Visser TJ. Effective cellular uptake and efflux of thyroid hormone by human monocarboxylate transporter 10. Mol Endocrinol. 2008;22(6):1357–1369. [DOI] [PMC free article] [PubMed] [Google Scholar]
- 13. Schweizer U, Johannes J, Bayer D, Braun D. Structure and function of thyroid hormone plasma membrane transporters. Eur Thyroid. 2014;3(3):143–153. [DOI] [PMC free article] [PubMed] [Google Scholar]
- 14. Westholm DE, Marold JD, Viken KJ, Duerst AH, Anderson GW, Rumbley JN. Evidence of evolutionary conservation of function between the thyroxine transporter Oatp1c1 and major facilitator superfamily members. Endocrinology. 2010;151(12):5941–5951. [DOI] [PubMed] [Google Scholar]
- 15. Kinne A, Kleinau G, Hoefig CS, et al. Essential molecular determinants for thyroid hormone transport and first structural implications for monocarboxylate transporter 8. J Biol Chem. 2010;285(36):28054–28063. [DOI] [PMC free article] [PubMed] [Google Scholar]
- 16. Geier EG, Schlessinger A, Fan H, et al. Structure-based ligand discovery for the large-neutral amino acid transporter 1, LAT-1. Proc Natl Acad Sci USA. 2013;110(14):5480–5485. [DOI] [PMC free article] [PubMed] [Google Scholar]
- 17. Hinz KM, Meyer K, Kinne A, Schülein R, Köhrle J, Krause G. Structural insights into thyroid hormone transport mechanisms of the L-type amino acid transporter 2. Mol Endocrinol. 2015:29(6):933–942. [DOI] [PMC free article] [PubMed] [Google Scholar]
- 18. Ugrasbul F, Ardinger HH. A patient presenting with central hypothyroidism, developmental delay and poor head control. Should we be checking T3 levels? Horm Res. 2009;72(suppl 3):458–459. [Google Scholar]
- 19. Capri Y, Friesema EC, Kersseboom S, et al. Relevance of different cellular models in determining the effects of mutations on SLC16A2/MCT8 thyroid hormone transporter function and genotype-phenotype correlation. Hum Mutat. 2013;34(7):1018–1025. [DOI] [PubMed] [Google Scholar]
- 20. Groeneweg S, Friesema EC, Kersseboom S, et al. The role of Arg445 and Asp498 in the human thyroid hormone transporter MCT8. Endocrinology. 2014;155(2):618–626. [DOI] [PubMed] [Google Scholar]
- 21. Braun D, Lelios I, Krause G, Schweizer U. Histidines in potential substrate recognition sites affect thyroid hormone transport by monocarboxylate transporter 8 (MCT8). Endocrinology. 2013;154(7):2553–2561. [DOI] [PubMed] [Google Scholar]
- 22. Mondal S, Schweizer U, Mugesh G. Chemistry and biology of thyroid hormone biosynthesis and action. Angew Chem Int Ed Engl. In press. [DOI] [PubMed] [Google Scholar]
- 23. Groeneweg S, Lima de Souza EC, Visser WE, Peeters RP, Visser TJ. Importance of His192 in the human thyroid hormone transporter MCT8 for substrate recognition. Endocrinology. 2013;154(7):2525–2532. [DOI] [PubMed] [Google Scholar]
- 24. Schweizer U, Schlicker C, Braun D, Köhrle J, Steegborn C. The crystal structure of mammalian selenocysteine-dependent iodothyronine deiodinase suggests a peroxiredoxin-like catalytic mechanism. Proc Natl Acad Sci USA. 2014;111(29):10526–10531. [DOI] [PMC free article] [PubMed] [Google Scholar]
- 25. Law CJ, Maloney PC, Wang DN. Ins and outs of major facilitator superfamily antiporters. Annu Rev Microbiol. 2008;62:289–305. [DOI] [PMC free article] [PubMed] [Google Scholar]
- 26. Kim DK, Kanai Y, Matsuo H, et al. The human T-type amino acid transporter-1: characterization, gene organization, and chromosomal location. Genomics. 2002;79(1):95–103. [DOI] [PubMed] [Google Scholar]
- 27. Kinne A, Roth S, Biebermann H, Köhrle J, Grüters A, Schweizer U. Surface translocation and tri-iodothyronine uptake of mutant MCT8 proteins are cell type-dependent. J Mol Endocrinol. 2009;43(6):263–271. [DOI] [PubMed] [Google Scholar]
- 28. Rathmann D, Rijntjes E, Lietzow J, Köhrle J. Quantitative analysis of thyroid hormone metabolites in cell culture samples using LC-MS/MS. Eur Thyroid. 2015;4(suppl 1):51–58. [DOI] [PMC free article] [PubMed] [Google Scholar]
- 29. Nancolas B, Sessions RB, Halestrap AP. Identification of key binding site residues of MCT1 for AR-C155858 reveals the molecular basis of its isoform selectivity. Biochem J. 2015;467(1):192. [DOI] [PubMed] [Google Scholar]
- 30. Huang Y, Lemieux MJ, Song J, Auer M, Wang DN. Structure and mechanism of the glycerol-3-phosphate transporter from Escherichia coli. Science. 2003;301(5633):616–620. [DOI] [PubMed] [Google Scholar]
- 31. Kinne A, Wittner M, Wirth EK, et al. Involvement of the L-type amino acid transporter Lat2 in the transport of 3,3′-diiodothyronine across the plasma membrane. Eur Thyroid. 2015;4(suppl 1):42–50. [DOI] [PMC free article] [PubMed] [Google Scholar]
- 32. Boccone L, Dessì V, Meloni A, Loudianos G. Allan-Herndon-Dudley syndrome (AHDS) in two consecutive generations caused by a missense MCT8 gene mutation. Phenotypic variability with the presence of normal serum T3 levels. Eur J Med Genet. 2013;56(4):207–210. [DOI] [PubMed] [Google Scholar]
- 33. Raymond L, Whibley A, Price S, et al. Raised T3 levels and mutations in MCT8 (SLC16A2) cause X-linked cerebral palsy and mental retardation. Poster presented at: The European Human Genetics Conference (ESHG) in Barcelona, Spain, 2008. [Google Scholar]
- 34. Jansen J, Friesema EC, Kester MH, Schwartz CE, Visser TJ. Genotype-phenotype relationship in patients with mutations in thyroid hormone transporter MCT8. Endocrinology. 2008;149(5):2184–2190. [DOI] [PMC free article] [PubMed] [Google Scholar]
- 35. Kim JH, Kim YM, Yum MS, et al. Clinical and endocrine features of two Allan-Herndon-Dudley syndrome patients with monocarboxylate transporter 8 mutations. Horm Res Paediatr. 2015;83(4):288–292. [DOI] [PubMed] [Google Scholar]
- 36. Kleinau G, Schweizer U, Kinne A, et al. Insights into molecular properties of the human monocarboxylate transporter 8 by combining functional with structural information. Thyroid Res. 2011;4(suppl 1):S4. [DOI] [PMC free article] [PubMed] [Google Scholar]
- 37. Roth S, Kinne A, Schweizer U. The tricyclic antidepressant desipramine inhibits T3 import into primary neurons. Neurosci Lett. 2010;478(1):5–8. [DOI] [PubMed] [Google Scholar]


