

Abstract
Multiple myeloma (MM) remains an incurable disease, with a treatment-refractory state eventually developing in all patients. Constant clonal evolution and genetic heterogeneity of MM are a likely explanation for the emergence of drug-resistant disease. Monitoring of MM genomic evolution on therapy by serial bone marrow biopsy is unfortunately impractical because it involves an invasive, painful procedure. Here, we describe how non-invasive and highly sensitive isolation and characterization of circulating tumor cells (CTCs) from peripheral blood at single cell resolution recapitulates MM in the bone marrow. We demonstrate that CTCs provide the same genetic information as bone marrow MM cells, and even reveal mutations with greater sensitivity than bone marrow biopsies in some cases. Single CTC RNA sequencing enables classification of MM and quantitative assessment of genes that are relevant for prognosis. We propose that the genomic characterization of CTCs should be included in clinical trials to follow the emergence of resistant subclones after MM therapy.
Introduction
Multiple myeloma (MM) is a bone marrow (BM) derived cancer of plasma cells characterized by multiple relapses and ultimate refractoriness to available therapies (1). Our goal was to ascertain whether rare circulating tumor cells (CTCs) obtained from peripheral blood could be used to interrogate the MM genome, as opposed to relying on bone marrow (BM) biopsy for such samples. BM biopsies are performed on > 25,000 new MM patients each year in the U.S. alone (http://seer.cancer.gov). Unfortunately, BM biopsy is an invasive procedure associated with pain, inconvenience, and expense. As a result, BM biopsies are typically limited to initial diagnosis and in some cases relapse, but are not routinely performed for monitoring treatment response. Similarly, whereas BM biopsy might in principle be useful as a way to monitor progression to MM from pre-malignant plasma cell dyscrasia (known as Monoclonal Gammopathy of Undetermined Significance (MGUS) (2, 3)), undergoing such invasive procedures repeatedly is entirely impractical. As such, surveillance is typically not pursued, and patients are treated only when overt MM disease becomes clinically evident.
We hypothesized that interrogating peripheral blood as a tumor source could have major clinical impact if it were able to provide reliable actionable information with respect to disease evolution and treatment. To achieve such a goal of non-invasive MM characterization, a method would be required to 1) be able to isolate CTCs from the peripheral blood of MM patients with exquisite sensitivity, 2) enable comprehensive genomic and transcriptomic analysis of CTCs, and 3) provide information on genomic aberrations in a quantitative manner. The ideal test would be able to detect the presence and subtype of MM, detect mutations that can guide therapy, and follow the evolution of MM over time. It would also yield insight into the genetic heterogeneity of MM and its evolution during treatment. In particular, a method capable of detecting the emergence of a drug-resistant MM clone could result in early therapeutic intervention.
Although previous studies have shown that myeloma CTCs are detectable by flow cytometry (4, 5), may serve as a predictor of survival (6), and have been shown to harbor chromosomal abnormalities seen in BM-derived MM samples (7), the sensitivity of flow cytometry is insufficient to detect myeloma CTCs in ∼25% of patients, even among patients with a high tumor burden (6). Furthermore, the mutational analysis of CTCs – essential for the elucidation of clonal heterogeneity in MM – has yet to be reported.
We describe here a method that allows for the isolation and genomic characterization of single MM CTCs. We show that the method has exquisite sensitivity and ability to elucidate MM genomic heterogeneity. The study suggests the potential of MM CTC analysis to replace BM biopsy and therefore makes it possible to bring quantitative disease monitoring to the characterization of patients with MM.
Results
Isolation and targeted sequencing of single myeloma CTCs and normal plasma cells
To determine how myeloma CTCs compare to myeloma in BM with regards to genomic and transcriptomic aberrations, we developed a method to enrich, purify, and perform DNA and RNA sequencing of single myeloma CTCs and BM-derived MM cells (Fig. 1A). The method was designed to a) be able to capture very rare cells (less than one per 105 in peripheral blood), b) enable single-cell analysis, so as to capture the well-described clonal heterogeneity of MM (8, 9), and c) not require prior knowledge of the patient's MM genomic aberrations.
Fig. 1. Isolation and phenotyping of single MM cells from blood and BM.
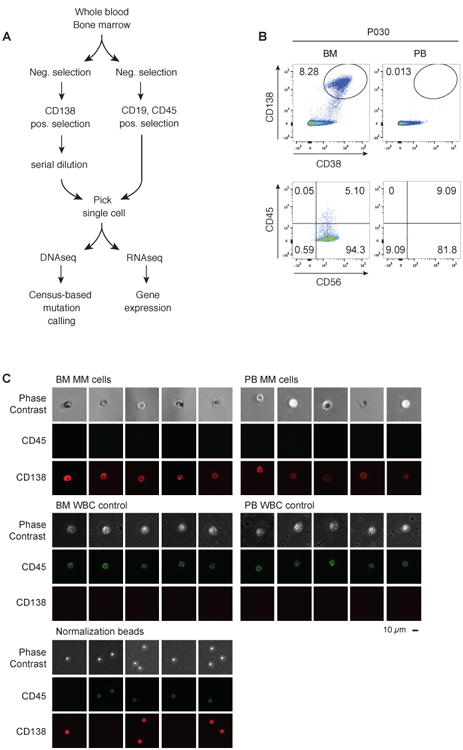
(A) Schematic overview of the experimental workflow for single-cell DNA and RNA sequencing of myeloma CTCs and BM-derived MM cells and WBC controls. (B) FACS plots from a representative MM patient (P030, see Table 1), with the upper panel showing the relative abundance of CD138+CD38+ plasma cells in bone marrow (BM) and peripheral blood (PB), and the lower panel showing expression of CD56 and CD45 of CD138+CD38+-gated cells. The numbers refer to the percentage of cells in the gate (top) or quadrant (bottom). (C) Sample micrographs of CD138+ plasma cells and CD138−CD45+ control single cells from P009, visualized with phase contrast and fluorescence microscopy. Single cells were normalized for fluorescence using 6 μm fluorescent beads; scale bar, 10 μm.
First, we determined the surface marker phenotype of myeloma CTCs by flow cytometry, revealing characteristic low expression of CD45 and variable expression of CD56 on the CD38+CD138+ plasma cells in peripheral blood and in BM, in contrast to normal white blood cells (WBC), which are CD45+CD138− (Fig. 1B and C, fig. S1) (10) and, normal plasma cells which are CD45+CD138+ (5, 11). Flow cytometry has only modest sensitivity and is unable to detect any CTCs in ∼25% of MM patients (6). Consistent with those reports, our analysis of 24 MM patient samples by flow cytometry (for CD138+CD38+ cells) was suboptimal in 13/24 cases (54%; defined as ≥1 CTC, but ≦ 10 CTCs per 105 white blood cells) and entirely negative (< 1 CTCs per 105) for CTCs in an additional 1/24 patients (4%) (Table 1). We therefore developed a method that allowed us to isolate single CTCs, even when they are detected at low frequency by flow cytometry. We used a combination of CD138+CD45− cell enrichment together with serial dilution and single-cell micromanipulation using fluorescence microscopy of live CD138+CD45− cells. Using this approach, we substantially improved MM CTC sensitivity: 100% of the 24 patient samples studied yielded at least 12 CTCs (Table 1).
Table 1. Quantification of CTCs by microscopy and FACS.
Blood was randomly obtained from 24 patients with MM, and the number of CTCs was detected by FACS, gating for live CD45loCD138+CD38+ cells, or by microscopy. The samples for which single-cell sequencing was performed are highlighted in gray. In all blood samples, at least 12 CTCs were detected by microscopy. Two time points were analyzed from patient 009.
| Samples | Number of CTCs by FACS (per 100,000) | Number of CTCs by microscopy (total) | Single cell sequencing performed |
|---|---|---|---|
| P009 - t1 | 0 | >16 | yes |
| P013 | 1 | >12 | no |
| P016 | 1 | >12 | no |
| P006 | 3 | >12 | no |
| P011 | 3 | >24 | yes |
| P012 | 3 | >12 | no |
| P004 | 4 | >12 | no |
| P027 | 4 | >24 | yes |
| P019 | 5 | >12 | no |
| P020 | 5 | >12 | no |
| P022 | 5 | >12 | no |
| P016 | 6 | >12 | no |
| P018 | 7 | >12 | no |
| P002 | 7 | >16 | yes |
| P014 | 13 | >12 | no |
| P021 | 13 | >24 | yes |
| P024 | 13 | >23 | yes |
| P030 | 13 | >24 | yes |
| P018 | 25 | >12 | no |
| P025 | 29 | >12 | no |
| P001 | 102 | >12 | yes |
| P009 - t2 | 162 | >24 | yes |
| P015 | 204 | >12 | no |
| P031 | 13708 | >24 | yes |
We next performed single-cell whole genome amplification (12), followed by PCR amplification of 35 loci designed to capture the most commonly mutated genes identified in large-scale MM whole exome sequencing studies from MM CTCs of 10 patients (table S1, table S2) (8). As a reference we also analyzed single bone marrow MM cells and CD19+ B lymphocytes and CD45+CD138− WBC, which were isolated from peripheral blood. A total of 568 single primary cells representing MM CTCs, bone marrow MM cells, CD19+ B lymphocytes, and CD45+CD138− WBCs were then subjected to massively parallel genome sequencing (table S3).
To determine the sensitivity of mutation detection in single cells with our method, we first processed 80 single cells from 4 MM cell lines with known mutations. A total of 72 single cells passed automated quality control metrics and were used to call mutations in. We detected 100% of the expected mutations with an average detection sensitivity of 93±9% (Fig. 2A).
Fig. 2. Defining the sensitivity of mutation detection and plasma cell isolation.

(A) Single cells were isolated from 4 different MM cell lines, and targeted DNA sequencing was performed on 20 single cells from each cell line. Poor quality libraries were eliminated, and somatic mutations were called on 19 U266 cells, 18 SKMM1 cells, 17 DP6 cells, and 18 MM. 1S cells. Each symbol represents a single cell, black symbol = mutation detected, empty symbol = mutation not detected. The six listed mutations have been published to be present in the indicated cell lines and are therefore assumed to be true positives (http://www.keatslab.org/myeloma-cell-lines/common-genetics, (34–37), and are expected to occur clonally, that is in every single cell (expected sensitivity = 1). The true average detection sensitivity±standard deviation for clonal mutations was calculated to be 93±9%. (B) To determine if the methodology allows robust isolation of plasma cells even from healthy donors, single CD138+CD45+ cells (PC) or, as a comparison, single CD45+ normal white blood cells (Nl) were isolated from the peripheral blood of a healthy blood donor. Single cell RNA sequencing was performed, and the gene expression of plasma cell markers (CD138, CD38, CD319) was determined in both groups, P values were calculated using Student's t-test. The bottom and top of the boxes represent the first (Q1) and third quartile (Q3), respectively, the band near the middle of the box represents the median, the upper and lower whiskers are located at the smaller of the maximum × value and Q3 + 1.5 IQR (the height of the box), and the larger of the smallest × value and Q1 – 1.5 IQR. (C) Gene Set Enrichment Analysis (GSEA) was performed for genes that were differentially expressed between CD138+CD45+ plasma cells and CD45+ WBC from a healthy blood donor. The signature with the highest normalized enrichment score (out of 1148) is shown (table S4).
Given our ability to detect MM CTCs even when they occur at low frequency in the blood, we hypothesized that we might even be able to isolate normal CD138+CD45− plasma cells from the peripheral blood of healthy blood donors. Plasma cells are exceedingly rare in healthy people (1 cell in 10,000-100,000 white blood cells). Using this approach, we isolated 10 plasma cells from a normal donor, and the cells were then subjected to RNA sequencing (RNA-Seq). Genes encoding surface epitopes such as CD319 (SLAMF7), CD138, and CD38 that are typically expressed on plasma cells, showed high levels of expression by single cell RNA-Seq compared to control white blood cells (Fig. 2B). Gene Set Enrichment Analysis (GSEA) (13) of single CD138+CD45−-isolated cells compared to CD45+CD138− WBC was highly significant for plasma cell signatures (P <0.0001, Wilcoxon Rank-Sum Test), thus validating our single cell RNA sequencing methods, and confirming the ability to isolate rare plasma cells from normal peripheral blood (Fig. 2C and table S4).
Genotyping and LOH analysis of single MM CTCs
Having established the methodology for single cell isolation and sequencing of MM cells, we next asked whether sequencing of single MM cells from the BM could reproduce sequencing results of “bulk” MM cells from the BM of a MM patient. We detected a KRAS Q61H mutation in the bulk BM MM cells from a patient, who was known to carry that mutation based on CLIA-certified testing (fig. S2). Indeed, the same KRAS Q61H was also observed in 12/19 single BM MM cells, thereby giving confidence in the single cell genotyping.
We next tested how single cell mutational analysis from BM cells compared to 1) clinical-grade genotyping (13) and 2) single cell mutational analysis from CTCs in a total of 9 patients. Mutational analysis of the 35 loci in 335 high quality single MM cells from the blood and BM of 9 patients (table S3) revealed the presence of a total of 12 mutations. First, we asked whether the single cell MM CTC sequencing could reproduce the KRAS Q61H and NRAS Q61R mutations detected in two patients who previously underwent bulk BM sequencing and genotyping in a CLIA-certified clinical lab. Indeed, the KRAS Q61H mutation was seen in 7/11 CTCs from one patient and the NRAS Q61R mutation was seen in 11/14 MM CTCs from the other patient (Fig. 3A). We also asked whether the mutational profile of single MM cells isolated from peripheral blood matched the mutational profile of single MM cells isolated from the BM. In three patients, somatic mutations were detected in the KRAS, BRAF, IRF4 and TP53 genes in single myeloma CTCs, and the same mutations were detected in single BM-derived MM cells (Fig. 3B). Thus, in our limited cohort, 100% of the targeted mutations that were detected by clinical-grade genotyping of bulk BM were also detected in single cell analysis of CTCs.
Fig. 3. Quantitative genotyping of single myeloma CTCs and BM from MM patients.

Mutational profiles of single myeloma CTCs and single MM cells from the BM of MM patients are shown. Single CD138+CD45− plasma cells were isolated from the peripheral blood or the BM of patients with MM, and their mutational profile was determined by targeted single cell DNA sequencing. All single cells are numbered consecutively for each patient. Rectangles (left) represent individual single cells, darker color fill reflects the presence of the mutation. Bar diagrams (right) represent the fraction of cells harboring the indicated mutations. Source of MM cells: blood (red), bone marrow (blue). (A) A KRAS Q61H and a NRAS Q61R mutation were detected in the indicated single myeloma CTCs of the first and the second patient, respectively. The same mutations were also detected in bulk bone marrow by CLIA-certified (cc) clinical routine genotyping. (B) Single myeloma CTCs from peripheral blood and single MM cells from BM were isolated from 3 individual MM patients (P030, P031, and P009 at time point 2 (t2), see Table 1 and table S1). No significant difference in the number of mutated MM cells was found between blood and BM (NS). Mutational status in bulk bone marrow by CLIA-certified genotyping is indicated (cc). (C) In 3 patients (P021, P011, P027, see Table 1 and table S1) mutations were detectable exclusively or at a higher frequency in single myeloma CTCs than in single MM cells from BM with statistical significance (P < 3.8 × 10⁻⁴). Mutational status in bulk bone marrow by CLIA-certified genotyping is indicated (cc) or the clinical routine test was unsuccessful (†). (D) The allelic fractions of mutations in single myeloma CTCs from two patients were analyzed to determine LOH (P009, P031). Each bar represents the allelic fraction of the indicated mutation in single MM cells. One patient harbored a BRAF and a TP53 mutation and another patient harbored a KRAS and a TP53 mutation. (E) LOH analysis of the mutations identified in (D). The cutoff for the P value (see Methods) was chosen as follows: P > 0.05 for heterozygous mutation, P < 0.05 for LOH. As a reference, the allelic fractions for a known homozygous TP53 A161 mutation (known hom) in U266 cells and all known heterozygous mutations (known het) are shown.
In some patients, the yield of recurrent MM somatic mutations was higher in CTCs compared to BM. Specifically, in three patients, the proportion of CTCs harboring TP53 R273C, BRAF G469A, and NRAS G13D mutations was higher than that observed in single cells isolated with the same procedure from BM (Fig. 3C), despite the fact that all cells demonstrated the aberrant malignant myeloma phenotype (CD138+CD45−). Moreover, in two of three patients, the routine clinical BM test failed to report these mutations due to insufficient sample material. These results were statistically significant, based on a binomial model we developed to test the difference between the number of mutated MM cells from the blood and the BM of an individual patient, accounting for possible variations in detection sensitivity (see Methods and fig. S3). The fact that we detected mutations with greater frequency in CTCs compared to BM is surprising, and suggests that more extensive genomic analysis of CTCs should be explored for its potential to be even more sensitive than the sampling of single BM aspirates (fig. S3).
We next considered whether it might be possible to infer loss of heterozygosity (LOH) from single cell sequencing data. While LOH analysis of individual mutations has become routine in bulk tumor sequencing analysis, it has yet to be demonstrated that such analysis is feasible in CTCs at the single cell level. Stochastic amplification of one allele over another (allelic bias) is a phenomenon that is well described in single cell sequencing (12). We postulated that since this allelic bias occurs randomly, consistent findings across multiple individual CTCs would signal allelic loss. That is, at a normal diploid locus, there would be no preferential amplification of one allele over another, whereas the observation of preferential abundance of one allele across each CTC would signal LOH. We therefore measured the allelic frequency of mutations that typically undergo LOH (for example, the tumor suppressor gene TP53), and compared that to the allelic frequency of mutations not expected to undergo LOH (for example, the oncogenes BRAF and KRAS). As predicted, we observed a random pattern of allelic fractions in CTCs from patients harboring BRAF G469E or KRAS G12C mutations, whereas the TP53 mutations R283C and R280T had allelic fractions > 0.9, consistent with LOH at that locus (Fig. 3D). To benchmark this approach, we determined the allelic fractions of all known heterozygous mutations that were detected in single cells from the 4 MM cell lines studied by this method (fig. S4). Using the distribution of allelic fractions of these known mutations as a benchmark, we determined that the BRAF G469E and a KRAS G12C mutation were predicted to be heterozygous as expected, where as the loci harboring a TP53 R273C and a TP53 R280T mutation were predicted to be associated with LOH, indicating either hemizygosity or homozygosity (copy number neutral LOH) at the mutated loci with high statistical confidence (Fig. 3E) (P<8.25×10⁻⁶, two-sample, two-tailed t-test, assuming unequal variances). We therefore conclude from these analyses that CTCs allow for detection of tumor suppressor-associated LOH.
High sensitivity of single-cell isolation and sequencing of CTC in patients with low tumor burden
Being able to characterize MM at various stages of disease evolution and treatment through sequencing of CTCs requires high sensitivity to detect genetic mutations when tumor burden may be low. We therefore tested whether our approach was sufficient to isolate CTCs from 1) a MM patient who had achieved a Very Good Partial Response to treatment (VGPR) and 2) a patient with MGUS. We first performed single cell isolation and DNA sequencing on Patient 9, in whom no CTCs were detected by FACS and who had achieved a VGPR (Fig. 4A, Table 1). Despite the low tumor burden, we readily detected a BRAF, TP53, and IRF4 mutation in CTCs isolated from peripheral blood (Fig. 4A). These mutations were also present at a later time point, when the patient had relapsed and thus had a much higher tumor burden with higher numbers of CTCs (Fig. 3B, Table 1). Of note, we observed a striking similarity in the clonal architecture of MM CTCs during remission and at relapse, suggesting that the treatment did not selectively kill particular subclones.
Fig. 4. Single-cell isolation and sequencing of CTCs at low tumor burden.

(A) Single myeloma CTCs from peripheral blood were isolated from patient P009 at a time point when the patient had a VGPR and no CTCs were detectable by FACS acquiring 100,000 cells (t1, see Table 1). Single CD138+CD45− plasma cells were isolated from the peripheral blood or the BM and the mutational profile was determined as described in Fig. 3. Mutational status in bulk bone marrow by CLIA-certified genotyping is indicated (cc). Bar diagrams (right) represent the fraction of cells harboring the indicated mutations. (B) Mutational profiles of a patient with MGUS in single plasma cells isolated from peripheral blood (red) and BM (blue). Clinical routine test from bulk bone marrow was not performed (*).
Overt MM is often preceded by clonal precursor states known as Monoclonal Gammopathy of Undetermined Significance (MGUS) and Smoldering Multiple Myeloma (SMM) (14, 15). The current standard of care in these patients involves refraining from treatment until clinically apparent MM develops, but with an increasing armamentarium of well-tolerated, clinically active MM drugs, there is interest in exploring earlier therapeutic intervention (16). Serial bone marrow biopsies in this otherwise healthy patient population are impractical and not routinely performed. We therefore tested whether our highly sensitive single cell isolation method would allow for isolation of aberrant plasma cells in an MGUS patient. We successfully isolated 20 CTCs from a patient with MGUS, and readily detected the presence of an NRAS Q61R mutation in 9/20 CTCs. This finding was confirmed in BM cells from the same patient, where 16/18 of plasma cells isolated from marrow revealed the identical NRAS mutation (Fig. 4B). These results suggest that CTC analysis can provide sufficient sensitivity to genotype single MM cells from patients with low tumor burden such as VGPR or MGUS.
Transcriptional profiling of single MM cells from blood and BM
Gene expression analysis is an important diagnostic tool in MM to establish lineage (plasma cell) identity, define subsets of the disease, and indicate the presence of chromosomal translocations that result in overexpression of key drivers of MM (17–19). MM diagnostics often use FACS analysis, initially as a 4-parameter panel of expression markers, and more recently as an 8-parameter panel (5). This approach provides sufficient resolution to allow the distinction of normal and malignant plasma cells (10), but lacks the ability to further classify subsets of MM.
Having demonstrated that mutational analysis of MM CTCs was possible, we next asked whether genome-wide expression analysis of MM CTCs was similarly feasible. We isolated 57 MM cells from the BM and peripheral blood of two patients. 52/57 (91%) CTCs yielded high quality RNA sequencing data, which were subjected to further analysis. Unbiased RNA sequencing allowed for the distinction of cell types with single cell resolution and high molecular detail, averaging >3,700 transcripts per cell (table S5). Single-cell RNA sequencing allowed for a clear distinction between normal plasma cells and MM cells, based on analysis of CD45, CD27, and CD56 alone (Fig. 5A), three markers that are well established to distinguish normal from malignant plasma cells by flow cytometry (20). Furthermore, unsupervised hierarchical clustering of detected transcripts in single cells enabled the distinction of normal from malignant plasma cells in an unbiased, objective fashion (table S5, Fig. 5B). We next determined the correlation between single cell expression profiles of MM CTCs, BM MM cells, and single CD19+ B cells from two patients (Fig. 6A). Interestingly, the profile of MM cells between the 2 patients differed substantially, while clearly being distinct from that of normal B cells (Fig. 6A), suggesting that these 2 patients may have different subtypes of MM.
Fig. 5. Comparing CTCs and BM MM cells by single cell RNA sequencing.
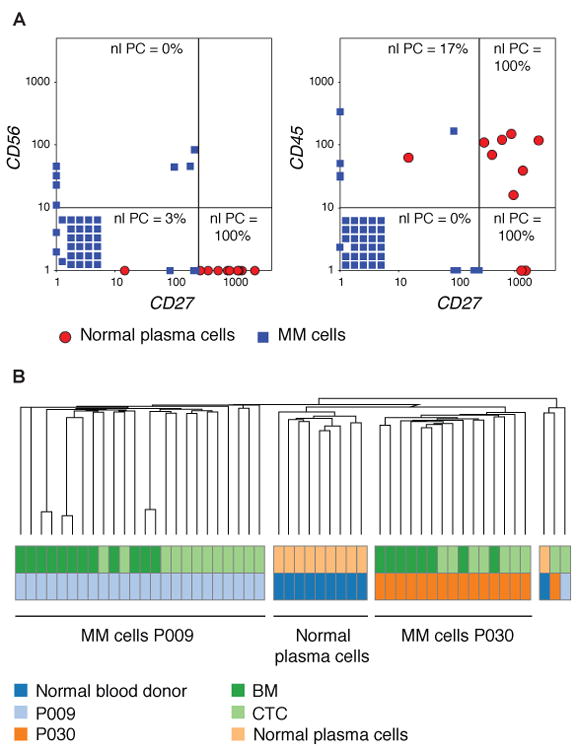
(A) Single CD138+CD45+ plasma cells were isolated from the peripheral blood of a healthy blood donor, and single CD138+CD45− plasma cells and CD19+ B lymphocytes were isolated from the peripheral blood of two patients with MM. Single cell whole transcriptome RNA sequencing was performed, and the gene expression in transcripts per million (TPM) of CD56, CD27, and CD45 is plotted for all MM cells (CTCs and BM derived) from patients P009 and P030 (blue squares) and of plasma cells from blood of a healthy donor (red circles). Cells with an expression = 0 for the indicated genes were set = 1 and stacked in the lower left corner. The percentage of normal plasma cells that is present in each quadrant is shown. Separation lines were placed to achieve the maximum difference between the quadrant with the highest and the quadrant with the lowest percentage of normal PC. (B) Unsupervised hierarchical clustering of gene expression by RNA-Seq using Spearman rank correlation of single MM cells (CTCs and BM derived) from two patients (P009 and P030) and plasma cells from the blood of a healthy blood donor was performed.
Fig. 6. Classification by single cell RNA sequencing.

(A) Single CD138+CD45− cells from the blood (CTC) or bone marrow (BM) or CD19+ B lymphocytes (B-cell) from the blood were isolated from two patients with MM (P009 and P030). Hierarchical clustering of gene expression by RNA-Seq of individual single MM CTCs, BM MM cells, and B cells from both patients using Pearson correlation was performed and is displayed as a distance matrix. Each square is color-coded and represents the correlation between two individual cells from 0 to 1. (B) The mean mRNA expression in MM CTCs, BM MM cells, and CD19+ B cells is shown for CD38, SLAMF7, BCMA, CD19, PAX5, and CIITA.
Precision medicine becomes increasingly relevant for the treatment of MM. For instance, two monoclonal antibodies, daratumumab and elotuzumab, were recently approved by the FDA for the treatment of relapsed/refractory MM. These antibodies target antigens (CD38 and SLAMF7, respectively), which are expressed at much higher levels on MM cells than on other blood cells. Being able to define molecules that are highly expressed on MM cells, but not on less differentiated B cells, may therefore provide clinical utility. Transcript expression of the therapeutically relevant molecules CD38, SLAMF7, and BCMA (21), was almost exclusively detected in MM CTCs and BM MM cells (Fig. 6B) but not on normal B cells. In contrast, CD19, CIITA, and PAX5, which are well-known to be expressed only during earlier stages of B cell differentiation (22–25), were only expressed in normal B cells (Fig. 6B). These data demonstrate that gene expression profiling of MM CTCs by RNA sequencing reproduces gene expression of bone marrow MM cells and can be used to detect the expression of targetable antigens.
We next asked whether single cell CTC expression analysis could be used to infer the existence of key MM chromosomal translocations or facilitate transcript-based MM classification (Fig. 7). For example, the t(11;14) translocation that results in Cyclin D1 (CCND1) overexpression by virtue of juxtaposition with the immunoglobulin heavy chain locus and the t(6;14) translocation that similarly results in overexpression of Cyclin D3 (CCND3) are important markers for MM clinical risk stratification (26), and high expression levels of these genes are indicative of translocation (27). To address the feasibility of using CTC RNA-Seq to identify such translocations, we identified the most differentially expressed genes comparing single MM CTCs to normal B lymphocytes (fig. S5). CCND1 was highly upregulated in single MM cells from the blood and BM of patient 9, whose MM was found by FISH analysis to indeed harbor a t(11;14) translocation (table S1). Similarly, patient 30 carried a t(6;14) translocation, and those CTCs overexpressed CCND3 (Fig. 7). These results suggest the feasibility of CTC single cell gene expression profiling for the diagnosis and classification of MM.
Fig. 7. Translocation detection by single cell RNA sequencing.

Single CD138+CD45− cells from the blood (CTC) or bone marrow (BM) or CD19+ B lymphocytes (B-cell) from the blood were isolated from two patients with MM (P009 and P030). Gene expression of CD19 (expressed on normal B cells), CD138, CD319 (expressed on MM cells), CCND1, and CCND3 is shown. P009 harbored a t(11;14) translocation resulting in CCND1/IGH fusion, P030 harbored a t(6;14) translocation resulting in CCND3/IGH fusion. Each bar in the histogram represents the amount of transcript (TPM) by RNA sequencing of one individual cell.
Discussion
Nearly 100% of patients with MM respond to initial therapeutic regimens, and in 2015 alone seven new medications were FDA approved for the treatment of myeloma. Nonetheless, nearly all patients with MM eventually develop drug resistance and die of their disease. Determining the mechanisms of drug resistance is therefore imperative, ideally before the patient experiences clinically evident relapsed disease. While FACS analysis of bone marrow (or peripheral blood) has the potential to detect recurrence of MM, it does not reveal detailed molecular information, and thus is of limited utility to guide therapeutic intervention. In contrast, the CTC approach described here can be applied to detecting single MM cells in blood or BM with a sensitivity similar to that of minimal residual disease (MRD) diagnosis by FACS (≤1:105), but additionally able to provide high quality molecular analysis. The existence of circulating MM cells has been previously reported (6, 28), but extensive genomic characterization has not been feasible given the very small numbers of CTCs. Our methodology using sensitive serial dilution and single cell isolation coupled with whole genome amplification makes comprehensive genomic analysis possible. The approach also provides robust transcriptomic profiling with >3700 parameters on average, all with single cell resolution, yielding important information about cancer drivers and therapeutic targets. We note that although the microscopy-based isolation method described here was found to be highly effective, cost-efficient, and easily adapted with a standard fluorescence microscope, it can be readily applied to workflows using commercially available microscopic micromanipulation systems. Moreover, a number of alternate isolation techniques have been described (29), ranging from high speed flow cytometric cell sorting to microfluidic cell isolation devices, which also warrant exploration in the analysis of MM CTCs.
Drug resistance can arise through multiple mechanisms, including the clonal selection of genetically distinct subclones. The ability to track the genetic evolution of MM could reveal emerging drug resistance mechanisms that might point to early intervention with mechanism-driven therapies. Similarly, the ability to track the acquisition of mutations associated with progression from pre-malignant states to overt MM might afford an opportunity to therapeutically intervene before the total body tumor burden reaches a point at which rare cells harboring resistance mechanisms are inevitable. Unfortunately, serial monitoring of bone marrow for the presence of molecularly evolving MM cells has proven clinically impractical. The procedure is painful, requires expert personnel, and involves a limited sampling of the bone marrow space. For these reasons, extensive molecular monitoring of patients at risk for MM and of patients undergoing MM therapy simply does not occur. We successfully identified CTCs in all 24 randomly selected patients in the study, suggesting a detection sensitivity similar to MRD diagnosis by FACS (∼1:105 or better). These data indicate that isolation of CTCs is possible from a patient at multiple time points during the course of MM.
We found that single myeloma CTCs faithfully reproduce the pattern of somatic mutations present in MM in the bone marrow, and identified several actionable oncogenes in CTCs, including BRAF activating mutations, against which BRAF inhibitors have been shown to be effective (30, 31). We similarly found a KRAS G12C mutation, against which allosteric inhibitors are being developed (32). In addition, we could detect LOH at the single cell level. This can be useful in the clinical interpretation of cancer genomes because mutation of one allele coupled to loss of the wild-type allele is a signature of a tumor suppressor gene – whether previously recognized as such or not. Furthermore, single cell RNA sequencing accurately identified chromosomal translocations resulting in over-expression of key MM-associated oncogenes. Taken together, these results indicate that non-invasive isolation of single MM cells from peripheral blood is feasible, and deep genomic characterization of such cells is similarly possible.
Of note, we identified several driver mutations that were more abundant in circulating MM cells from blood compared to BM. One explanation for this discrepancy is the sampling error of BM biopsies, which are typically performed from a single anatomic site. Since MM is a multifocal disease, genetically heterogeneous driver mutations may not be detectable if only a single BM site is sampled. Peripheral blood myeloma cells, circulating throughout the body, may reduce sampling bias. Larger studies will be required to determine whether “blood biopsy” indeed outperforms BM biopsy by providing greater sensitivity to detect somatic mutations.
The experiments performed here represent a proof-of-concept study to demonstrate feasibility of MM CTC genomic analysis, which allows comprehensive characterization of MM cells in blood or in the BM with high sensitivity and single cell resolution. With such a method in hand, it will now be possible to perform large-scale clinical studies to a) systematically compare CTC to BM sampling across diverse patient populations, and b) perform deep, longitudinal analysis of patients with exquisite resolution.
However, the limitations of our approach should also be taken into consideration. First, we found that analysis of MM CTCs can reveal mutations that are not detected by sequencing of the BM, most likely reflecting the extensive genetic heterogeneity (subclonality) of this disease. Whether the ability to detect such subclones is clinically important remains to be determined. In principle, the detection of drug resistance mutations, even if present in only a subset of tumor cells, could signal the need for therapeutic intervention. Second, although our proof-of-concept study suggests the potential of CTC sequencing to monitor response to therapy, larger studies will be required to establish the utility of the approach. Specifically, whether early therapeutic intervention after CTC-based detection of relapse results in improved clinical outcomes remains to be determined, particularly in patients who achieve complete response or are negative for minimal residual disease after increasingly effective MM therapy. Similarly, the clinical utility of using CTC sequencing to monitor patients at risk of progressing from MGUS to MM has yet to be established. Nevertheless, the testing of MM-preventative interventions would presumably be applied first to those MGUS patients showing evidence of molecular evolution consistent with transition to MM.
We report the analysis of the 35 most commonly mutated loci in MM, but the approach can readily be extended to broader analyses such as whole exome or whole genome sequencing. Although such comprehensive analyses may be cost prohibitive for large-scale population monitoring at this time (for example, to non-invasively document the molecular epidemiology of premalignant progression from MGUS to MM), sequencing costs are likely to continue to drop in the future, making such studies feasible. Regardless of the number of genes analyzed, we propose that it is now time to incorporate deep molecular analysis of the peripheral blood into the characterization of MM patients undergoing clinical investigation.
Materials and Methods
Study design
This study was a nonrandomized laboratory study designed to determine the feasibility of isolation and single cell DNA sequencing of single MM cells from blood (CTCs) and bone marrow (BM), and to compare the results to Clinical Laboratory Improvement Amendments (CLIA) grade clinical routine genotyping results of the BM. CD45+ WBC or CD19+ B lymphocytes were used as matched normal controls. RNA sequencing of single cells was used to investigate the gene expression profile of myeloma CTCs and their capacity for classification, to determine differentiation, and to infer translocations. Sample size was dictated by the rate of patient accrual and sample collection. The investigators were blinded to the clinical routine genotyping results prior to sequencing and mutation calling from single cells.
Study subjects
Eligible patients were patients with a diagnosis of multiple myeloma or MGUS. Inclusion of patients in this proof-of-concept study was based on availability of blood and BM samples. Patients who previously underwent CLIA-certified genotyping of bulk BM in the context of clinical routine (SNAPSHOT) (33) were prioritized to be included in this study. No other selection criteria were implemented prior to patient selection. All patients provided written informed consent to allow the collection of tissue and blood and the analysis for research purposes (DFCI Protocol # 01-300, DFCI Protocol # 13-583). De-identified blood and bone marrow specimens were prospectively collected from eligible patients in EDTA tubes, transported on ice, and processed within 3 h. Processing of samples at the Broad Institute was performed under the Massachusetts Institute of Technology Committee on the Use of Humans and Experimental Subjects (MIT COUHES) protocol # 0910003469. Blood collected from a healthy donor was obtained from Research Blood Components, LLC. Clinical information of included patients is shown in table S1.
Supplementary Material
Fig. S1. Single cell fluorescence microscopy.
Fig. S2. Single cell and bulk DNA sequencing of MM cells from bone marrow.
Fig. S3. Comparison of numbers of MM cells with mutations in blood and BM.
Fig. S4. Allelic fraction of mutations in single cells from MM cell lines.
Fig. S5. Comparative marker selection analysis of CTCs from two individual MM patients.
Table S1. Clinical data of MM patients for whom single cell sequencing was performed.
Table S2. Primer sequences used in single cell targeted DNA sequencing.
Table S3. Targeted next-generation sequencing libraries of single cell DNA.
Table S4. Summary of GSEA results for normal plasma cells.
Table S5. Gene expression of MM CTCs and BM cells by single cell RNA sequencing.
Acknowledgments
We would like to thank Kenneth C. Anderson, David K. Thomas and Mara Rosenberg for discussion and critical comments on the manuscript, and Jadwiga Grabarek for helpful discussions. DP6 cells were a generous gift from Diane Jelinek, Mayo Clinic.
Funding: This project was supported by an award from the National Cancer Institute (K08CA191026) to J.G.L, a research fellow award from the Multiple Myeloma Research Foundation (MMRF) to J.G.L., the Wong Family award (J.G.L), and the Howard Hughes Medical Institute (T.R.G.).
Footnotes
Author Contributions: J.G.L. and S.K. designed and performed experiments, analyzed data, and wrote the manuscript. J.G. and Y.D. developed computational methods, analyzed data, and wrote the manuscript. B.K. analyzed data and wrote the manuscript. M.J.C. performed single-cell RNA sequencing. D.G. developed methodology for targeted sequencing. N.B. acquired samples and analyzed clinical data. B.W. performed data visualization. A.J.Y. provided samples and designed experiments. G.H., C.Z.Z, and G.G. developed computational methods and analyzed data. M.M. supervised data analysis, N.R. provided project leadership, coordinated sample acquisition, clinical data integration and wrote the manuscript. J.S.B. and T.R.G. provided overall project leadership, supervised the analysis and wrote the manuscript. All authors discussed the results and implications and reviewed the manuscript.
Competing interests: T.R.G. and M.M. are founders and consultants to Foundation Medicine, Inc., a provider of cancer genome-based diagnostic testing.
Data and materials availability: The data described in this manuscript are accessible through the Multiple Myeloma Genomics Portal (MMGP, http://www.broadinstitute.org/mmgp/home).
References and notes
- 1.Kyle RA, Rajkumar SV. Multiple myeloma. N Engl J Med. 2004;351:1860–1873. doi: 10.1056/NEJMra041875. [DOI] [PubMed] [Google Scholar]
- 2.Landgren O, Kyle RA, Pfeiffer RM, Katzmann JA, Caporaso NE, Hayes RB, Dispenzieri A, Kumar S, Clark RJ, Baris D, Hoover R, Rajkumar SV. Monoclonal gammopathy of undetermined significance (MGUS) consistently precedes multiple myeloma: a prospective study. Blood. 2009;113:5412–5417. doi: 10.1182/blood-2008-12-194241. [DOI] [PMC free article] [PubMed] [Google Scholar]
- 3.Weiss BM, Abadie J, Verma P, Howard RS, Kuehl WM. A monoclonal gammopathy precedes multiple myeloma in most patients. Blood. 2009;113:5418–5422. doi: 10.1182/blood-2008-12-195008. [DOI] [PMC free article] [PubMed] [Google Scholar]
- 4.Gonsalves WI, Morice WG, Rajkumar V, Gupta V, Timm MM, Dispenzieri A, Buadi FK, Lacy MQ, Singh PP, Kapoor P, Gertz MA, Kumar SK. Quantification of clonal circulating plasma cells in relapsed multiple myeloma. Br J Haematol. 2014;167:500–505. doi: 10.1111/bjh.13067. [DOI] [PMC free article] [PubMed] [Google Scholar]
- 5.Paiva B, Paino T, Sayagues JM, Garayoa M, San-Segundo L, Martín M, Mota I, Sanchez ML, Bárcena P, Aires-Mejia I, Corchete L, Jimenez C, Garcia-Sanz R, Gutierrez NC, Ocio EM, Mateos MV, Vidriales MB, Orfao A, San Miguel JF. Detailed characterization of multiple myeloma circulating tumor cells shows unique phenotypic, cytogenetic, functional, and circadian distribution profile. Blood. 2013;122:3591–3598. doi: 10.1182/blood-2013-06-510453. [DOI] [PubMed] [Google Scholar]
- 6.Nowakowski GS, Witzig TE, Dingli D, Tracz MJ, Gertz MA, Lacy MQ, Lust JA, Dispenzieri A, Greipp PR, Kyle RA, Rajkumar SV. Circulating plasma cells detected by flow cytometry as a predictor of survival in 302 patients with newly diagnosed multiple myeloma. Blood. 2005;106:2276–2279. doi: 10.1182/blood-2005-05-1858. [DOI] [PMC free article] [PubMed] [Google Scholar]
- 7.Zandecki M, Bernardi F, Genevieve F, Laï JL, Preudhomme C, Flactif M, Cosson A, Bauters F, Facon T. Involvement of peripheral blood cells in multiple myeloma: chromosome changes are the rule within circulating plasma cells but not within B lymphocytes. Leukemia. 1997;11:1034–1039. [PubMed] [Google Scholar]
- 8.Lohr JG, Stojanov P, Carter SL, Cruz-Gordillo P, Lawrence MS, Auclair D, Sougnez C, Knoechel B, Gould J, Saksena G, Cibulskis K, McKenna A, Chapman MA, Straussman R, Levy J, Perkins LM, Keats JJ, Schumacher SE, Rosenberg M . Multiple Myeloma Research Consortium. Widespread genetic heterogeneity in multiple myeloma: implications for targeted therapy. In: Getz G, Golub TR, editors. Cancer Cell. Vol. 25. 2014. pp. 91–101. [DOI] [PMC free article] [PubMed] [Google Scholar]
- 9.Bolli N, Avet-Loiseau H, Wedge DC, Van Loo P, Alexandrov LB, Martincorena I, Dawson KJ, Iorio F, Nik-Zainal S, Bignell GR, Hinton JW, Li Y, Tubio JMC, McLaren S, O' Meara S, Butler AP, Teague JW, Mudie L, Anderson E, Rashid N, Tai YT, Shammas MA, Sperling AS, Fulciniti M, Richardson PG, Parmigiani G, Magrangeas F, Minvielle S, Moreau P, Attal M, Facon T, Futreal PA, Anderson KC, Campbell PJ, Munshi NC. Heterogeneity of genomic evolution and mutational profiles in multiple myeloma. Nat Commun. 2014;5:2997. doi: 10.1038/ncomms3997. [DOI] [PMC free article] [PubMed] [Google Scholar]
- 10.Mailankody S, Korde N, Lesokhin AM, Lendvai N, Hassoun H, Stetler-Stevenson M, Landgren O. Minimal residual disease in multiple myeloma: bringing the bench to the bedside. Nat Rev Clin Oncol. 2015;12:286–295. doi: 10.1038/nrclinonc.2014.239. [DOI] [PMC free article] [PubMed] [Google Scholar]
- 11.Billadeau D, Van Ness B, Kimlinger T, Kyle RA, Therneau TM, Greipp PR, Witzig TE. Clonal circulating cells are common in plasma cell proliferative disorders: a comparison of monoclonal gammopathy of undetermined significance, smoldering multiple myeloma, and active myeloma. Blood. 1996;88:289–296. [PubMed] [Google Scholar]
- 12.Lohr JG, Adalsteinsson VA, Cibulskis K, Choudhury AD, Rosenberg M, Cruz-Gordillo P, Francis JM, Zhang CZ, Shalek AK, Satija R, Trombetta JJ, Lu D, Tallapragada N, Tahirova N, Kim S, Blumenstiel B, Sougnez C, Lowe A, Wong B, Auclair D, Van Allen EM, Nakabayashi M, Lis RT, Lee GSM, Li T, Chabot MS, Ly A, Taplin ME, Clancy TE, Loda M, Regev A, Meyerson M, Hahn WC, Kantoff PW, Golub TR, Getz G, Boehm JS, Love JC. Whole-exome sequencing of circulating tumor cells provides a window into metastatic prostate cancer. Nat Biotechnol. 2014;32:479–484. doi: 10.1038/nbt.2892. [DOI] [PMC free article] [PubMed] [Google Scholar]
- 13.Subramanian A, Tamayo P, Mootha VK, Mukherjee S, Ebert BL, Gillette MA, Paulovich A, Pomeroy SL, Golub TR, Lander ES, Mesirov JP. Gene set enrichment analysis: a knowledge-based approach for interpreting genome-wide expression profiles. Proc Natl Acad Sci U S A. 2005;102:15545–15550. doi: 10.1073/pnas.0506580102. [DOI] [PMC free article] [PubMed] [Google Scholar]
- 14.Rajkumar SV, Dimopoulos MA, Palumbo A, Blade J, Merlini G, Mateos MV, Kumar S, Hillengass J, Kastritis E, Richardson P, Landgren O, Paiva B, Dispenzieri A, Weiss B, LeLeu X, Zweegman S, Lonial S, Rosinol L, Zamagni E, Jagannath S, Sezer O, Kristinsson SY, Caers J, Usmani SZ, Lahuerta JJ, Johnsen HE, Beksac M, Cavo M, Goldschmidt H, Terpos E, Kyle RA, Anderson KC, Durie BGM, Miguel JFS. International Myeloma Working Group updated criteria for the diagnosis of multiple myeloma. Lancet Oncol. 2014;15:e538–548. doi: 10.1016/S1470-2045(14)70442-5. [DOI] [PubMed] [Google Scholar]
- 15.Mateos MV. Advances in the management of asymptomatic myeloma. Curr Opin Oncol. 2014;26:670–676. doi: 10.1097/CCO.0000000000000121. [DOI] [PubMed] [Google Scholar]
- 16.Korde N, Kristinsson SY, Landgren O. Monoclonal gammopathy of undetermined significance (MGUS) and smoldering multiple myeloma (SMM): novel biological insights and development of early treatment strategies. Blood. 2011;117:5573–5581. doi: 10.1182/blood-2011-01-270140. [DOI] [PMC free article] [PubMed] [Google Scholar]
- 17.Zhan F, Tian E, Bumm K, Smith R, Barlogie B, Shaughnessy J. Gene expression profiling of human plasma cell differentiation and classification of multiple myeloma based on similarities to distinct stages of late-stage B-cell development. Blood. 2003;101:1128–1140. doi: 10.1182/blood-2002-06-1737. [DOI] [PubMed] [Google Scholar]
- 18.Magrangeas F, Nasser V, Avet-Loiseau H, Loriod B, Decaux O, Granjeaud S, Bertucci F, Birnbaum D, Nguyen C, Harousseau JL, Bataille R, Houlgatte R, Minvielle S. Gene expression profiling of multiple myeloma reveals molecular portraits in relation to the pathogenesis of the disease. Blood. 2003;101:4998–5006. doi: 10.1182/blood-2002-11-3385. [DOI] [PubMed] [Google Scholar]
- 19.Fonseca R, Monge J, Dimopoulos MA. Staging and prognostication of multiple myeloma. Expert Rev Hematol. 2014;7:21–31. doi: 10.1586/17474086.2014.882224. [DOI] [PMC free article] [PubMed] [Google Scholar]
- 20.van Dongen JJM, Lhermitte L, Böttcher S, Almeida J, van der Velden VHJ, Flores-Montero J, Rawstron A, Asnafi V, Lécrevisse Q, Lucio P, Mejstrikova E, Szczepański T, Kalina T, de Tute R, Brüggemann M, Sedek L, Cullen M, Langerak AW, Mendonça A, Macintyre E, Martin-Ayuso M, Hrusak O, Vidriales MB, Orfao A. EuroFlow antibody panels for standardized n-dimensional flow cytometric immunophenotyping of normal, reactive and malignant leukocytes. Leukemia. 2012;26:1908–1975. doi: 10.1038/leu.2012.120. [DOI] [PMC free article] [PubMed] [Google Scholar]
- 21.Tai YT, Anderson KC. Targeting B-cell maturation antigen in multiple myeloma. Immunotherapy. 2015;7:1187–1199. doi: 10.2217/imt.15.77. [DOI] [PMC free article] [PubMed] [Google Scholar]
- 22.Caligaris-Cappio F, Bergui L, Tesio L, Pizzolo G, Malavasi F, Chilosi M, Campana D, van Camp B, Janossy G. Identification of malignant plasma cell precursors in the bone marrow of multiple myeloma. J Clin Invest. 1985;76:1243–1251. doi: 10.1172/JCI112080. [DOI] [PMC free article] [PubMed] [Google Scholar]
- 23.Dellabona P, Latron F, Maffei A, Scarpellino L, Accolla RS. Transcriptional control of MHC class II gene expression during differentiation from B cells to plasma cells. J Immunol Baltim Md 1950. 1989;142:2902–2910. [PubMed] [Google Scholar]
- 24.Latron F, Jotterand-Bellomo M, Maffei A, Scarpellino L, Bernard M, Strominger JL, Accolla RS. Active suppression of major histocompatibility complex class II gene expression during differentiation from B cells to plasma cells. Proc Natl Acad Sci U S A. 1988;85:2229–2233. doi: 10.1073/pnas.85.7.2229. [DOI] [PMC free article] [PubMed] [Google Scholar]
- 25.Nera KP, Lassila O. Pax5--a critical inhibitor of plasma cell fate. Scand J Immunol. 2006;64:190–199. doi: 10.1111/j.1365-3083.2006.01809.x. [DOI] [PubMed] [Google Scholar]
- 26.Chesi M, Bergsagel PL. Molecular pathogenesis of multiple myeloma: basic and clinical updates. Int J Hematol. 2013;97:313–323. doi: 10.1007/s12185-013-1291-2. [DOI] [PMC free article] [PubMed] [Google Scholar]
- 27.Bergsagel PL, Kuehl WM. Critical roles for immunoglobulin translocations and cyclin D dysregulation in multiple myeloma. Immunol Rev. 2003;194:96–104. doi: 10.1034/j.1600-065x.2003.00052.x. [DOI] [PubMed] [Google Scholar]
- 28.Vij R, Mazumder A, Klinger M, O'Dea D, Paasch J, Martin T, Weng L, Park J, Fiala M, Faham M, Wolf J. Deep sequencing reveals myeloma cells in peripheral blood in majority of multiple myeloma patients. Clin Lymphoma Myeloma Leuk. 2014;14:131–139.e1. doi: 10.1016/j.clml.2013.09.013. [DOI] [PubMed] [Google Scholar]
- 29.Hyun KA, Kim J, Gwak H, Jung HI. Isolation and enrichment of circulating biomarkers for cancer screening, detection, and diagnostics. The Analyst. 2016;141:382–392. doi: 10.1039/c5an01762a. [DOI] [PubMed] [Google Scholar]
- 30.Andrulis M, Lehners N, Capper D, Penzel R, Heining C, Huellein J, Zenz T, von Deimling A, Schirmacher P, Ho AD, Goldschmidt H, Neben K, Raab MS. Targeting the BRAF V600E mutation in multiple myeloma. Cancer Discov. 2013;3:862–869. doi: 10.1158/2159-8290.CD-13-0014. [DOI] [PubMed] [Google Scholar]
- 31.Sharman JP, Chmielecki J, Morosini D, Palmer GA, Ross JS, Stephens PJ, Stafl J, Miller VA, Ali SM. Vemurafenib response in 2 patients with posttransplant refractory BRAF V600E-mutated multiple myeloma. Clin Lymphoma Myeloma Leuk. 2014;14:e161–163. doi: 10.1016/j.clml.2014.06.004. [DOI] [PubMed] [Google Scholar]
- 32.Ostrem JM, Peters U, Sos ML, Wells JA, Shokat KM. K-Ras (G12C) inhibitors allosterically control GTP affinity and effector interactions. Nature. 2013;503:548–551. doi: 10.1038/nature12796. [DOI] [PMC free article] [PubMed] [Google Scholar]
- 33.Dias-Santagata D, Akhavanfard S, David SS, Vernovsky K, Kuhlmann G, Boisvert SL, Stubbs H, McDermott U, Settleman J, Kwak EL, Clark JW, Isakoff SJ, Sequist LV, Engelman JA, Lynch TJ, Haber DA, Louis DN, Ellisen LW, Borger DR, Iafrate AJ. Rapid targeted mutational analysis of human tumours: a clinical platform to guide personalized cancer medicine. EMBO Mol Med. 2010;2:146–158. doi: 10.1002/emmm.201000070. [DOI] [PMC free article] [PubMed] [Google Scholar]
- 34.Gong B, Almasan A. Differential upregulation of p53-responsive genes by genotoxic stress in hematopoietic cells containing wild-type and mutant p53. Gene Expr. 1999;8:197–206. [PMC free article] [PubMed] [Google Scholar]
- 35.Steinbrunn T, Stuhmer T, Gattenlohner S, Rosenwald A, Mottok A, Unzicker C, Einsele H, Chatterjee M, Bargou RC. Mutated RAS and constitutively activated Akt delineate distinct oncogenic pathways, which independently contribute to multiple myeloma cell survival. Blood. 2011;117:1998–2004. doi: 10.1182/blood-2010-05-284422. [DOI] [PubMed] [Google Scholar]
- 36.Leich E, Weiβbach S, Klein HU, Grieb T, Pischimarov J, Stühmer T, Chatterjee M, Steinbrunn T, Langer C, Eilers M, Knop S, Einsele H, Bargou R, Rosenwald A. Multiple myeloma is affected by multiple and heterogeneous somatic mutations in adhesion- and receptor tyrosine kinase signaling molecules. Blood Cancer J. 2013;3:e102. doi: 10.1038/bcj.2012.47. [DOI] [PMC free article] [PubMed] [Google Scholar]
- 37.Chesi M, Brents LA, Ely SA, Bais C, Robbiani DF, Mesri EA, Kuehl WM, Bergsagel PL. Activated fibroblast growth factor receptor 3 is an oncogene that contributes to tumor progression in multiple myeloma. Blood. 2001;97:729–736. doi: 10.1182/blood.v97.3.729. [DOI] [PubMed] [Google Scholar]
- 38.Rachlin J, Ding C, Cantor C, Kasif S. MuPlex: multi-objective multiplex PCR assay design. Nucleic Acids Res. 2005;33:W544–547. doi: 10.1093/nar/gki377. [DOI] [PMC free article] [PubMed] [Google Scholar]
- 39.McKenna A, Hanna M, Banks E, Sivachenko A, Cibulskis K, Kernytsky A, Garimella K, Altshuler D, Gabriel S, Daly M, DePristo MA. The Genome Analysis Toolkit: a MapReduce framework for analyzing next-generation DNA sequencing data. Genome Res. 2010;20:1297–1303. doi: 10.1101/gr.107524.110. [DOI] [PMC free article] [PubMed] [Google Scholar]
- 40.Cibulskis K, Lawrence MS, Carter SL, Sivachenko A, Jaffe D, Sougnez C, Gabriel S, Meyerson M, Lander ES, Getz G. Sensitive detection of somatic point mutations in impure and heterogeneous cancer samples. Nat Biotechnol. 2013;31:213–219. doi: 10.1038/nbt.2514. [DOI] [PMC free article] [PubMed] [Google Scholar]
- 41.Ramos AH, Lichtenstein L, Gupta M, Lawrence MS, Pugh TJ, Saksena G, Meyerson M, Getz G. Oncotator: cancer variant annotation tool. Hum Mutat. 2015;36:E2423–2429. doi: 10.1002/humu.22771. [DOI] [PMC free article] [PubMed] [Google Scholar]
- 42.Bragg LM, Stone G, Butler MK, Hugenholtz P, Tyson GW. Shining a light on dark sequencing: characterising errors in Ion Torrent PGM data. PLoS Comput Biol. 2013;9:e1003031. doi: 10.1371/journal.pcbi.1003031. [DOI] [PMC free article] [PubMed] [Google Scholar]
- 43.Robinson JT, Thorvaldsdóttir H, Winckler W, Guttman M, Lander ES, Getz G, Mesirov JP. Integrative genomics viewer. Nat Biotechnol. 2011;29:24–26. doi: 10.1038/nbt.1754. [DOI] [PMC free article] [PubMed] [Google Scholar]
- 44.Picelli S, Faridani OR, Björklund AK, Winberg G, Sagasser S, Sandberg R. Full-length RNA-seq from single cells using Smart-seq2. Nat Protoc. 2014;9:171–181. doi: 10.1038/nprot.2014.006. [DOI] [PubMed] [Google Scholar]
- 45.Langmead B, Trapnell C, Pop Mihai, Salzberg SL. Ultrafast and memory-efficient alignment of short DNA sequences to the human genome. Genome Biol. 2009;10:R25. doi: 10.1186/gb-2009-10-3-r25. [DOI] [PMC free article] [PubMed] [Google Scholar]
- 46.Li B, Dewey CN. RSEM: accurate transcript quantification from RNA-Seq data with or without a reference genome. BMC Bioinformatics. 2011;12:323. doi: 10.1186/1471-2105-12-323. [DOI] [PMC free article] [PubMed] [Google Scholar]
- 47.Gould J, Getz G, Monti S, Reich M, Mesirov JP. Comparative gene marker selection suite. Bioinforma Oxf Engl. 2006;22:1924–1925. doi: 10.1093/bioinformatics/btl196. [DOI] [PubMed] [Google Scholar]
Associated Data
This section collects any data citations, data availability statements, or supplementary materials included in this article.
Supplementary Materials
Fig. S1. Single cell fluorescence microscopy.
Fig. S2. Single cell and bulk DNA sequencing of MM cells from bone marrow.
Fig. S3. Comparison of numbers of MM cells with mutations in blood and BM.
Fig. S4. Allelic fraction of mutations in single cells from MM cell lines.
Fig. S5. Comparative marker selection analysis of CTCs from two individual MM patients.
Table S1. Clinical data of MM patients for whom single cell sequencing was performed.
Table S2. Primer sequences used in single cell targeted DNA sequencing.
Table S3. Targeted next-generation sequencing libraries of single cell DNA.
Table S4. Summary of GSEA results for normal plasma cells.
Table S5. Gene expression of MM CTCs and BM cells by single cell RNA sequencing.