

SUMMARY
Zika virus (ZIKV) is associated with severe neuropathology in neonates as well as Guillain-Barre syndrome and other neurologic disorders in adults. Prolonged viral shedding has been reported in semen, suggesting the presence of anatomic viral reservoirs. Here we show that ZIKV can persist in cerebrospinal fluid (CSF) and lymph nodes (LN) of infected rhesus monkeys for weeks after virus has been cleared from peripheral blood, urine, and mucosal secretions. ZIKV-specific neutralizing antibodies correlated with rapid clearance of virus in peripheral blood but remained undetectable in CSF for the duration of the study. Viral persistence in both CSF and LN correlated with upregulation of mechanistic target of rapamycin (mTOR), proinflammatory, and anti-apoptotic signaling pathways, as well as downregulation of extracellular matrix and cell signaling pathways. These data raise the possibility that persistent or occult neurologic and lymphoid disease may occur following clearance of peripheral virus in ZIKV-infected individuals.
eTOC
Persistance of Zika virus in the CNS and lymphoid tissues of NHP suggest that ZIKV infection may have consequences to humans beyond the reported birth defects.
INTRODUCTION
ZIKV infection in humans typically causes mild and nonspecific clinical symptoms, but it results in devastating fetal consequences in pregnant women, including microcephaly, intrauterine growth retardation, and other congenital malformations (Brasil et al., 2016a; Honein et al., 2017; Johansson et al., 2016; Mlakar et al., 2016; Rasmussen et al., 2016). ZIKV has also been associated with Guillain-Barre syndrome as well as other neurologic disorders in adults (Brasil et al., 2016b; Dos Santos et al., 2016; Parra et al., 2016; Soares et al., 2016). ZIKV infection typically results in approximately one week of viremia, but prolonged viremia has been observed in infected pregnant women and in semen from infected men (Brasil et al., 2016b; Calvet et al., 2016; Driggers et al., 2016). ZIKV has also been reported in fetal brain and placental tissue (Bhatnagar et al., 2017). These data suggest that the virus may persist in anatomic sanctuaries following clearance of virus in the periphery, although the extent of virus persistence following ZIKV infection remains unknown.
ZIKV infection of rhesus and cynomolgus monkeys has been shown to recapitulate many key clinical findings, including rapid control of acute viremia, early invasion of the central nervous system, and prolonged viral shedding and fetal pathology in pregnant female animals (Abbink et al., 2016; Adams Waldorf et al., 2016; Dudley et al., 2016; Osuna et al., 2016). Studies in mice have similarly demonstrated robust viral replication and fetal pathology in pregnant female animals, infection of the central nervous system, and invasion of the male reproductive system (Cugola et al., 2016; Govero et al., 2016; Larocca et al., 2016; Miner et al., 2016).
Innate immune control of ZIKV has been suggested by the fact that mice lacking type 1 interferon (IFN) activity exhibited substantially enhanced viral pathology (Lazear et al., 2016), and IFN-stimulated genes (ISGs) have been shown to restrict viral replication in vitro (Savidis et al., 2016). Adaptive immune control of ZIKV has been demonstrated by the capacity of virus-specific neutralizing antibodies to prevent and control infection in adoptive transfer studies in mice and monkeys (Abbink et al., 2016; Barouch et al., 2017; Larocca et al., 2016; Sapparapu et al., 2016). Cross-reactive antibodies with other flaviviruses such as dengue virus have also been described, although the potential clinical relevance of these cross-reactive antibodies remains to be determined (Barba-Spaeth et al., 2016; Charles and Christofferson, 2016; Dejnirattisai et al., 2016; Stettler et al., 2016).
In this study, we investigate in detail the early virologic, immunologic, and transcriptomic events following ZIKV infection in rhesus monkeys. Acute viremia was rapidly controlled in peripheral blood by day 10 but persisted for up to 42 days in cerebrospinal fluid (CSF) and for up to 72 days in lymph nodes (LN) and colorectal biopsies. ZIKV-specific neutralizing antibodies emerged rapidly by day 7 and correlated with virologic control in peripheral blood. In contrast, virus-specific antibodies were not detected in CSF for the duration of the study. Viral persistence in both CSF and LN also correlated with upregulation of mTOR, proinflammatory, and anti-apoptotic signaling pathways. Taken together, these data suggest a mechanism for viral persistence in these anatomic sites and suggest that persistent or occult ZIKV infection in these compartments may occur more frequently than previously appreciated.
RESULTS
Persistent ZIKV in CSF and LN of Infected Rhesus Monkeys
We previously developed ZIKV challenge stocks from outbreak strains from Brazil (ZIKV-BR; Brazil/ZKV2015) (Cugola et al., 2016) and Puerto Rico (ZIKV-PR; PRVABC59), and both virus stocks demonstrated robust viral replication in mice and rhesus monkeys (Abbink et al., 2016; Larocca et al., 2016). To evaluate the virologic and immunologic events of acute ZIKV infection, we infected 16 Indian-origin rhesus monkeys (M. mulatta) with 106 plaque-forming units (pfu) (109 viral particles [vp]), 105 pfu (108 vp), 104 pfu (107 vp), or 103 pfu (106 vp) of ZIKV-BR and ZIKV-PR by the s.c. route (N=2/group).
We first monitored virus shedding at multiple anatomic sites. Robust viral replication was observed in peripheral blood for 6–10 days, consistent with prior studies of ZIKV infection in monkeys (Abbink et al., 2016; Dudley et al., 2016; Osuna et al., 2016). Peak plasma viral loads were a mean of 6.01 log RNA copies/ml (range 5.18–6.71 log RNA copies/ml) (Figure 1A). Peak viral loads were observed on day 2 at the 106 pfu dose, on day 3 at the 105 pfu dose, on day 3–4 at the 104 pfu dose, and on day 4–5 at the 103 pfu dose, suggesting a trend towards delayed and prolonged viral replication with lower doses. Sporadic but lower levels of ZIKV shedding were observed in urine, cervicovaginal secretions, and saliva (Figure 1A, 1B), although most animals still had virus detected in lymph nodes on day 14 (Figure 1C). Viral loads could not be performed in semen as a result of the limited number of male animals in this study (N=2) and challenges with sample acquisition in these animals.
Figure 1. Viral shedding following ZIKV infection.

Rhesus monkeys (N=16) were infected by the s.c route with 106–103 pfu (109–106 vp) ZIKV-BR or ZIKV-PR (N=2/group). Viral loads (log10 ZIKV RNA copies/ml or copies/106 cells) are shown in (A) plasma and urine, (B) cervicovaginal secretions and saliva, and (C) lymph node and colorectal biopsies. Viral loads were determined on days 0, 1, 2, 3, 4, 5, 6, 7, 10, and 14 for plasma and urine samples and on days 0, 3, 7, and 14 for the other samples. Data is shown for all 8 animals in each panel, except for only 7 females in each panel for cervicovaginal secretions. Assay sensitivity is >100 ZIKV copies/ml and >100 ZIKV copies/106 cells.
In contrast with the rapid clearance of virus in plasma, ZIKV shedding was prolonged in the CSF (Figure 2A), with 75% (3 of 4) of animals that received the lowest 103 pfu dose still positive in CSF on days 21–42, although CSF viral loads were variable. CSF samples contained few leukocytes (0–8 WBC/μl) and did not have chemistry profiles that indicated frank meningitis (Supplementary Figure S1). CSF samples also had very few red blood cells (0–6 RBC/μl), confirming that there was no detectable contamination with peripheral blood (Supplementary Figure S1). Replication-competent virus in CSF from days 21 and 42 was confirmed by viral outgrowth assays (Figure 2B).
Figure 2. ZIKV persistence in CSF and LN.

(A) Viral loads (log10 ZIKV RNA copies/ml) in plasma and CSF in the study described in Figure 1. (B) ZIKV outgrowth assay from plasma and CSF from days 21 and 42 from the animal with the most prolonged CSF viral loads. (C) Viral loads (log10 ZIKV RNA copies/ml or copies/106 cells) in plasma, whole blood, lymph nodes, and colorectal biopsies in 4 additional rhesus monkeys infected by the s.c. route with 103 pfu (106 vp) ZIKV-BR. (D) Immunohistochemistry for ZIKV Env in a representative rhesus monkey lymph node on day 35 following ZIKV infection. Arrows show cytoplasmic staining for ZIKV Env in infected cells in the paracortex (top left) and germinal center (top right). No staining was evident in lymph nodes from a control SHIV-infected rhesus monkey (lower left) or from a ZIKV-infected rhesus monkey stained with an irrelevant control mouse IgG (lower right). Representative images are shown. 600x magnification; scale bar 25 μm. See also Supplementary Figure S1.
To assess viral persistence in lymphoid and colorectal tissues in greater detail, we infected 4 additional rhesus monkeys with 103 pfu (106 vp) of ZIKV-BR and followed viral loads in plasma, whole blood, lymph node biopsies, and colorectal biopsies. Viral loads in whole blood were only marginally prolonged compared with plasma (Murray et al., 2017). In contrast, we observed persistent virus in lymph nodes and colorectal tissue for up to 72 days (Figure 2C). We confirmed ZIKV in both paracortical regions and germinal centers of lymph nodes from ZIKV-infected monkeys on day 35 but not from a SHIV-infected monkey by immunohistochemistry (Figure 2D). RNA in situ hybridization confirmed rare infected cells, and replication-competent virus was shown by viral outgrowth assays (data not shown). These data demonstrate prolonged ZIKV RNA in CSF, LN, and colorectal tissue from infected rhesus monkeys.
Adaptive Immune Responses
We observed the rapid emergence of ZIKV-specific binding (P=0.0004) and neutralizing (P<0.0001) antibodies in serum by week 1 following infection (Figure 3A; Supplementary Figure S2). Both binding antibodies by ELISA and neutralizing antibodies by microneutralization (MN50) assays (Abbink et al., 2016; Larocca et al., 2016) were detected. Binding antibody titers correlated with MN50 titers at weeks 1–2 (P<0.0001, R=0.72; Figure 3A). Log MN50 titers of 1.27–3.43 were observed in 87.5% (14 of 16) of animals at week 1, and log MN50 titers of 3.08–3.86 were detected in 100% (16 of 16) of animals at week 2. Week 1 MN50 titers also correlated inversely with day 6 plasma viral loads (Figure 3A; P=0.019, R=−0.56), suggesting that the emergence of virus-specific neutralizing antibodies was associated with virologic control in plasma.
Figure 3. Humoral and cellular immune responses following ZIKV infection.

(A) Serum log10 Env-specific ELISA titers (top left) and ZIKV-specific microneutralization (MN50) titers (top right) following ZIKV infection. Correlation of ELISA and MN50 titers at weeks 1–2 (bottom left) and correlation of MN50 titers with viral loads on day 6 (bottom right) are also shown. P values reflect Spearman rank-correlation tests. (B) Serum and CSF log10 Env-specific IgM and IgG ELISA titers through week 24. Dotted line indicates limit of assay positivity. Cellular immune responses were assessed by (C) interferon-γ ELISPOT assays to prM, Env, Cap, and NS1 and (D) multiparameter ICS assays to Env, Cap, and NS1. See also Supplementary Figure S2.
In contrast with the rapid development of ZIKV-specific antibodies in plasma, no ZIKV-specific IgM or IgG was detected in CSF at any timepoint through week 24 (Figure 3B). In contrast, ZIKV-specific IgG was consistently high in serum through week 24 (Figure 3B). These data suggest that ZIKV-specific antibodies produced in the periphery did not detectably cross the blood-CSF barrier. We speculate that the absence of ZIKV-specific antibodies in the CSF may contribute to viral persistence in the central nervous system, and eventual clearance of CSF virus is thus likely dependent on other immune mechanisms.
ZIKV-specific cellular immune responses to prM, Env, Cap, and NS1 were not detected by IFN-γ ELISPOT assays at week 1 but were observed in a subset of animals at week 2 and in the majority of animals by week 5 (Figure 3C). CD8+ and CD4+ T lymphocyte responses to Env, Cap, and NS1 were also detected by multiparameter intracellular cytokine staining assays by week 2 (Figure 3D). However, cellular immune responses did not correlate with virologic control (data not shown), although we cannot exclude the possibility that cellular immune responses against other ZIKV antigens may have played a role. These data suggest that robust ZIKV-specific cellular immune responses expanded largely after peripheral virus had already been controlled.
Early Innate Immune Responses
To characterize the early innate immune responses in ZIKV-infected rhesus monkeys, we assessed transcriptomic profiles in peripheral blood mononuclear cells on days 0, 2, 4, 6, 14, and 21 following ZIKV infection using the Affymetrix Rhesus Gene 1.0 ST Array rheMac2 platform. Multi-dimensional unsupervised clustering using the full transcriptome of all animals showed principal clustering by timepoint (P=0.03; days 0, 2, 14 versus days 4, 6), with minimal contribution by ZIKV strain or inoculum dose, which allowed a kinetic analysis of gene expression using the complete group of animals (Supplementary Figure S3). The number of differentially expressed genes peaked on days 4 and 6 as compared with day 0 (Supplementary Figure S3), which temporally correlated with peak plasma viral loads (Figure 1A).
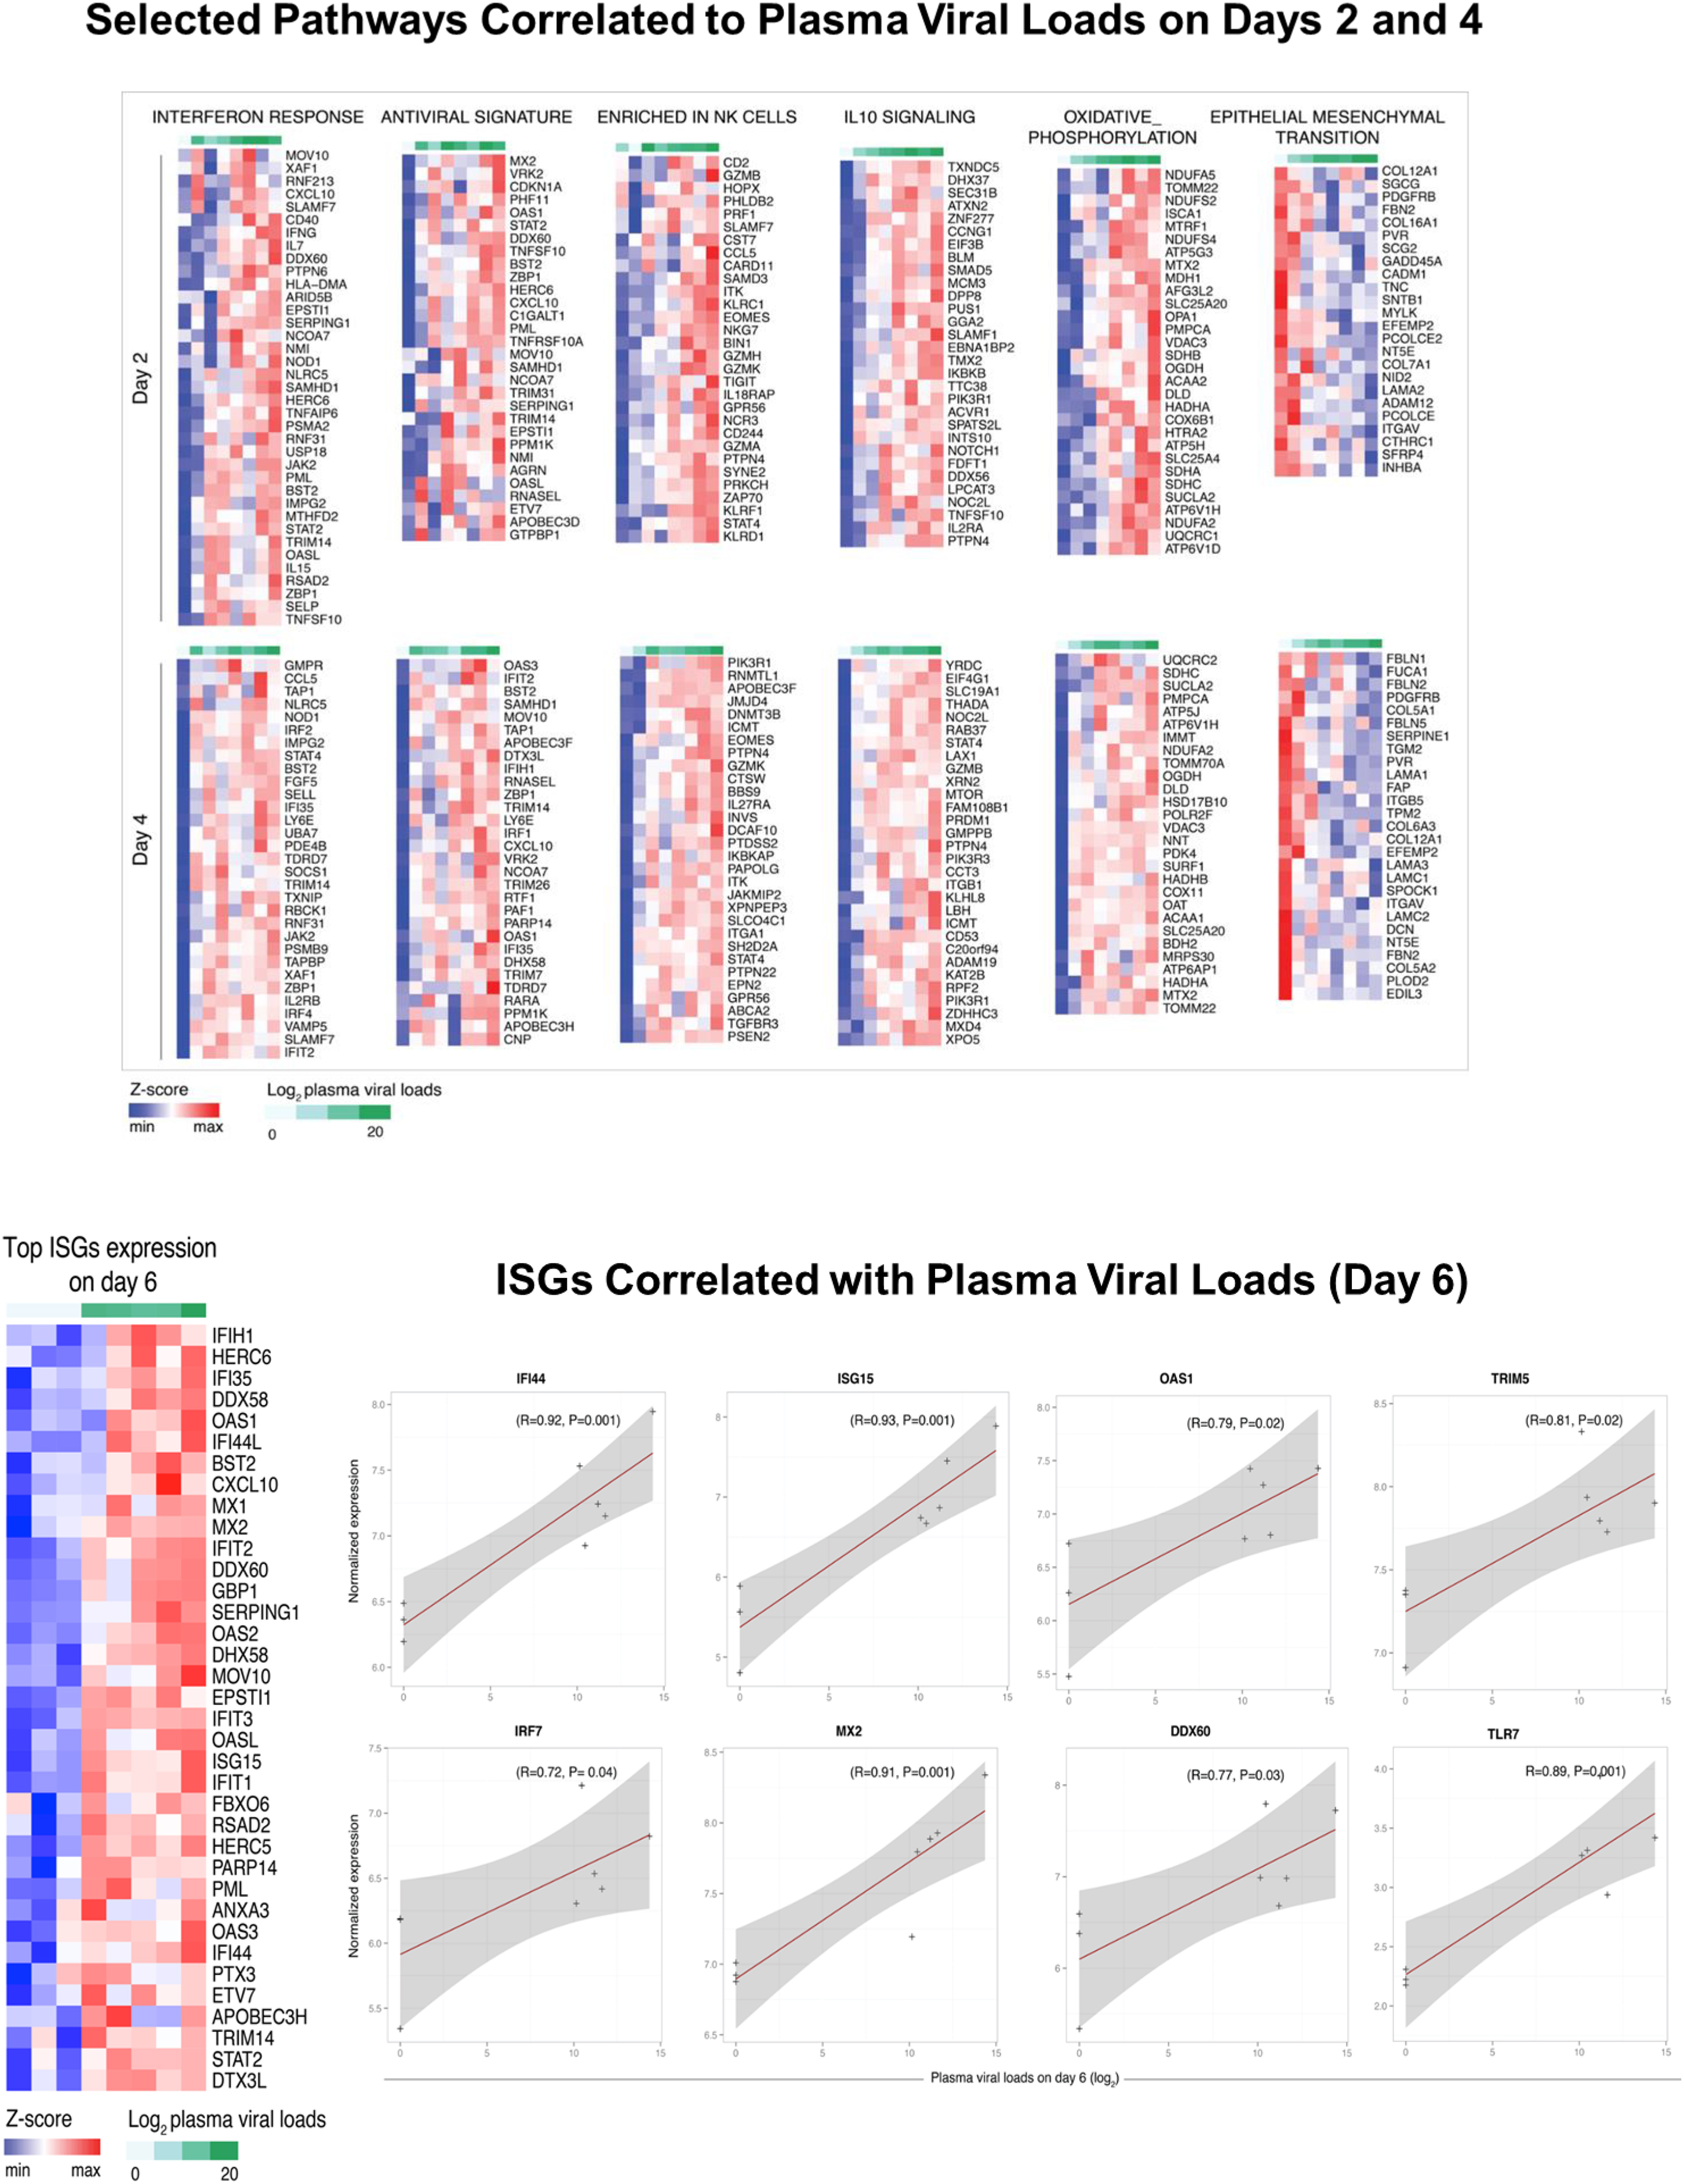
We next used Gene Set Enrichment Analysis (GSEA) (Subramanian et al., 2005) and compiled lists of gene sets (Liberzon et al., 2015; Nakaya et al., 2011) to identify the pathways upregulated and downregulated following ZIKV infection of rhesus monkeys (Figure 4A, 4B; Supplementary Figure S4). Robust induction of IFN-α (NES=3.02, FDR<0.0001) and antiviral (NES=2.28, FDR<0.0001) pathways were observed on days 2, 4, and 6. IFN-stimulated genes (ISGs) (OAS2, IFT1/2/3, ISG15, IRF7, IFI44, MX1, MX2) (Schoggins et al., 2011) also peaked on day 6 (Figure 4C). In addition, acute ZIKV infection upregulated components of the inflammasome (NOD2, NLRP3, CXCL10, BTG2, BST2, OSM), proinflammatory cytokines and chemokines (TNF-α, IL-1, IL-18, CCR7, CCL2, CCL20), and immunomodulatory pathways (IL-10, TGF-β, T regulatory cells) (Figure 4A; Supplementary Figure S4), analogous to what we previously observed for acute SIV infection in rhesus monkeys (Barouch et al., 2016). We also observed increases in mTOR signaling (NES=1.92, FDR=0.0014) and T cell exhaustion (NES=1.96, FDR=0.0009) pathways following ZIKV infection (Figure 4A; Supplementary Figure S4). mTOR signaling orchestrates numerous cell processes in living organisms by regulating homeostasis, protein synthesis, transcription, autophagy, and metabolism (Thoreen, 2017), and also regulates immune function (Powell et al., 2012) and neurologic development (Lipton and Sahin, 2014).
Figure 4. Longitudinal transcriptomic analysis of acute ZIKV infection.

(A) Heatmaps representing gene set enrichment (GSEA) normalized enrichment scores (NES) for the top enriched pathways on days 2, 4, 6, 14, and 21 following ZIKV infection as compared with baseline day 0 (left). Color gradient depicts NES range varying from dark red (increased) to dark blue (decreased). Scatter plots of the top differentially expressed genes on day 4 compared with day 0 (right). X-axis and Y-axis represent, respectively, gene rank and log2 fold change of gene expression sorted from highest to lowest. Red and blue represent, respectively, upregulated and downregulated pathways. (B) Enrichment map representing significant pathways (FDR 5%) that are increased (red) or decreased (blue) on day 4 as compared with day 0. (C) Number of differentially expressed interferon-stimulated genes (ISGs) (P<0.05) on days 2, 4, 6, 14, and 21 following ZIKV infection as compared with day 0 (left). Heatmap of the normalized expression of the top 50 ISGs induced on day 4 as compared with day 0 (right). (D) Scatter plot showing upregulation of interferon, antiviral, and immunomodulatory pathways and downregulation of T cell and B cell signaling pathways on days 4 and 6 as compared with day 0. Axes reflect log2 fold changes in expression of leading genes on days 4 and 6 as compared with day 0. See also Supplementary Figures S3–S4.
Acute ZIKV infection also upregulated genes associated with monocyte (NES=2.56, FDR <0.0001), NK cell (NES=1.65, FDR=0.01), and helper T cell (NES=1.55, FDR=0.02) pathways, but downregulated T cell signaling (NES=−2.36, FDR <0.0001), B cell signaling (NES=−2.47, FDR<0.0001), and MHC-I pathways (NES=−1.5, FDR=0.05), including genes such as CD40, GATA3, RHOH, PIK3CG, BANK1, and BCR (Figure 4A, 4B; Supplementary Figure S4). Taken together, these data demonstrate that acute ZIKV infection is characterized by robust and rapid upregulation of proinflammatory, interferon, antiviral, and immunomodulatory pathways and downregulation of T cell and B cell signaling pathways (Figure 4D).
To confirm these transcriptomic findings, we monitored serum cytokines by Luminex assays in rhesus monkeys following ZIKV infection. Monkeys developed robust early proinflammatory responses as evidenced by substantial increases in serum levels of TNF-α, IL-2, IL-10, and IL-12/IL-23 on days 4–6 following infection (P=0.0003, P=0.0019, P=0.0011, and P=0.015 comparing day 6 vs. day 0 for each cytokine, respectively, Mann-Whitney tests; Figure 5A). These data confirm that ZIKV replication triggered rapid innate immune responses in peripheral blood. In contrast, only minimal cytokine responses were observed in CSF, even in animals that exhibited prolonged ZIKV replication in the central nervous system (Figure 5B). Cytokine responses in both serum and CSF were essentially negative on days 21 and 42 (data not shown).
Figure 5. Cytokine levels following ZIKV infection.

Cytokine levels are shown in (A) serum and (B) CSF on days 0, 2, 4, and 6 following ZIKV infection of rhesus monkeys as measured by Luminex assays. Red bars reflect medians.
Pathways Correlated with Acute Plasma Viral Loads
To define the transcriptomic pathways that correlate with plasma viral loads following ZIKV infection, we performed a linear regression analysis correlating the full transcriptome to viral loads during acute infection (Figure 6A). IFN-α signaling (NES=1.59, FDR=0.08) and IFN-γ signaling (NES=1.56, FDR=0.09), as well as various ISGs (IFI44, ISG15, OAS1, TRIM5, IRF7, MX2, DDX60, TLR7) correlated positively with acute viral loads on day 2, 4 and 6 (Figure 6A, Supplementary Figure S5), suggesting that ZIKV replication rapidly triggered host innate immune responses. NK cell signaling (NES=2.49, FDR=0.001), IL-10 signaling (NES=1,55, FDR=0.09), and oxidative phosphorylation (NES=2.03, FDR=0.0016) pathways also correlated positively with plasma viral loads (Figure 6A; Supplementary Figure S5). Moreover, mTOR signaling pathways on day 2, including mTORC1 (NES=2.2, FDR=0.001) and PI3K_AKT_mTOR (NES=1.6, FDR=0.08), correlated positively with viral loads (Figure 6A). In contrast, extracellular matrix (NES=−2.05, FDR=0.02), epithelial mesenchymal transition (NES= −1.73, FDR=0.10), myogenesis (NES=1.83, FDR=0.06), and signal transduction and plasma membrane pathways (NES=−1.82, FDR=0.06) correlated negatively with plasma viral loads (Figure 6A; Supplementary Figure S5).
Figure 6. Bar charts representing the top enriched pathways correlated with plasma, CSF, and LN viral loads.

(A) Normalized enrichment scores of the top pathways correlated positively (red) or negatively (blue) with plasma viral loads on day 2 and 4 following ZIKV infection. (B) Normalized enrichment scores of the top pathways correlated positively (red) or negatively (blue) to CSF viral loads on day 14 and 21 (left) and to LN viral loads on day 3 and 14 (right). (C) Scatter plots of genes consistently correlated positively (red) or negatively (blue) to persistent viral load in CSF (top) and LN (bottom). Color gradient ranging from dark to light (red for positively correlated genes, blue for negatively correlated genes) represent the Fisher combined P value for each gene. Axes represent log2 fold change in gene expression between animals with positive and negative viral loads. (D) Gene interaction networks for mTOR, inflammation and interferon, and extracellular matrix pathways that were correlated positively or negatively to CSF and LN viral loads. Red and blue nodes are genes correlated positively and negatively to viral loads. Node size is proportional to the number of interacting neighbors. Edge width depicts the strength of the interaction between each pair of genes. Networks inference was performed using Cytoscape. See also Supplementary Figures S5–S7.
A previously reported target cell limited model of acute ZIKV replication kinetics (Osuna et al., 2016), which utilized a different challenge virus and a different inoculum dose, did not optimally describe viral dynamics in the present study. We therefore added to this model the impact of neutralizing antibodies and the effect of the early type 1 interferon response, which greatly improved the model fit (P<3.0x10⁻⁴). The best fit with biologically plausible parameters was found when type 1 interferon activity was assumed to begin on day 1.5 and when neutralizing antibody activity was assumed to begin on day 6 (negative log likelihood=105.7, BIC=247.4; Supplementary Figure S6). This model fit the viral dynamics well for all four inoculum doses tested. These findings suggest that both the innate interferon response and the adaptive neutralizing antibody response contributed to virologic control in the periphery.
Pathways Correlated with Persistent CSF and LN Viral Loads
We next evaluated the transcriptomic pathways associated with persistent CSF and LN viral loads using CSF viral loads from days 14 and 21 and LN viral loads from days 3 and 14. Plasma viral loads were negative on day 14 in all animals. Pathways that correlated with persistent CSF and LN viral loads following ZIKV clearance in the periphery included mTOR signaling (NES=1.92; P=0.00517), TGF-β (NES=1.60; P=0.00669), IFN-α signaling (NES=2.61; P=0.003), acute inflammation (NES=1.60; P=0.0056), and TNF-α signaling (NES=1.66; P=0.0032) (Figure 6B–D; Supplementary Figures S7). Genes associated with these pathways correlated significantly with viral loads at both timepoints tested in CSF and LN, including mTOR, Rictor, CXCL10, OAS2, IFI44, BANK1, NLRP3, IL1β, EIF4G, EIF4E, PIK3CB and SMAD3 (Figure 6C). We speculate that both mTOR signaling and proinflammatory pathways contributed to the survival of ZIKV-infected cells and viral persistence.
In contrast, pathways associated with extracellular matrix (ECM) signaling (NES=−2.00; P=0.005) and platelet activation (NES=−1.85; P=0.0047) negatively correlated to viral loads in CSF and LN (Figure 6B–D; Supplementary Figures S7). Genes involved in collagen formation and cell adherence, including MLLT4, COL14A, COL5A, COL6A, MMP1, MMP2, MMP3, MMP8, MMP19 and SLC22A2, SLC6A13, SLC7A9 and SLC17A1, correlated negatively to viral loads in both CSF and LN (Figure 6C). Downregulation of ECM pathways has also been reported for DENV (Afroz et al., 2016), suggesting a common pathophysiologic pathway.
Anti-apoptotic genes (BIK, BCL2A1, BCL2L1) also correlated positively and pro-apoptotic genes (CASP8, CAV1, CLU, LMNA) correlated negatively to persistent CSF and LN viral loads (Supplementary Figure S7), suggesting that ZIKV infection creates a milieu that favors survival of infected cells. Taken together, these data suggest that viral persistence in the CSF and LN correlated with upregulation of mTOR, proinflammatory, and anti-apoptotic pathways, which promote survival of infected cells, and downregulation of ECM pathways, which may be important for lymphocyte recruitment to sites of infection (Figures 6D, 7).
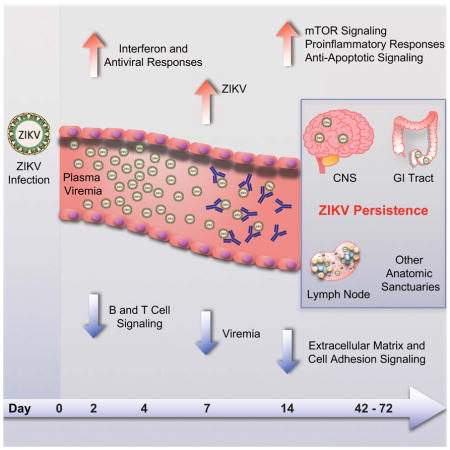
Figure 7. Model of ZIKV persistence in CSF and LN.

Schematic representation of the most relevant pathways and genes that were modulated by ZIKV and that correlated with persistent CSF and LN viral loads, highlighting increased inflammation, antiviral, cellular stress, and mTOR signaling pathways and decreased extracellular matrix and cell adhesion pathways. Interactions between genes and pathways were inferred from published literature. Red indicates activation; blue indicates inhibition.
DISCUSSION
In this study, we describe the early events following acute ZIKV infection of rhesus monkeys at a greater level of detail than previously reported. Integrated virologic, immunologic, and transcriptomics data demonstrated a rapid and robust proinflammatory response in the first few days of infection coincident with ZIKV replication, characterized by upregulation of type 1 IFN, antiviral, and immunomodulatory pathways. A rapid ZIKV-specific neutralizing antibody response in peripheral blood was also evident by day 7 and correlated with virologic control in plasma. In contrast with the rapid virologic control in peripheral blood, viral persistence was observed in the CSF for up to 42 days and in LN and colorectal tissues for up to 72 days, suggesting the presence of multiple anatomic sanctuaries for the virus. Persistent virus at these sites correlated with upregulation of mTOR, proinflammatory, and anti-apoptotic pathways and downregulation of ECM pathways, suggesting a potential mechanism for viral persistence. These findings raise the possibility that occult or persistent neurologic and lymphoid disease may occur in ZIKV-infected humans more commonly than currently recognized.
mTOR orchestrates numerous cell processes in living organisms by regulating homeostasis, protein synthesis, transcription, autophagy, metabolism, brain function and development (Thoreen, 2017). The finding that upregulation of the mTOR signaling pathways correlated with persistent viral loads in both CSF and LN suggests that ZIKV infection may directly stimulate mTOR machinery, which promotes survival of infected cells. Moreover, mTOR signaling has been shown to play a key role in neurodevelopment, including the proliferation of neural stem cells, neuronal circuit development, plasticity, and higher complex functions (Lipton and Sahin, 2014; Switon et al., 2017; Thoreen, 2017). Overexpression of mTOR during early embryonic development in transgenic mice resulted in cortical atrophy and microcephaly, whereas overexpression of mTOR in adults led to neurodegeneration (Kassai et al., 2014). Moreover, brain-specific knockouts of Raptor and Rictor, which are key components of mTOR complex 1 and 2, respectively, also led to microcephaly and early postnatal lethality (Cloetta et al., 2013; Thomanetz et al., 2013). These findings suggest that ZIKV-induced stimulation of the mTOR pathway, together with persistent CSF viral loads, may be critical for the development of microcephaly and other neurologic disorders associated with ZIKV infection. Future studies targeting the mTOR pathway are therefore warranted.
Recent reports have also shown inhibition of ECM pathways by both DENV and ZIKV (Afroz et al., 2016; Zhang et al., 2016), suggesting a common pathophysiologic pathway for these flaviviruses. ECM proteins are widely expressed in the developing and adult nervous system and may also be critical for lymphocyte trafficking (Barros et al., 2011). These data suggest that viral persistence may result from stimulation of pathways that promote survival of ZIKV-infected cells and that block the recruitment of immune cells to the site of infection (Figures 6, 7).
ZIKV-specific antibodies were not detected in CSF, despite robust and prolonged responses in peripheral blood (Figure 3), suggesting an additional mechanism for viral persistence in immunoprivileged sites. Although we did not evaluate ZIKV-specific antibody levels in lymph nodes in the present study, studies with monoclonal antibodies have shown substantial variation in antibody biodistribution to different tissues, including lymph node and brain, as compared with peripheral blood (de Boer et al., 2016; Tichauer et al., 2014; Wang et al., 2008). In the CSF, it is likely that the absence of ZIKV-specific antibodies contributed to viral persistence in that compartment.
Our data confirm and extend prior studies of ZIKV pathogenesis in nonhuman primates (Abbink et al., 2016; Dudley et al., 2016; Osuna et al., 2016). A recent study identified virus in neuronal, lymphoid, and reproductive tissues though day 28–35 following infection in rhesus monkeys (Hirsch et al., 2017), and persistent ZIKV infection has been reported in the testes in mice (Govero et al., 2016). Taken together, these findings suggest that ZIKV may persist for prolonged periods in multiple anatomic sanctuaries, including the central nervous system, lymphoid system, gastrointestinal tract, and genitourinary tract.
Our findings demonstrate that early ZIKV replication in rhesus monkeys is partially restricted by early innate interferon responses and is then definitively controlled in peripheral blood by the rapid emergence of virus-specific neutralizing antibodies by day 6–10. In the central nervous system, lymph nodes, and gastrointestinal tissues, however, virus can persist for a substantially longer period of time, likely as a result of activation of mTOR, proinflammatory, and anti-apoptotic pathways that promote survival of infected cells, as well as exclusion of virus-specific antibodies from CSF. If persistent or occult neurologic and lymphoid disease similarly occurs following clearance of peripheral virus in ZIKV-infected humans, such a finding would have important clinical implications. It is likely that that mTOR activation and persistent virus in the central nervous system contribute to the hallmark neuropathology of ZIKV infection.
STAR METHODS
Contact for Reagent and Resource Sharing
Further information and requests for resources and reagents should be directed and will be fulfilled by the Lead Contact (Dan Barouch; dbarouch@bidmc.harvard.edu).
Experimental Model and Subject Details
Rhesus Monkeys
16 outbred, Indian-origin, healthy young adult male and female rhesus monkeys (Macaca mulatta) were included in the initial study. These monkeys were housed at Bioqual, Rockville, MD. Animals were infected with 103–106 pfu (106–109 vp) of our ZIKV-BR or ZIKV-PR challenge stocks by the s.c. route (N=2/group). An additional 4 outbred, Indian-origin, healthy young adult male and female rhesus monkeys were housed at Alphagenesis, Yemassee, SC and infected with 103 pfu (106 vp) of our ZIKV-BR challenge stocks by the s.c. route (N=4/group). Animals were tested for baseline flavivirus neutralizing antibodies. None of the monkeys were previously enrolled in other studies. All animal studies were approved by the appropriate Institutional Animal Care and Use Committee (IACUC).
Cell lines
Vero cells (World Health Organization, NICSC-011038011038) were maintained in EMEM media supplemented with 10%FBS, 6mM L-glutamine and 1x pen/strep. Cells were passaged twice a week and incubated at 37°C, 10% CO2.
Methods Details
RT-PCR
RT-PCR assays were utilized to monitor viral loads, essentially as previously described (Abbink et al., 2016; Larocca et al., 2016). RNA was extracted from plasma or other samples with a QIAcube HT (Qiagen, Germany) using the Qiacube 96 Cador pathogen HT or the Qiacube 96 RNeasy 96 kit. CSF samples were centrifuged prior to analyses. The wildtype ZIKV BeH815744 Cap gene was utilized as a standard. RNA standards were generated using the AmpliCap-Max™ T 7 High Yield Message Maker Kit (Cell Script) and purified with RNA clean and concentrator kit (Zymo Research, CA, USA). RNA quality and concentration was assessed by the BIDMC Molecular Core Facility. Log dilutions of the RNA standard were reverse transcribed and included with each RT-PCR assay. Viral loads were calculated as virus particles (VP) per ml or virus particles per 106 cells as shown in Figures 1–2. Assay sensitivity was >100 copies/ml and >100 ZIKV copies/106 cells.
ELISA
Monkey ZIKV Env ELISA kits (Alpha Diagnostic International, TX, USA) were used to determine endpoint binding antibody titers using a modified protocol (Abbink et al., 2016). 96-well plates coated with ZIKV Env protein were first equilibrated at room temperature with 300 μl of kit working wash buffer for 5 min. 6 μl of monkey serum was added to the top row, and 3-fold serial dilutions were tested in the remaining rows. Samples were incubated at room temperature for 1 h, and plates washed 4 times. 100 μl of anti-monkey IgG HRP-conjugate working solution was then added to each well and incubated for 30 min at room temperature. Plates were washed 5 times, developed for 15 min at room temperature with 100 μl of TMB substrate, and stopped by the addition of 100 μl of stop solution. Plates were analyzed at 450nm/550nm on a VersaMax microplate reader using Softmax Pro 6.0 software (Molecular Devices, CA, USA). ELISA endpoint titers were defined as the highest reciprocal serum dilution that yielded an absorbance >2-fold over background values. Log10 endpoint titers are reported and shown in Figure 3.
Virus Neutralization Assay
A high-throughput, standardized ZIKV microneutralization (MN) assay was utilized for measuring ZIKV-specific neutralizing antibodies, essentially as previously described (Abbink et al., 2016; Larocca et al., 2016). Briefly, serum samples were serially diluted three-fold in 96-well micro-plates, and 100 μl of ZIKV-PR containing 100 PFU were added to 100 μl of each serum dilution and incubated at 35°C for 2 h. Supernatants were then transferred to microtiter plates containing confluent Vero cell monolayers (World Health Organization, NICSC-011038011038). After incubation for 4 d, cells were fixed with absolute ethanol: methanol for 1 h at −20°C and washed three times with PBS. The pan-flavivirus monoclonal antibody 6B6-C1 conjugated to HRP (6B6-C1 was a gift from JT Roehrig, CDC) was then added to each well, incubated at 35°C for 2 h, and washed with PBS. Plates were washed, developed with 3,3′,5,5′–tetramethylbenzidine (TMB) for 50 min at room temperature, stopped with 1:25 phosphoric acid, and absorbance was read at 450 nm. For a valid assay, the average absorbance at 450 nm of three non-infected control wells had to be ≤ 0.5, and virus-only control wells had to be ≥ 0.9. Normalized absorbance values were calculated, the MN50 titer was determined by a log mid-point linear regression model. The MN50 titer was calculated as the reciprocal of the serum dilution that neutralized ≥ 50% of ZIKV, and seropositivity was defined as a titer ≥ 10, with the maximum measurable titer 7,290. Log10 MN50 titers are shown in Figure 3A–B and Supplementary Figure S2.
Viral Outgrowth Assay
MW6 plates seeded with Vero WHO cells (World Health Organization, NICSC-011038011038) were infected with CSF and plasma from ZIKV infected monkeys. Aliquots of the media were taken daily after infection and subjected to RT-PCR as described above. Viral loads of the cultures are shown in vp/ml in Figure 2B.
ELISPOT assay
ZIKV-specific cellular immune responses were assessed by interferon-γ ELISPOT assays shown in Figure 3C using pools of overlapping 15-amino-acid peptides covering the prM, Env, Cap, and NS1 proteins (JPT, Berlin, Germany), essentially as we previously described (Abbink et al., 2016; Larocca et al., 2016). 96-well multiscreen plates (Millipore, MA, USA) were coated overnight with 100 μl/well of 10 μg/ml anti-human interferon-γ (BD Biosciences, CA, USA) in endotoxin-free Dulbecco’s PBS (D-PBS). The plates were then washed three times with D-PBS containing 0.25% Tween 20 (D-PBS-Tween), blocked for 2 h with D-PBS containing 5% FBS at 37°C, washed three times with D-PBS-Tween, rinsed with RPMI 1640 containing 10% FBS to remove the Tween 20, and incubated with 2 μg/ml of each peptide and 2 × 10⁵ monkey PBMC in triplicate in 100 μl reaction mixture volumes. Following an 18 h incubation at 37°C, the plates were washed nine times with PBS-Tween and once with distilled water. The plates were then incubated with 2 μg/ml biotinylated anti-human interferon-γ (BD Biosciences, CA, USA) for 2 h at room temperature, washed six times with PBS-Tween, and incubated for 2 h with a 1:500 dilution of streptavidin-alkaline phosphatase (Southern Biotechnology Associates, AL, USA). Following five washes with PBS-Tween and one with PBS, the plates were developed with nitroblue tetrazolium-5-bromo-4-chloro-3-indolyl-phosphate chromogen (Pierce, IL, USA), stopped by washing with tap water, air dried, and read using an ELISPOT reader (Cellular Technology Ltd., OH, USA). The numbers of spot-forming cells (SFC) per 106 cells were calculated. The medium background levels were typically <15 SFC per 106 cells.
Intracellular Cytokine Staining (ICS)
12-color ICS assays shown in Figure 3D were performed essentially as described (Barouch et al., 2016) in response to stimulation with prM, Env, Cap, and NS1 peptide pools (JPT, Berlin, Germany) using the Aqua green-fluorescent reactive dye (Invitrogen, L23101) and predetermined titers of mAbs (Becton-Dickinson) against CD3 (SP34; Alexa Fluor 700), CD4 (OKT4; BV711, Biolegend), CD8 (SK1; allophycocyanin-cyanine 7 [APC-Cy7]), CD28 (L293; BV510), CD95 (DX2; allophycocyanin [APC]), CD69 (TP1.55.3; phycoerythrin-Texas red [energy-coupled dye; ECD]; Beckman Coulter), gamma interferon (IFN-γ) (B27; phycoerythrin-cyanine 7 [PE-Cy7]), Ki67 (B56; fluorescein isothiocyanate [FITC]), CCR5 (3A9; phycoerythrin [PE]), CCR7(3D12; BV421), and PD-1(EH21.1; peridinin chlorophyll-A-cyanine 5.5 [PerCP-Cy5.5]). IFN-γ backgrounds were consistently <0.01% in PBMC.
Immunohistochemistry
Immunohistochemistry for ZIKV Env, shown in Figure 2D was performed using standard techniques. Briefly, lymph nodes were fixed in 10% neutral buffered formalin for 24–72 hours then transferred to 70% ethanol. Formalin-fixed paraffin embedded (FFPE) tissues were deparaffinized in xylene and rehydrated through graded ethanol solutions to distilled water. Endogenous peroxidase activity was blocked by incubation in 3% H2O2, and antigen retrieval was accomplished by microwaving sections for 20 min in citrate buffer (Dako). Tissue sections were treated for nonspecific protein binding (Protein Block; Dako) and then sequentially incubated with monoclonal mouse anti-ZIKV Env (Biofront) at 1:200 followed by biotinylated horse anti-mouse IgG (Vector Labs). Antigen-antibody complexes were localized by application of streptavidin-peroxidase conjugate (Dako) followed by development in the chromogenic substrate 3,3-diaminobenzidine (Dako).
Luminex assay
Serum was thawed on ice and neutralized with 0.05% Tween-20 for 15 minutes at room temperature. Samples were prepared using the Milliplex Nonhuman Primate 23-plex (Millipore) according to manufacturers’ protocol and washed and resuspended in 4% formaldehyde in D-PBS for 1 hour on a plate shaker. Samples were then washed and resuspended in Magpix drive fluid for analysis. Data was acquired on a Magpix instrument running xPONENT 4.2 (Luminex). Cytokine cut-off values for analysis were the following: IL-2 (2.4 pg/ml), IL-10 (12.2 pg/ml), TNF-γ (2.4 pg/ml serum, 9.8 pg/mL CSF), IL-12/23 (p40) (9.8 pg/ml serum days 4 and 6, 2.4 pg/ml CSF and serum days 0 and 2). Cytokine levels were analyzed using GraphPad Prism v6.03 (GraphPad Software, CA, USA) and are shown in Figure 5.
Transcriptomics
Cells were isolated from peripheral blood at d2, 4, 6, 14 and 21 as well as lymph node at d3 and 14 and stored in RNAlater. Total RNA extraction was performed using the automated RNeasy HT Qiacube kit according to manufacturer’s instructions (Qiagen). Reverse transcription reactions were performed to obtain cDNAs, and proper cDNA amplification was confirmed using Agilent 2100 Bioanalyzer (Agilent Technologies). cDNA was hybridized to Rhesus Genome rheMac2 platform (Affymetrix) at the Microarray Core of the Boston University.
Analysis of the genome array output data was conducted using the statistical language R (http://www.r-project.org/) and the Linear Models for Microarray Data (LIMMA) statistical package from Bioconductor (http://bioconductor.org/) (Gentleman et al., 2004). Quantile normalization, followed by a log2 transformation using the Bioconductor package LIMMA, was applied to process microarrays. Batch correction was performed to correct for any technical or biological effect using ComBat R (http://bioconductor.org/). The LIMMA package was used to fit a linear model to each probe and to perform a moderated Student’s t test on various differences of interest between time points. For data mining and functional analyses, genes that satisfied a p value cut-off of 0.05 were selected. When indicated, p values were corrected for multiple comparisons using Benjamin & Hochberg method (FDR <5%). The LIMMA package was used to fit a linear regression model to each probe where the log2 expression of each transcript was used as an independent variable and viral load or neutralizing antibody titers, respectively, as continuous variables. Pearson correlations and a p value cut-off of 0.05 were used to assess significant genes that correlated with virologic and immunologic data.
Pathway enrichment was performed using gene set enrichment analyses GSEA (http://software.broadinstitute.org/gsea/msigdb/index.jsp) and a list of gene sets including MSigDB Hallmark collection and published immunological modules (Subramanian et al., 2005). To assess the significance of GSEA results, 1000 permutations were performed. The minimum size of tested gene sets was set to 5 genes and the maximum to 5000. A nominal p value of 0.05 was used to assess the significance of gene sets enrichment. An enrichment score (ES) was calculated to reflect the degree of the over-representation of the top (or bottom) genes in the ranked gene list. GSEA allows for the identification of a core list of genes (leading edge genes) that contribute to the ES from genes within each significantly enriched gene set. The normalized enrichment score and FDR shown in the main text correspond to day 4 following ZIKV infection (Figure 4, Supplementary Figures S3 and S4). Module enrichment map was generated using EnrichmentMap application under Cytoscape (http://cytoscape.org/). Functional annotation and network inference were performed using Cytoscape (http://cytoscape.org/).
To identify mechanisms of persistence of CSF and LN viral loads, a linear regression model using R programming language was used to correlate genes expressed in PBMC on day 14 and 21 to viral load in CSF on day 14 and 21 respectively and to correlate genes expression in LN to viral load in LN on day 3 and 14 (Figure 6, Supplementary Figures S5 and S7). Next, we identified genes that correlated to CSF and LN viral loads for each timepoint separately. To account for genes that correlated positively or negatively with viral loads at different timepoints, we measured the Fisher combined p value for each gene correlated to CSF viral loads on day 14 or 21 and gene correlated to LN viral loads on day 3 and day 14, where the Fisher combined p value, P is defined as:
where P representing the combined p value, k the number of timepoints and ln(Pi) is the natural log of each specific timepoints’ p value.
Viral Dynamics Modeling
A mathematical model was used to investigate the within-host ZIKV dynamics in plasma as shown in Supplementary Figure S6. The model was a standard target cell limited model that included a viral eclipse phase and (i) an early innate type 1 interferon response and (ii) a neutralizing antibody response. The model is described by the following system of equations:
| (1) |
Target cells, T, are infected by free virus V with rate β when no antibody, A, is present, and become non-productively infected cells, I1. While cells are non-productively infected they are referred to as being in the eclipse phase, and they transition to productively infected cells I2 at per capita rate k giving a mean eclipse phase of length 1/k. Productively infected cells die at per capita rate δ and produce virus, in the absence of interferon F, at rate p per cell, which is then cleared at rate c per virion.
In vitro there is detectable virus in cell culture supernatants 6 hours after Zika infection of primary human fibroblasts (Hamel et al., 2015). We fixed the value of k at 4 d−1 so that the mean eclipse phase length was 6 hours, since there is not enough information in the data to estimate it precisely. We also set the value of c to be 25 d−1, similar to the value estimated for HIV-1 (Ramratnam et al., 1999) and HCV (Guedj et al., 2013).
Productively infected cells cause the production of interferon at rate s after a lag of length τ. As expression of ISGs was detected at day 2, we investigated values of τ = 0.25, 0.5, 1, and 1.5 days. Without loss of generality we can set s = 1 d−1, so that one productively infected cell creates one ‘unit’ of interferon per day. Interferon is cleared at constant rate γ and reduces the production rate of virus particles from infected cells with a coefficient ε. In previous work fitting a similar model to data from influenza infected ponies (Pawelek et al., 2012) it was estimated that interferon is cleared at a rate of approximately 2 d−1, as so we took this as the value of γ.
The model assumes neutralizing antibody, A, reduces the infection rate β by the factor (1+ αA(t)). We used linear interpolation between measured neutralization titers to estimate A(t), under the assumption that A(t) = 0 for all t below some value, denoted Tab. Because neutralizing antibody was detected at day 7, we investigated values of Tab = 3, 4, 5 or 6 days.
We set the initial conditions of this system such that there are no infected cells, interferon or neutralizing antibody at time t=0 and as in previous work (Osuna et al., 2016) we fixed the initial target cell population density at T(0) = T0 = 105 cells/ml. In order to evaluate the effects of immunological control of ZIKV, we considered models where (a) there is no effect of neutralizing antibody or interferon (α = 0, ε = 0), (b) there is an effect of antibody but no effect of interferon (ε = 0) and (c) both neutralizing antibody and interferon affect the viral dynamics. For each of these models, we estimated the distribution of the non-fixed parameters and the initial condition V(0) = V0 using a population fitting approach with a non-linear mixed effects model implemented in Monolix (http://lixoft.com/products/monolix/), providing estimates of population medians and standard errors for each of the parameters. We assessed model fits by the negative log likelihood and the appropriateness of the various models of immune control using the Bayesian information criterion (BIC), both as provided by Monolix.
Statistical Analyses
Analysis of virologic and immunologic data was performed using GraphPad Prism v6.03 (GraphPad Software, CA, USA). Comparisons of groups were performed using Student t-test and Wilcoxon rank-sum test. Correlations of virologic and immunologic data were assessed by Spearman rank-correlation tests. A p value cut-off of 0.05 was considered statistically significant.
Data and Software Availability
The arrays raw data have been deposited in the Gene Expression Omnibus under ID code GSE90868.
| REAGENT or RESOURCE | SOURCE | IDENTIFIER |
|---|---|---|
| Antibodies | ||
| pan-flavivirus monoclonal antibody 6B6-C1 conjugated to HRP | gift from JT Roehrig, CDC | N/A |
| CD3 (SP34; Alexa Fluor 700) | Becton-Dickinson | Cat# 561805 |
| CD4 (OKT4; BV711) | Biolegend | Cat# 317440 |
| CD8 (SK1; allophycocyanin-cyanine 7 [APC-Cy7]) | Becton-Dickinson | Cat# 557834 |
| CD28 (L293; BV510) | Becton-Dickinson | Cat# 742526 |
| CD95 (DX2; allophycocyanin [APC]) | Becton-Dickinson | Cat# 558814 |
| CD69 (TP1.55.3; phycoerythrin-Texas red [energy- coupled dye; ECD] | Beckman Coulter | Cat# 6607110 |
| gamma interferon (IFN-γ) (B27; phycoerythrin-cyanine 7 [PE-Cy7]) | Becton-Dickinson | Cat# 557643 |
| Ki67 (B56; fluorescein isothiocyanate [FITC]) | Becton-Dickinson | Cat# 561165 |
| CCR5 (3A9; phycoerythrin [PE]) | Becton-Dickinson | Cat# 550632 |
| CCR7(3D12; Pacific Blue) | Becton-Dickinson | 740052 |
| PD-1(EH21.1; peridinin chlorophyll-A-cyanine 5.5 [PerCP-Cy5.5]) | Becton-Dickinson | Cat# 561273 |
| monoclonal mouse anti-ZIKV Env | Biofront | Cat# BF-1176-56-100UG |
| biotinylated horse anti-mouse Ig | Vector Labs | Cat# BP-2000 |
| Bacterial and Virus Strains | ||
| ZIKV-BR; Brazil/ZKV2015, GenBank: KU497555 | Cugola et al., 2016 | N/A |
| ZIKV-PR; PRVABC59, GenBank: KU501215 | NIH | N/A |
| Biological Samples | ||
| ZIKV infected monkey lymph node | This paper | N/A |
| SIV infected monkey lymph node | This paper | N/A |
| Chemicals, Peptides, and Recombinant Proteins | ||
| prM, Env, Cap, and NS1 peptide pools | JPT, Germany Abbink et al. 2016 | PepMixes™ Zika Virus ULTRA |
| Mouse Anti-Human IFN-gamma Capture Ab | BD Biosciences | Cat# 554699 |
| streptavidin-alkaline phosphatase | Southern Biotechnology Associates | Cat #: 7100-04 |
| nitroblue tetrazolium-5-bromo-4-chloro-3-indolyl- phosphate chromogen | Pierce | Cat# 34042 |
| streptavidin-peroxidase conjugate | Dako | PK-6100 (ABC Elite) |
| chromogenic substrate 3,3-diaminobenzidine | Dako | GV825 |
| EMEM media | Lonza | Cat# 12-662F |
| 100x L-glutamine | Lonza | Cat# 17-605E |
| Pen/Strep | Gibco | Cat# 10378016 |
| FBS | Sigma | Cat# F2442-500ml |
| RPMI | Corning | Cat# 10-047-CV |
| Tween 20 | Sigma | Cat# P22887 |
| DPBS | Gibco | Cat# 14190-144 |
| Critical Commercial Assays | ||
| Rhesus Gene 1.0 ST Array rheMac2 | Affymetrix | Cat# 901942 |
| QIAcube HT | Qiagen | Cat# 9001793 |
| Cador Pathogen 96 QIAcube HT Kit | Qiagen | Cat# 54161 |
| RNeasy 96 QIAcube HT Kit | Qiagen | Cat# 74171 |
| RNA Clean & Concentrator™-5 | Zymo Research | Cat# R1015 |
| Monkey ZIKV Env IgG ELISA kit | Alpha Diagnostics | Cat # RV-403110-1 |
| Monkey ZIKV Env IgM ELISA kits | Alpha Diagnostics | Cat # RV-403115-1 |
| Milliplex Nonhuman Primate 23-plex | Millipore | Cat# PCYTMG-40K-PX23 |
| AmpliCap-Max™ T 7 High Yield Message Maker Kit | CellScript | Cat# C-ACM04037 |
| Deposited Data | ||
| Transcriptomics data | This paper | GEO GSE90868 |
| Experimental Models: Cell Lines | ||
| Vero Cells | World Health Organization, NICSC- 011038011038 | N/A |
| Experimental Models: Organisms/Strains | ||
| Rhesus monkeys (Macaca mulatta) | Bioqual, Rockville, MD | N/A |
| Rhesus monkeys (Macaca mulatta) | Alphagenesis, Inc, SC | N/A |
| Oligonucleotides | ||
| ZIKV.Cap.RT.probe AGTTCAAGAAAGATCTGGCTG |
Larocca et al. 2016 | N/A |
| ZIKV.Cap.RT.fwd GGAAAAAAGAGGCTATGGAAATAATAAAG |
Larocca et al. 2016 | N/A |
| ZIKV.Cap.RT.rev CTCCTTCCTAGCATTGATTATTCTCA |
Larocca et al. 2016 | N/A |
| Zika virus strain BeH815744, GenBank: KU365780 | Homo sapiens | N/A |
| Recombinant DNA | ||
| Software and Algorithms | ||
| Gene Set Enrichment Analysis (GSEA) | (Subramanian et al., 2005 | N/A |
| VersaMax microplate reader using Softmax Pro 6.0 software | Molecular Devices | Part# VERSAMAX |
| ELISPOT reader with immunospot software | Cellular Technology Ltd | N/A |
| Agilent 2100 Bioanalyzer | Agilent Technologies | Microarray Core of the Boston University |
| Statistical language R | http://cran.r-project.org/ | http://www.r-project.org/ |
| Linear Models for Microarray Data (LIMMA) statistical package from Bioconductor | Gentleman et al., 2004 | http://bioconductor.org/ |
| Gene functional annotation and network inference | http://cytoscape.org/ | http://cytoscape.org/ |
| Magpix instrument running xPONENT 4.2 | Millipore | Part# MAGPIX-XPONENT |
| GraphPad Prism v6.03 | GraphPad Software | www.graphpad.com/ |
| Viral dynamic data | This paper | http://lixoft.com/products/monolix/ |
| Other | ||
| microneutralization (MN) assay | WRAIR (Larocca et al. 2016) | N/A |
Supplementary Material
ZIKV can persist in cerebrospinal fluid and lymph nodes of infected rhesus monkeys
ZIKV persistence correlates with modulation of specific transcriptomic pathways
ZIKV anatomic sanctuaries may contribute to viral pathogenesis
Acknowledgments
We thank N. Michael, K. Eckels, S. Thomas, R. Jarman, M. Ferguson, K. Kabra, N. Botero, C. Springer, G. Ballarini, R. Olson, R. Ribeiro, C. Cabral, M. Kirilova, Z. Li, D. Ng’ang’a, N. Mercado, B. Lee, S. Mojta, J. Mondesir, and F. Stephens for generous advice, assistance, and reagents. We also thank Y. Alekseyev and A. LeClerc from the Boston University Genomics Core Facility. We acknowledge support from the National Institutes of Health (OD011095, AI028433, AI078881, AI095985, AI096040, AI100663, AI124377) and the Ragon Institute of MGH, MIT, and Harvard.
Footnotes
The authors declare no competing financial interests.
AUTHOR CONTRIBUTIONS
D.H.B. led the study and wrote the manuscript together with all co-authors. P.A., M.B., R.N., and R.A.L. led the virologic analyses. R.A.L., E.T.M., E.N.B., C.C., A.C., A.L.B., K.M., D.J., E.B., L.J.T., and J.L. led the sample processing and immunologic analyses. M.A. and R.A.L. led the transcriptomic analyses. A.J.M. led the histopathologic analyses. K.B. and A.S.P. led the viral dynamics modeling. M.G.L. led the clinical care of the animals.
Publisher's Disclaimer: This is a PDF file of an unedited manuscript that has been accepted for publication. As a service to our customers we are providing this early version of the manuscript. The manuscript will undergo copyediting, typesetting, and review of the resulting proof before it is published in its final citable form. Please note that during the production process errors may be discovered which could affect the content, and all legal disclaimers that apply to the journal pertain.
References
- Abbink P, Larocca RA, De La Barrera RA, Bricault CA, Moseley ET, Boyd M, Kirilova M, Li Z, Ng’ang’a D, Nanayakkara O, et al. Protective efficacy of multiple vaccine platforms against Zika virus challenge in rhesus monkeys. Science. 2016;353:1129–1132. doi: 10.1126/science.aah6157. [DOI] [PMC free article] [PubMed] [Google Scholar]
- Adams Waldorf KM, Stencel-Baerenwald JE, Kapur RP, Studholme C, Boldenow E, Vornhagen J, Baldessari A, Dighe MK, Thiel J, Merillat S, et al. Fetal brain lesions after subcutaneous inoculation of Zika virus in a pregnant nonhuman primate. Nat Med. 2016;22:1256–1259. doi: 10.1038/nm.4193. [DOI] [PMC free article] [PubMed] [Google Scholar]
- Afroz S, Giddaluru J, Abbas MM, Khan N. Transcriptome meta-analysis reveals a dysregulation in extra cellular matrix and cell junction associated gene signatures during Dengue virus infection. Scientific reports. 2016;6:33752. doi: 10.1038/srep33752. [DOI] [PMC free article] [PubMed] [Google Scholar]
- Barba-Spaeth G, Dejnirattisai W, Rouvinski A, Vaney MC, Medits I, Sharma A, Simon-Loriere E, Sakuntabhai A, Cao-Lormeau VM, Haouz A, et al. Structural basis of potent Zika-dengue virus antibody cross-neutralization. Nature. 2016;536:48–53. doi: 10.1038/nature18938. [DOI] [PubMed] [Google Scholar]
- Barouch DH, Ghneim K, Bosche WJ, Li Y, Berkemeier B, Hull M, Bhattacharyya S, Cameron M, Liu J, Smith K, et al. Rapid Inflammasome Activation following Mucosal SIV Infection of Rhesus Monkeys. Cell. 2016;165:656–667. doi: 10.1016/j.cell.2016.03.021. [DOI] [PMC free article] [PubMed] [Google Scholar]
- Barouch DH, Thomas SJ, Michael NL. Prospects for a Zika Virus Vaccine. Immunity. 2017;46:176–182. doi: 10.1016/j.immuni.2017.02.005. [DOI] [PMC free article] [PubMed] [Google Scholar]
- Barros CS, Franco SJ, Muller U. Extracellular matrix: functions in the nervous system. Cold Spring Harbor perspectives in biology. 2011;3:a005108. doi: 10.1101/cshperspect.a005108. [DOI] [PMC free article] [PubMed] [Google Scholar]
- Bhatnagar J, Rabeneck DB, Martines RB, Reagan-Steiner S, Ermias Y, Estetter LB, Suzuki T, Ritter J, Keating MK, Hale G, et al. Zika Virus RNA Replication and Persistence in Brain and Placental Tissue. Emerging infectious diseases. 2017;23:405–414. doi: 10.3201/eid2303.161499. [DOI] [PMC free article] [PubMed] [Google Scholar]
- Brasil P, Pereira JP, Jr, Moreira ME, Ribeiro Nogueira RM, Damasceno L, Wakimoto M, Rabello RS, Valderramos SG, Halai UA, Salles TS, et al. Zika Virus Infection in Pregnant Women in Rio de Janeiro. N Engl J Med. 2016a;375:2321–2334. doi: 10.1056/NEJMoa1602412. [DOI] [PMC free article] [PubMed] [Google Scholar]
- Brasil P, Sequeira PC, Freitas AD, Zogbi HE, Calvet GA, de Souza RV, Siqueira AM, de Mendonca MC, Nogueira RM, de Filippis AM, et al. Guillain-Barre syndrome associated with Zika virus infection. Lancet. 2016b;387:1482. doi: 10.1016/S0140-6736(16)30058-7. [DOI] [PubMed] [Google Scholar]
- Calvet G, Aguiar RS, Melo AS, Sampaio SA, de Filippis I, Fabri A, Araujo ES, de Sequeira PC, de Mendonca MC, de Oliveira L, et al. Detection and sequencing of Zika virus from amniotic fluid of fetuses with microcephaly in Brazil: a case study. Lancet Infect Dis. 2016 doi: 10.1016/S1473-3099(16)00095-5. [DOI] [PubMed] [Google Scholar]
- Charles AS, Christofferson RC. Utility of a Dengue-Derived Monoclonal Antibody to Enhance Zika Infection In Vitro. PLoS currents. 2016;8 doi: 10.1371/currents.outbreaks.4ab8bc87c945eb41cd8a49e127082620. [DOI] [PMC free article] [PubMed] [Google Scholar]
- Cloetta D, Thomanetz V, Baranek C, Lustenberger RM, Lin S, Oliveri F, Atanasoski S, Ruegg MA. Inactivation of mTORC1 in the developing brain causes microcephaly and affects gliogenesis. The Journal of neuroscience : the official journal of the Society for Neuroscience. 2013;33:7799–7810. doi: 10.1523/JNEUROSCI.3294-12.2013. [DOI] [PMC free article] [PubMed] [Google Scholar]
- Cugola FR, Fernandes IR, Russo FB, Freitas BC, Dias JL, Guimaraes KP, Benazzato C, Almeida N, Pignatari GC, Romero S, et al. The Brazilian Zika virus strain causes birth defects in experimental models. Nature. 2016;534:267–271. doi: 10.1038/nature18296. [DOI] [PMC free article] [PubMed] [Google Scholar]
- de Boer E, Samuel S, French DN, Warram JM, Schoeb TR, Rosenthal EL, Zinn KR. Biodistribution Study of Intravenously Injected Cetuximab-IRDye700DX in Cynomolgus Macaques. Molecular imaging and biology : MIB : the official publication of the Academy of Molecular Imaging. 2016;18:232–242. doi: 10.1007/s11307-015-0892-y. [DOI] [PubMed] [Google Scholar]
- Dejnirattisai W, Supasa P, Wongwiwat W, Rouvinski A, Barba-Spaeth G, Duangchinda T, Sakuntabhai A, Cao-Lormeau VM, Malasit P, Rey FA, et al. Dengue virus sero-cross-reactivity drives antibody-dependent enhancement of infection with zika virus. Nat Immunol. 2016 doi: 10.1038/ni.3515. [DOI] [PMC free article] [PubMed] [Google Scholar]
- Dos Santos T, Rodriguez A, Almiron M, Sanhueza A, Ramon P, de Oliveira WK, Coelho GE, Badaro R, Cortez J, Ospina M, et al. Zika Virus and the Guillain-Barre Syndrome - Case Series from Seven Countries. N Engl J Med. 2016;375:1598–1601. doi: 10.1056/NEJMc1609015. [DOI] [PubMed] [Google Scholar]
- Driggers RW, Ho CY, Korhonen EM, Kuivanen S, Jaaskelainen AJ, Smura T, Rosenberg A, Hill DA, DeBiasi RL, Vezina G, et al. Zika Virus Infection with Prolonged Maternal Viremia and Fetal Brain Abnormalities. N Engl J Med. 2016 doi: 10.1056/NEJMoa1601824. [DOI] [PubMed] [Google Scholar]
- Dudley DM, Aliota MT, Mohr EL, Weiler AM, Lehrer-Brey G, Weisgrau KL, Mohns MS, Breitbach ME, Rasheed MN, Newman CM, et al. A rhesus macaque model of Asian-lineage Zika virus infection. Nature communications. 2016;7:12204. doi: 10.1038/ncomms12204. [DOI] [PMC free article] [PubMed] [Google Scholar]
- Gentleman RC, Carey VJ, Bates DM, Bolstad B, Dettling M, Dudoit S, Ellis B, Gautier L, Ge Y, Gentry J, et al. Bioconductor: open software development for computational biology and bioinformatics. Genome biology. 2004;5:R80. doi: 10.1186/gb-2004-5-10-r80. [DOI] [PMC free article] [PubMed] [Google Scholar]
- Govero J, Esakky P, Scheaffer SM, Fernandez E, Drury A, Platt DJ, Gorman MJ, Richner JM, Caine EA, Salazar V, et al. Zika virus infection damages the testes in mice. Nature. 2016 doi: 10.1038/nature20556. [DOI] [PMC free article] [PubMed] [Google Scholar]
- Guedj J, Dahari H, Rong L, Sansone ND, Nettles RE, Cotler SJ, Layden TJ, Uprichard SL, Perelson AS. Modeling shows that the NS5A inhibitor daclatasvir has two modes of action and yields a shorter estimate of the hepatitis C virus half-life. Proc Natl Acad Sci U S A. 2013;110:3991–3996. doi: 10.1073/pnas.1203110110. [DOI] [PMC free article] [PubMed] [Google Scholar]
- Hamel R, Dejarnac O, Wichit S, Ekchariyawat P, Neyret A, Luplertlop N, Perera-Lecoin M, Surasombatpattana P, Talignani L, Thomas F, et al. Biology of Zika Virus Infection in Human Skin Cells. J Virol. 2015;89:8880–8896. doi: 10.1128/JVI.00354-15. [DOI] [PMC free article] [PubMed] [Google Scholar]
- Hirsch AJ, Smith JL, Haese NN, Broeckel RM, Parkins CJ, Kreklywich C, DeFilippis VR, Denton M, Smith PP, Messer WB, et al. Zika Virus infection of rhesus macaques leads to viral persistence in multiple tissues. PLoS Pathog. 2017;13:e1006219. doi: 10.1371/journal.ppat.1006219. [DOI] [PMC free article] [PubMed] [Google Scholar]
- Honein MA, Dawson AL, Petersen EE, Jones AM, Lee EH, Yazdy MM, Ahmad N, Macdonald J, Evert N, Bingham A, et al. Birth Defects Among Fetuses and Infants of US Women With Evidence of Possible Zika Virus Infection During Pregnancy. JAMA. 2017;317:59–68. doi: 10.1001/jama.2016.19006. [DOI] [PubMed] [Google Scholar]
- Johansson MA, Mier YT-RL, Reefhuis J, Gilboa SM, Hills SL. Zika and the Risk of Microcephaly. N Engl J Med. 2016 doi: 10.1056/NEJMp1605367. [DOI] [PMC free article] [PubMed] [Google Scholar]
- Kassai H, Sugaya Y, Noda S, Nakao K, Maeda T, Kano M, Aiba A. Selective activation of mTORC1 signaling recapitulates microcephaly, tuberous sclerosis, and neurodegenerative diseases. Cell reports. 2014;7:1626–1639. doi: 10.1016/j.celrep.2014.04.048. [DOI] [PubMed] [Google Scholar]
- Larocca RA, Abbink P, Peron JP, Zanotto PM, Iampietro MJ, Badamchi-Zadeh A, Boyd M, Ng’ang’a D, Kirilova M, Nityanandam R, et al. Vaccine protection against Zika virus from Brazil. Nature. 2016;536:474–478. doi: 10.1038/nature18952. [DOI] [PMC free article] [PubMed] [Google Scholar]
- Lazear HM, Govero J, Smith AM, Platt DJ, Fernandez E, Miner JJ, Diamond MS. A Mouse Model of Zika Virus Pathogenesis. Cell Host Microbe. 2016;19:720–730. doi: 10.1016/j.chom.2016.03.010. [DOI] [PMC free article] [PubMed] [Google Scholar]
- Liberzon A, Birger C, Thorvaldsdottir H, Ghandi M, Mesirov JP, Tamayo P. The Molecular Signatures Database (MSigDB) hallmark gene set collection. Cell systems. 2015;1:417–425. doi: 10.1016/j.cels.2015.12.004. [DOI] [PMC free article] [PubMed] [Google Scholar]
- Lipton JO, Sahin M. The neurology of mTOR. Neuron. 2014;84:275–291. doi: 10.1016/j.neuron.2014.09.034. [DOI] [PMC free article] [PubMed] [Google Scholar]
- Miner JJ, Cao B, Govero J, Smith AM, Fernandez E, Cabrera OH, Garber C, Noll M, Klein RS, Noguchi KK, et al. Zika Virus Infection during Pregnancy in Mice Causes Placental Damage and Fetal Demise. Cell. 2016;165:1081–1091. doi: 10.1016/j.cell.2016.05.008. [DOI] [PMC free article] [PubMed] [Google Scholar]
- Mlakar J, Korva M, Tul N, Popovic M, Poljsak-Prijatelj M, Mraz J, Kolenc M, Resman Rus K, Vesnaver Vipotnik T, Fabjan Vodusek V, et al. Zika Virus Associated with Microcephaly. N Engl J Med. 2016;374:951–958. doi: 10.1056/NEJMoa1600651. [DOI] [PubMed] [Google Scholar]
- Murray KO, Gorchakov R, Carlson AR, Berry R, Lai L, Natrajan M, Garcia MN, Correa A, Patel SM, Aagaard K, et al. Prolonged Detection of Zika Virus in Vaginal Secretions and Whole Blood. Emerging infectious diseases. 2017;23:99–101. doi: 10.3201/eid2301.161394. [DOI] [PMC free article] [PubMed] [Google Scholar]
- Nakaya HI, Wrammert J, Lee EK, Racioppi L, Marie-Kunze S, Haining WN, Means AR, Kasturi SP, Khan N, Li GM, et al. Systems biology of vaccination for seasonal influenza in humans. Nat Immunol. 2011;12:786–795. doi: 10.1038/ni.2067. [DOI] [PMC free article] [PubMed] [Google Scholar]
- Osuna CE, Lim SY, Deleage C, Griffin BD, Stein D, Schroeder LT, Omange R, Best K, Luo M, Hraber PT, et al. Zika viral dynamics and shedding in rhesus and cynomolgus macaques. Nat Med. 2016 doi: 10.1038/nm.4206. [DOI] [PMC free article] [PubMed] [Google Scholar]
- Parra B, Lizarazo J, Jimenez-Arango JA, Zea-Vera AF, Gonzalez-Manrique G, Vargas J, Angarita JA, Zuniga G, Lopez-Gonzalez R, Beltran CL, et al. Guillain-Barre Syndrome Associated with Zika Virus Infection in Colombia. N Engl J Med. 2016;375:1513–1523. doi: 10.1056/NEJMoa1605564. [DOI] [PubMed] [Google Scholar]
- Pawelek KA, Huynh GT, Quinlivan M, Cullinane A, Rong L, Perelson AS. Modeling within-host dynamics of influenza virus infection including immune responses. PLoS Comput Biol. 2012;8:e1002588. doi: 10.1371/journal.pcbi.1002588. [DOI] [PMC free article] [PubMed] [Google Scholar]
- Powell JD, Pollizzi KN, Heikamp EB, Horton MR. Regulation of immune responses by mTOR. Annu Rev Immunol. 2012;30:39–68. doi: 10.1146/annurev-immunol-020711-075024. [DOI] [PMC free article] [PubMed] [Google Scholar]
- Ramratnam B, Bonhoeffer S, Binley J, Hurley A, Zhang L, Mittler JE, Markowitz M, Moore JP, Perelson AS, Ho DD. Rapid production and clearance of HIV-1 and hepatitis C virus assessed by large volume plasma apheresis. Lancet. 1999;354:1782–1785. doi: 10.1016/S0140-6736(99)02035-8. [DOI] [PubMed] [Google Scholar]
- Rasmussen SA, Jamieson DJ, Honein MA, Petersen LR. Zika Virus and Birth Defects--Reviewing the Evidence for Causality. N Engl J Med. 2016;374:1981–1987. doi: 10.1056/NEJMsr1604338. [DOI] [PubMed] [Google Scholar]
- Sapparapu G, Fernandez E, Kose N, Cao B, Fox JM, Bombardi RG, Zhao H, Nelson CA, Bryan AL, Barnes T, et al. Neutralizing human antibodies prevent Zika virus replication and fetal disease in mice. Nature. 2016 doi: 10.1038/nature20564. [DOI] [PMC free article] [PubMed] [Google Scholar]
- Savidis G, Perreira JM, Portmann JM, Meraner P, Guo Z, Green S, Brass AL. The IFITMs Inhibit Zika Virus Replication. Cell reports. 2016;15:2323–2330. doi: 10.1016/j.celrep.2016.05.074. [DOI] [PubMed] [Google Scholar]
- Schoggins JW, Wilson SJ, Panis M, Murphy MY, Jones CT, Bieniasz P, Rice CM. A diverse range of gene products are effectors of the type I interferon antiviral response. Nature. 2011;472:481–485. doi: 10.1038/nature09907. [DOI] [PMC free article] [PubMed] [Google Scholar]
- Soares CN, Brasil P, Carrera RM, Sequeira P, de Filippis AB, Borges VA, Theophilo F, Ellul MA, Solomon T. Fatal encephalitis associated with Zika virus infection in an adult. Journal of clinical virology : the official publication of the Pan American Society for Clinical Virology. 2016;83:63–65. doi: 10.1016/j.jcv.2016.08.297. [DOI] [PubMed] [Google Scholar]
- Stettler K, Beltramello M, Espinosa DA, Graham V, Cassotta A, Bianchi S, Vanzetta F, Minola A, Jaconi S, Mele F, et al. Specificity, cross-reactivity and function of antibodies elicited by Zika virus infection. Science. 2016 doi: 10.1126/science.aaf8505. [DOI] [PubMed] [Google Scholar]
- Subramanian A, Tamayo P, Mootha VK, Mukherjee S, Ebert BL, Gillette MA, Paulovich A, Pomeroy SL, Golub TR, Lander ES, et al. Gene set enrichment analysis: a knowledge-based approach for interpreting genome-wide expression profiles. Proc Natl Acad Sci U S A. 2005;102:15545–15550. doi: 10.1073/pnas.0506580102. [DOI] [PMC free article] [PubMed] [Google Scholar]
- Switon K, Kotulska K, Janusz-Kaminska A, Zmorzynska J, Jaworski J. Molecular neurobiology of mTOR. Neuroscience. 2017;341:112–153. doi: 10.1016/j.neuroscience.2016.11.017. [DOI] [PubMed] [Google Scholar]
- Thomanetz V, Angliker N, Cloetta D, Lustenberger RM, Schweighauser M, Oliveri F, Suzuki N, Ruegg MA. Ablation of the mTORC2 component rictor in brain or Purkinje cells affects size and neuron morphology. The Journal of cell biology. 2013;201:293–308. doi: 10.1083/jcb.201205030. [DOI] [PMC free article] [PubMed] [Google Scholar]
- Thoreen CC. The molecular basis of mTORC1-regulated translation. Biochemical Society transactions. 2017;45:213–221. doi: 10.1042/BST20160072. [DOI] [PubMed] [Google Scholar]
- Tichauer KM, Samkoe KS, Gunn JR, Kanick SC, Hoopes PJ, Barth RJ, Kaufman PA, Hasan T, Pogue BW. Microscopic lymph node tumor burden quantified by macroscopic dual-tracer molecular imaging. Nat Med. 2014;20:1348–1353. doi: 10.1038/nm.3732. [DOI] [PMC free article] [PubMed] [Google Scholar]
- Wang W, Wang EQ, Balthasar JP. Monoclonal antibody pharmacokinetics and pharmacodynamics. Clinical pharmacology and therapeutics. 2008;84:548–558. doi: 10.1038/clpt.2008.170. [DOI] [PubMed] [Google Scholar]
- Zhang F, Hammack C, Ogden SC, Cheng Y, Lee EM, Wen Z, Qian X, Nguyen HN, Li Y, Yao B, et al. Molecular signatures associated with ZIKV exposure in human cortical neural progenitors. Nucleic acids research. 2016;44:8610–8620. doi: 10.1093/nar/gkw765. [DOI] [PMC free article] [PubMed] [Google Scholar]
Associated Data
This section collects any data citations, data availability statements, or supplementary materials included in this article.