Abstract
Atlases constructed using diffusion‐weighted imaging are important tools for studying human brain development. Atlas construction is in general a two‐step process involving spatial registration and fusion of individual images. The focus of most studies so far has been on improving the accuracy of registration while image fusion is commonly performed using simple averaging, often resulting in fuzzy atlases. In this article, we propose a patch‐based method for diffusion‐weighted (DW) atlas construction. Unlike other atlases that are based on the diffusion tensor model, our atlas is model‐free and generated directly from the diffusion‐weighted images. Instead of independently generating an atlas for each gradient direction and hence neglecting angular image correlation, we propose to construct the atlas by jointly considering DW images of neighboring gradient directions. We employ a group regularization framework where local patches of angularly neighboring images are constrained for consistent spatio‐angular atlas reconstruction. Experimental results confirm that our atlas, constructed for neonatal data, reveals more structural details with higher fractional anisotropy than the atlas generated without angular consistency as well as the average atlas. Also the normalization of test subjects to the proposed atlas results in better alignment of brain structures. Hum Brain Mapp 38:3175–3189, 2017. © 2017 Wiley Periodicals, Inc.
Keywords: neonatal brain atlases, diffusion MRI, sparse representation, multi‐task learning, spatio‐angular consistency
INTRODUCTION
MRI brain atlases are widely used for neuroscience studies, disease diagnosis [Evans et al., 2012], and identifying traits of typical or abnormal brain development [Deshpande et al., 2015; Shi et al., 2012; Xue et al., 2006b; Wang et al., 2014; Zhang et al., 2015; Wang et al., 2011; Jia et al., 2012]. Among many imaging modalities used for constructing atlases, diffusion‐weighted imaging (DWI) is a key modality for investigating white matter changes [Chilla et al., 2015; Verma et al., 2005], especially in the developing infant brain, which is characterized by dynamic myelination [Huang et al., 2006]. However, diffusion‐weighted (DW) atlases constructed specifically for infants, especially neonates, are lacking. Atlases of adults or older children [Hua et al., 2008; Mori et al., 2005] are not optimal for neonatal studies, since the white matter structures develop very rapidly in the first year of life and are in general dissimilar to those of the older age groups. Therefore, atlases constructed specifically for neonates are highly desirable for neonatal studies.
In DWI, various models have been used to characterize the diffusion patterns of water molecules measured by the diffusion MRI signal [Johansen‐Berg and Behrens, 2013]. Most existing atlases are based on the diffusion tensor model (DTM). Despite its wide utility, DTM assumes one coherent fiber bundle per voxel and fails in regions with fiber crossings. Although this can be overcome by higher‐order models, such as the multi‐tensor model [Descoteaux et al., 2006], the utility of a model‐based atlas is dictated by the model by which it is generated. In this work, we focus on constructing a model‐free atlas that is based on the diffusion‐weighted images directly. Our atlas is hence not reliant on any model and can be used for multifaceted analysis using different diffusion models.
In general, constructing atlases involves two major steps: a spatial registration step to align a population of images to a common space, followed by an image fusion step that combines all the aligned images into an atlas. The focus of most effort so far has been on the improvement of the spatial registration step [Jia et al., 2010; Oishi et al., 2011; Shen et al., 1999; Tang et al., 2009; Xue et al., 2006a; Yap et al., 2009; Yang et al., 2008; Zacharaki et al., 2008]. For image fusion, simple or weighted averaging is typically used. Image averaging typically blurs fine anatomical details and is sensitive to outliers. To overcome these drawbacks, Shi et al. proposed a patch‐based sparse representation method for image fusion to construct T2‐weighted atlases [Shi et al., 2014]. They simultaneously represent K nearest patches to the mean patch by sparse selection from an overcomplete codebook. Selected patches are fused to construct the atlas. They enforce spatial consistency by using group LASSO [Liu et al., 2009] to ensure that neighboring patches have similar representations.
In DWI, each image is sensitized to the diffusion of water molecules in the direction of a magnetic diffusion gradient. Since DW images associated with gradients of neighboring directions are sensitized to diffusion in similar directions, there should be some form of angular consistency when a DW atlas is constructed. In this article, we propose to employ a group‐regularized estimation framework to enforce spatio‐angular consistency in patch‐based atlas construction. Each patch in the atlas is constructed using similar patches in a spatio‐angular neighborhood. We apply our method to construct an atlas from neonatal DWI data. DW images of neonates typically suffer from insufficient spatial details. Enforcing spatio‐angular consistency improves the preservation of anatomical details. Experimental results indicate that our proposed atlas, when used as a template for individual DW image normalization, preserves white matter integrity better than the other atlases without angular consistency. Moreover, the proposed atlas reveals more structural details with higher anisotropy.
A preliminary version of the method has been published in a workshop [Saghafi et al., 2016]. Here, we improve the robustness of the method to outliers by employing a mean shift algorithm. This results in DW atlas with sharper details. We have also added extensive experiments to validate the choices of the parameters and the effectiveness of the proposed method. The rest of the article is organized as follows. Section “Proposed Method” details the proposed method. Section “Experiments” reports the experimental results. Finally, section “Conclusion” concludes the article.
PROPOSED METHOD
Overview
In order to construct the atlas, DW images of all subjects are first registered to a common space. Then, for each gradient direction, each patch on the atlas is constructed using a sparse subset of spatio‐angular neighboring patches, obtained based on a reference patch. Here, the reference patch is computed using the mean shift algorithm from the images of all subjects. For consistency, neighboring patches are constructed concurrently.
Image Preprocessing
All DW images are preprocessed in preparation for atlas construction. The preprocessing steps are as follows: (1) Correction of subject motion and eddy current distortion by registering all DW volumes to the b = 0 volume using the eddy correct function in the FSL package [Jenkinson et al., 2012], (2) brain region extraction by applying the brain extraction tool (BET) [Smith, 2002] in the FSL on the b = 0 image of the acquisition, and (3) removal of hyper‐intensity voxels, surrounding the brain region due to eddy distortions, by applying binary erosion to the brain mask [Schwarz et al., 2014].
The processed DW images are aligned to a common space, obtained by a group‐wise registration [Joshi et al., 2004] using their fractional anisotropy (FA) images. In this approach, the FA images of all subjects are first aligned to their geometric median image using affine registration. Then, they are iteratively registered to the average FA image via non‐linear registration with diffeomorphic demons [Vercauteren et al., 2009] until the average FA image is not changed. The DW images are eventually warped to the common space with the deformation fields to the average FA image. The diffusion signals are reorientated by utilizing affine transformations that are estimated locally from the non‐linear deformation fields [Chen et al., 2016].
Atlas Construction via Spatio‐Angular Consistency
Patch‐based sparse representation
For each gradient direction, we construct the atlas using overlapped patches. Patch‐based approaches are more robust to noise than voxel‐based approaches. Each patch is of size . The intensity values associated with each patch is denoted using vector p with elements.
To avoid structural blurring, we fuse spatio‐angular patches across subjects using a sparse representation framework. For each patch on the atlas, we construct a codebook C consisting of same location patches from N subjects, that is, . The atlas patch, , is estimated using , where x is a sparse coefficient vector. Construction of atlas patch using same location patches is illustrated in Figure 1.
Figure 1.
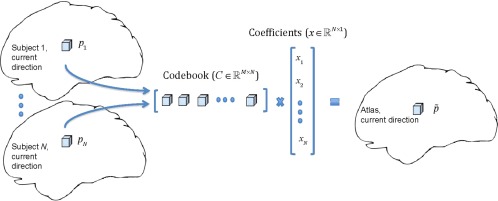
Construction of a patch on the atlas by sparse representation. [Color figure can be viewed at http://wileyonlinelibrary.com]
To construct a particular patch of the atlas, we estimate a sparse coefficient vector x from the codebook (C) and a reference patch (y), representing a weighted average of the density distributions across subjects, by solving the following ‐norm regularized least‐squares problem [Tibshirani, 1996]:
| (1) |
where . The first term is the fitting term that minimizes the squared l 2‐norm distance between the reconstructed atlas patch Cx and the reference patch y. The second term is the regularization term that minimizes the l 1‐norm of the coefficient vector x and promotes sparsity. Tuning parameter controls the amount of regularization.
The reference patch y is determined by a variable bandwidth mean shift algorithm [Comaniciu et al., 2001] from the aligned patches . The mean shift algorithm converges to the mode of the distribution of samples, as seen in Figure 2c, and is thus robust to outliers, unlike averaging the K nearest patches as done in Saghafi et al. [2016]. Each component of patch y, , is obtained iteratively using
| (2) |
where
| (3) |
and is an estimate of a component of y at the j‐th iteration. The initial estimate is computed as the average of . The function is a Gaussian kernel:
| (4) |
Figure 2.

An illustration of the variable‐bandwidth mean shift algorithm. (a) Bandwidth ( ) versus component ( ); (b) Weight (α) versus component ( ); (c) Normalized histogram of samples. The blue bar marks the mean, and the red bar marks the mode estimated by the mean shift algorithm. [Color figure can be viewed at http://wileyonlinelibrary.com]
The bandwidth for each is computed using the following steps [Comaniciu et al., 2001]:
- Compute a pilot estimate of the density function,
(5)
using a fixed bandwidth .
-
1Compute
(6) -
2
Compute .
The bandwidth is computed as the standard deviation of . See Figure 2 for an illustration of the variable‐bandwidth mean shift algorithm.
Spatio‐angular consistency via multi‐task LASSO
To promote spatial consistency, we constrain nearby patches to be represented using similar corresponding patches in the codebooks. For each patch, we consider its 6 connected patches, grouping them in a spatial group of size G = 7. Let Cg, xg, and yg represent the codebook, coefficient vector, and reference patch for the g‐th group member, respectively. We group the coefficient vectors using matrix . X can also be written in the form of row vectors , where ui indicates the i‐th row. We estimate X by solving the following ‐norm regularized multi‐task least‐squares problem [Liu et al., 2009]:
| (7) |
where .
We propose to construct the diffusion atlas by jointly considering diffusion‐weighted images of neighboring gradient directions. For simplicity, we index different gradient directions as . We solve the following problem:
| (8) |
where , and denote the codebook, coefficient vector, and reference patch for the g‐th spatial group member and d‐th gradient direction, respectively, and . Figure 3 illustrates the constraint on the coefficient matrix in Eq. (8), that is, . We compute l 2‐norm from the rows. Then we compute the l 1‐norm of the results to obtain the final ‐norm. Minimizing the ‐norm makes the coefficients of the current and neighboring gradient directions to be sparse.
Figure 3.
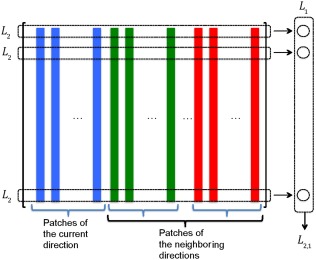
constraint on the matrix of coefficients in Eq. (8). [Color figure can be viewed at http://wileyonlinelibrary.com]
The inclusion/exclusion of each gradient direction for consideration in Eq. (8) is controlled by wd, which is defined as
| (9) |
where is the angular distance between the unit vectors along current direction ( ) and the d‐th direction . ε is the threshold for angular distance. This will allow an atlas patch to be constructed jointly with patches in both spatial and angular neighborhoods. The binary weights wd will include the Xds close to current gradient direction and exclude the rest. Figure 4a shows how the binary weight is determined based on angular distance with the current direction. Figure 4b shows same‐location spatial group patches from three gradient directions and the current direction. Two of the gradient directions (blue and green) are within the angular distance threshold based on (a) and are included for consideration in Eq. (8). On the other hand, the red direction is excluded.
Figure 4.
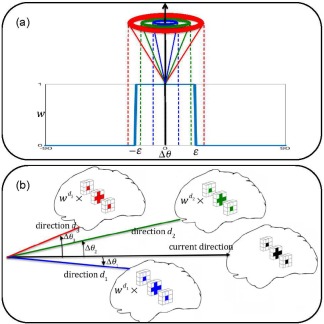
(a) The participation weight for each gradient direction is determined based on its angular distance from the current direction; (b) Same‐location spatial group patches from 3 gradient directions as well as the current direction. Two of the gradient directions (blue and green) are within the angular distance threshold based on figure (a) and are included in patch reconstruction. On the other hand, the red direction is excluded. [Color figure can be viewed at http://wileyonlinelibrary.com]
Eventually the atlas patch for the current direction (d = 1), is reconstructed sparsely from the overcomplete codebook (associated with the 1th spatial group member and 1th gradient direction) by . The pseudo‐code of proposed method is given in Algorithm 1. This algorithm applies for diffusion‐weighted images. For non‐diffusion‐weighted images we use Eq. (7).
Algorithm 1.
Diffusion‐weighted Atlas Construction with Spatio‐Angular Consistency
Input: N registered sets of diffusion‐weighted (DW) images.
Output: DW atlas.
for the dth gradient direction do
Find neighboring gradient directions according to Eq. (9).
for each patch on the atlas do
-
1
Construct a codebook including the same location patches of N subjects.
-
2
Assign the reference patch by computing mean shift from N same location patches for each spatio‐angular neighbor.
-
3
Compute a sparse coefficient vector to represent the reference patch based on the codebook using Eq. (8).
-
4
Estimate the atlas patch by multiplying the codebook with the coefficient vector .
end for
Obtain the DW image of the atlas associated with the current gradient direction by averaging the estimates over overlapping patches.
end for
To prevent abrupt changes at the patch boundaries, the patches are allowed to overlap. The final atlas is obtained by averaging multiple estimations at each patch location.
EXPERIMENTS
Dataset
The DWI data of 30 healthy neonates [postnatal age: 14e:n days (27 2 9)] were acquired using the 3T Siemens Allegra scanner. All of the subjects were born at full term. DW imaging was performed with a spin‐echo echo‐planar imaging sequence with TR/TE = 7,680/82 ms, resolution = , and . For each neonate, diffusion‐weighted images were acquired with 42 non‐collinear diffusion gradients. Seven non‐diffusion‐weighted reference scans were also acquired. The dimension of the diffusion‐weighted image is . In order to evaluate the effectiveness of the proposed method, we have performed three‐fold cross‐validation. In the following experiments, we first show how the parameters are selected for the training dataset (20 subject) in each fold. Then, we demonstrate the effectiveness of the proposed method in DW atlas construction and image normalization, compared with various patch‐based fusion methods.
Effects of Parameters in the DW Atlas Construction
For constructing the neonate brain atlas, the following parameters need to be determined: (1) λ used to control the sparsity and the spatio‐angular consistency with regularization, (2) the patch size and also the step size used for patch shifting in each dimension, and (3) the angular distance threshold, ε, used for determining the angular neighbors for each diffusion‐weighted volume. In order to determine the optimal parameters, we compare the atlases using the following criteria: (1) the intensity changes of DW images and their fractional anisotropy, and (2) the level of detail in the FA maps. This is quantified using a total variation metric, defined as the sum of magnitudes of image gradients [Vogel and Oman, 1998]. Note that the parameter λ is adjusted so that it is proportional to the number of subjects and the number of spatial and angular neighbors.
As shown in Figure 5, the image intensity and anisotropy of the resulted DW atlases varies with λ. We set λ to 1.0 because this results in smaller difference in image intensity with respect to the average DW atlas and also similar level of detail as the subjectsy FA maps. The total variation of subjectsn FA maps is in a range of 55.98–96.42 (68.62 8.6.20). The total variation of the atlas with λ = 1 is 71.39. Figure 5 also shows the slices of the DW atlases with the FA and color‐coded FA maps. As λ increases to 1.0, the boundaries of white matter structures can be distinguished more clearly (as indicated by arrows in Fig. 5). However, with large values (1.5 and 2.0), the average FA exceeds the subjectsd average and the FA maps become more noisy. The patch size is determined using the same metrics. As shown in Figure 6, the small patch size (=2) results in blurry FA map (arrows in Fig. 6) and the lowest total variation. The different patch sizes (=4, 6, and 8) provided very similar visual results and also the average FA and total variation. We choose 6 for the patch size, which shows the highest total variation. The step size is determined as 1 to avoid block artifacts in the resulting atlas. Finally, the angular distance threshold, ε, is chosen to involve a sufficient number of angular neighbors in the patch‐based sparse representation. Table 1 lists the total number of gradient direction pairs and the median number of the neighboring within ε. Choosing ε = 22° gives us an average of 2 angular neighbors for each gradient direction.
Figure 5.
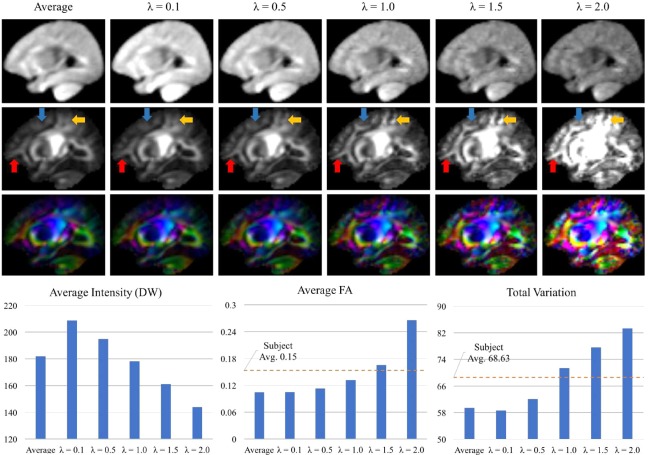
Effects of the weight parameter λ for the regularization in the diffusion‐weighted (DW) atlas construction. The plots at bottom row indicate the average intensity of the visualized slice of the DW atlas, the average of its fractional anisotropy (FA) map, and the total variation of the FA map. “Subject Avg.” means the average of corresponding metrics from the training subjects, images. [Color figure can be viewed at http://wileyonlinelibrary.com]
Figure 6.
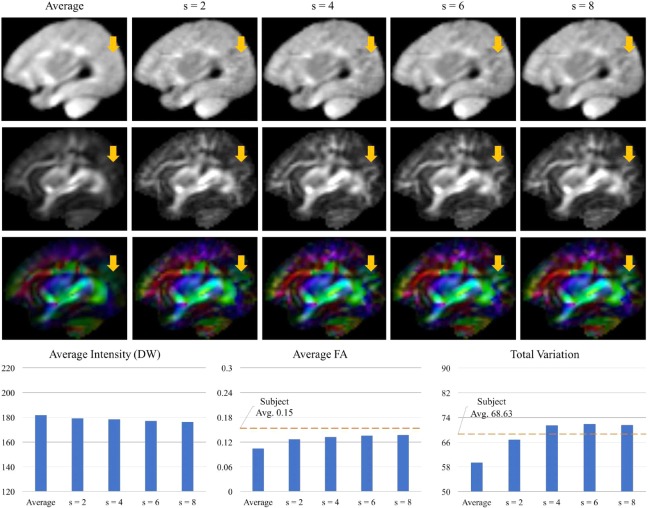
Effects of the patch size in the diffusion‐weighted (DW) atlas construction. The plots at bottom row indicate the average intensity of the visualized slice of the diffusion‐weighted (DW) atlas, the average of its fractional anisotropy (FA) map, and the total variation of the FA map. “Subject Avg.” means the average of corresponding metrics from the training subjects' images. [Color figure can be viewed at http://wileyonlinelibrary.com]
Table 1.
Relationship between the neighboring gradient directions and the angular distance threshold (ε) in the acquired diffusion‐weighted images
| ε (degrees) | Number of direction pairs | Median number of neighboring directions |
|---|---|---|
| 15 | 0 | 0 |
| 20 | 13 | 1 |
| 22 | 33 | 2 |
| 25 | 78 | 4 |
| 45 | 241 | 11 |
| 90 | 861 | 41 |
Sparse construction of a DW atlas takes about 10 hours on an Intel i7 processor with 3.4 GHz and 16 GB of memory, based on our current MATLAB implementation. The processing time depends on both image dimensions and parameter settings. For instance, choosing a higher angular distance threshold (i.e., involving more angular neighbors) will increase the overall processing time.
Effect of Codebook in the DW Atlas Construction
Unlike existing methods using sparse representation for T1‐weighted or T2‐weighted atlas construction [Shi et al., 2014; Zhang et al., 2016], we build the codebook using samples extracted from individual images at corresponding patch locations for DW atlas construction. To evaluate the effect of the number of samples in the codebook, we have compared the atlases generated using two codebooks: (1) patches from the same location and (2) patches from 26 neighboring locations. Figure 7 shows that the second codebook produces a blurred DW atlas, indicating that the redundancy in the second codebook raised issue in selecting correct patches for DW atlas construction. For this reason, we have chosen to use the first codebook.
Figure 7.
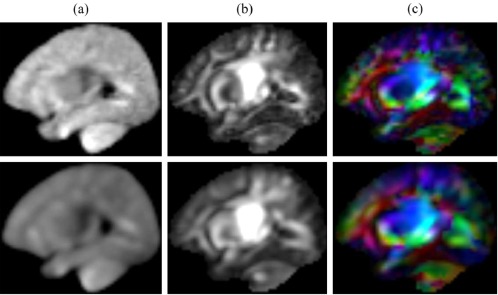
(a) A diffusion‐weighted image, (b) fractional anisotropy (FA) and (c) color‐coded FA map from the atlases constructed using (Top) same location patches and (Bottom) 26 neighboring patches for the codebook. [Color figure can be viewed at http://wileyonlinelibrary.com]
Comparison with Different Patch‐Based Fusion Methods
We have compared the proposed method with other patch‐based fusion techniques, i.e. the atlases obtained via (1) the average of all training DW images, (2) the average of K‐closest patches to the average patch, (3) the median of all training DW patches, (4) sparse representation with spatial constraint only, and (5) the proposed method for spatio‐angular consistency. We determine K as 4, which provides similar total variation as the atlas of the proposed method. The FA and color‐coded FA maps of the resulting atlases are shown in Figure 8. The atlases obtained by sparse representation are less fuzzy and contain more white matter details. This is mainly because sparse representation tends to choose a sparse set of samples from a large number of patches to fit to the reference patch. Unlike simple averaging, the sparse representation combines a smaller set of samples, thus avoiding over‐smoothing. Considering the spatio‐angular consistency, our method preserves more structural details with greater anisotropy. The orientation distribution functions (ODFs) [Yap et al., 2016], shown in Figure 9, indicate that our atlas gives more coherent fiber orientations, especially in the cerebral cortex.
Figure 8.
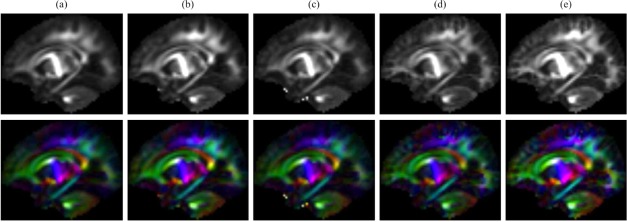
(Top) Fractional anisotropy (FA) and (Bottom) color‐coded FA maps of the diffusion‐weighted atlases, acquired by (a) average, (b) average of 4‐closest patches to average, (c) median, (d) sparse representation with spatial consistency, and (e) sparse representation with spatio‐angular consistency. [Color figure can be viewed at http://wileyonlinelibrary.com]
Figure 9.
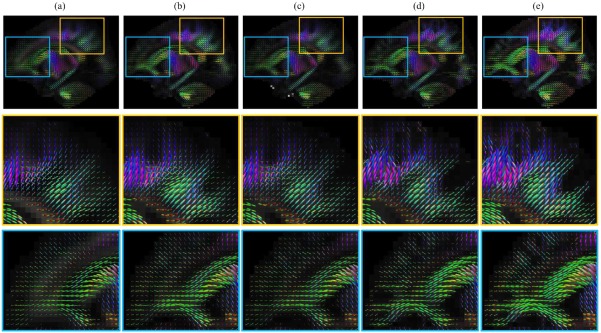
Orientation distribution functions (ODFs) of the diffusion‐weighted atlases, acquired by (a) average, (b) average of 4‐closest patches to average, (c) median, (d) sparse representation with spatial consistency and (e) sparse representation with spatio‐angular consistency. [Color figure can be viewed at http://wileyonlinelibrary.com]
Evaluation Based on Atlas‐Guided Image Normalization
An important criteria for a diffusion atlas would be maintaining the white matter integrity of normalized individuals as much as possible. Thus, in this section, we evaluate how well our proposed atlas align different structures in the atlas‐guided image normalization. In this evaluation, we have performed the atlas construction and the DW image normalization with their FA maps via three‐fold cross‐validation using the DW images of the 30 subjects. Specifically, we first build DW atlases using the DW images of 20 training subjects for each fold. Then, we normalize the DW images of 10 test subjects using their FA maps via affine registration, followed by diffeomorphic demons as described in section “Image Preprocessing.” In this experiment, we have compared the proposed method with the atlases, acquired by the simple averaging and the sparse representation with the spatial constraint only. The patch‐based fusion methods using the average of the K‐closest patches and the median of training patches have been excluded due to their worse results in terms of the detail representation, as demonstrated in section “Comparison with Different Patch‐Based Fusion Methods.”
In order to evaluate the normalization performance of the atlases within the brain regions, we employ the parcellation map of JHU‐neonate‐SS atlas provided in [Oishi et al., 2011]. The parcellation map consists of 122 regions of interest (ROIs) [Oishi et al., 2011]. Among them, ROIs of label 1–66 mostly correspond to cerebral white matter structures, deep gray matter structures, cerebellar structures and brainstem. The rest are mainly associated with cortical gray matter structures [Oishi et al., 2011]. Figure 10 shows the ROIs of label 1–66 and 67–122 separately on the DTI atlas. We determine the brain regions of the three atlases by mapping the parcellation map onto the atlases following the registration of the FA map of the DTI brain atlas to the FA maps of the atlases. Then, we compare the diffusion parameters, measured from the mean images of the normalized DW images of testing subjects, using Wilcoxon signed‐rank test. In the experiment, we use four diffusion parameters: fractional anisotropy (FA), axial diffusivity (AD), radial diffusivity (RD), and mean diffusivity (MD).
Figure 10.
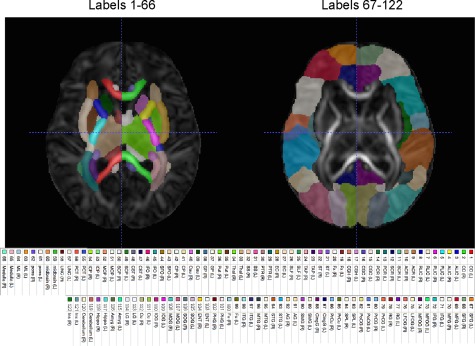
Parcellation map of the diffusion tensor atlas, provided in (Oishi et al., 2011). (Left) Regions of interest (ROIs) of label 1–66 mostly correspond to white matter and subcortical structures. (Right) ROIs of label 67–122 are mostly associated with cortical gray matter structures. [Color figure can be viewed at http://wileyonlinelibrary.com]
Table 2 shows the diffusion parameters, measured across entire ROIs of the average atlas, the spatially consistent atlas and the spatio‐angularly consistent atlas. The FA across the whole brain for the spatio‐angularly consistent atlas is significantly higher than both the spatially consistent atlas and the average atlas. The AD, RD, and MD for the spatio‐angularly consistent atlas are significantly lower than both the spatially consistent atlas and the average atlas. These results indicate that the average diffusion signals of the individual DW images, registered to the spatially consistent atlas and the average atlas, are more isotropic than those from the proposed atlas. These results also demonstrate that the brain structures are aligned more accurately, especially in white matter. Their anisotropic characteristics are not smoothed out even after averaging of the diffusion signals of the testing subjectsn DW images.
Table 2.
Statistical differences in diffusion parameters between the average atlas (average), the spatially consistent atlas (spatial) and the spatio‐angularly consistent atlas (spatio‐angular) across whole brain regions using 3‐fold cross validation
| Average | Spatial | Spatio‐angular | Wilcoxon signed‐ranks | |||
|---|---|---|---|---|---|---|
| (M) | (S) | (SA) | (SA‐M) | (SA‐S) | ||
| FA | CV1 | 0.099 ± 0.049 | 0.105 ± 0.053 | 0.116 ± 0.060 | 8.785, <0.001 | 8.282, <0.001 |
| CV2 | 0.100 ± 0.048 | 0.106 ± 0.053 | 0.118 ± 0.060 | 8.788, <0.001 | 7.273, <0.001 | |
| CV3 | 0.098 ± 0.047 | 0.105 ± 0.052 | 0.116 ± 0.059 | 8.471, <0.001 | 7.935, <0.001 | |
| AD | CV1 | 1.495 ± 0.151 | 1.487 ± 0.157 | 1.467 ± 0.164 | −3.525, <0.001 | −3.189, <0.001 |
| (×1,000) | CV2 | 1.479 ± 0.150 | 1.469 ± 0.153 | 1.452 ± 0.155 | −3.453, <0.001 | −3.250, <0.001 |
| CV3 | 1.437 ± 0.144 | 1.417 ± 0.142 | 1.411 ± 0.146 | −3.274, <0.001 | 1.332, 0.183 | |
| RD | CV1 | 1.286 ± 0.130 | 1.269 ± 0.130 | 1.229 ± 0.132 | −8.683, <0.001 | −8.880, <0.001 |
| (×1,000) | CV2 | 1.273 ± 0.141 | 1.253 ± 0.138 | 1.216 ± 0.136 | −8.578, <0.001 | −8.635, <0.001 |
| CV3 | 1.238 ± 0.128 | 1.209 ± 0.123 | 1.183 ± 0.120 | −8.185, <0.001 | −6.890, <0.001 | |
| MD | CV1 | 1.356 ± 0.128 | 1.341 ± 0.128 | 1.308 ± 0.129 | −7.371, <0.001 | −7.346, <0.001 |
| (×1,000) | CV2 | 1.342 ± 0.136 | 1.325 ± 0.134 | 1.294 ± 0.130 | −7.214, <0.001 | −7.296, <0.001 |
| CV3 | 1.304 ± 0.126 | 1.278 ± 0.120 | 1.259 ± 0.116 | −6.777, <0.001 | −5.256, <0.001 | |
FA, fractional anisotropy; AD, axial diffusity; RD, radial diffusity; MD, mean diffusivity.
Values in 6th and 7th columns: Z and P values of a Wilcoxon signed‐ranks test.
Significant values (P < 0.05) are highlighted in boldface.
More specifically, Figure 11 shows the comparison of the FA values of the mean images between the average atlas, the spatially consistent atlas and the spatio‐angularly consistent atlas. In the observation from the ROIs of label 1–66, the testing images are aligned better at the brain structures, such as cerebellar white matter structures and cerebellar structures using the spatio‐angularly consistent atlas than using other atlases. Especially, the proposed atlas considering spatio‐angular consistency shows better performance in the DW image normalization than others even for the brain structures having thin shapes, such as the anterior and posterior limb of internal capsule and the cingulum. This may be explained by the detailed representation of the white matter structures in the proposed atlas. There are few exceptions of lower FA for the proposed atlas at some regions, such as the putamen and the pontine crossing tract. Since the putamen generally has lower FA values than other surrounding structures as a deep gray matter structure [Bhagat and Beaulieu, 2004], the lower FA of the mean DW images for the proposed atlas at the putamen may reflect the better alignment of the individual images. The smaller volumes of the pontine crossing tract may yield more mis‐alignment of those regions than other brain structures [Oishi et al., 2011]. Table 3 provides the statistical analysis supporting our observation for the ROIs of label 1–66. The spatio‐angularly consistent atlas gives higher FA and lower RD and MD than the average atlas and the spatially consistent atlas in the mean DW image. However, there is no significant difference in AD between the atlases. This is due to the mis‐alignment of the diffusion signals between corresponding brain regions in the spatially consistent atlas and the average atlas. Considering the similar AD values for all atlases at the ROIs of label 1–66, the higher AD, RD, and MD values for the spatially consistent atlas and the average atlas at whole brain regions may be affected by larger variations of brain structures in the outer brain regions across subjects. For those regions of label 67–122, the FA values for the spatio‐angular consistent atlas are slightly higher than or comparable to the other atlases (see Fig. 11). Since we use the FA maps of the individual DW images for image alignment, the observed diffusion parameters across the ROIs of label 67–122, corresponding mostly to the outer regions of the brain, can be more affected by the individual variations in those regions than the ROIs of label 1–66. These results indicate that the proposed atlas with the spatio‐angular consistency provides better alignment for the white matter structures using the FA maps in the atlas‐guided DW image normalization.
Figure 11.
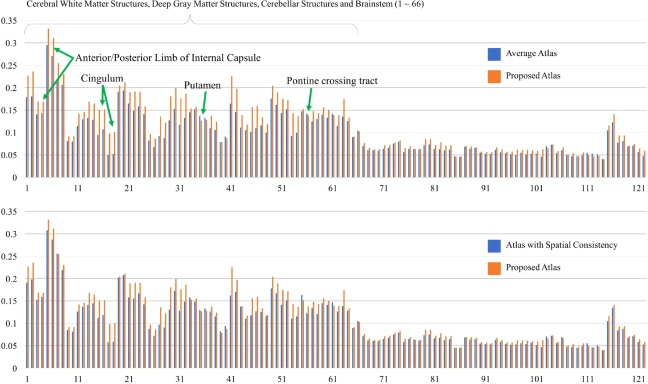
Comparison of average fractional anisotropy (FA) across all brain regions of interest between: the average atlas and the spatio‐angularly consistent atlas (Top); the spatially consistent atlas and the spatio‐angularly consistent atlas (Bottom). The data was obtained from the first fold of three‐fold cross‐validation. Please refer to Figure 10 for the names of the regions. [Color figure can be viewed at http://wileyonlinelibrary.com]
Table 3.
Statistical differences in diffusion parameters between the average atlas (average), the spatially consistent atlas (spatial) and the spatio‐angularly consistent atlas (spatio‐angular) at the regions of interest of label 1–66 using 3‐fold cross validation
| Average | Spatial | Spatio‐angular | Wilcoxon signed‐ranks | |||
|---|---|---|---|---|---|---|
| (M) | (S) | (SA) | (SA‐M) | (SA‐S) | ||
| FA | CV1 | 0.132 ± 0.044 | 0.140 ± 0.046 | 0.159 ± 0.049 | 6.807, <0.001 | 6.436, <0.001 |
| CV2 | 0.133 ± 0.041 | 0.142 ± 0.044 | 0.162 ± 0.049 | 6.877, <0.001 | 6.615, <0.001 | |
| CV3 | 0.131 ± 0.041 | 0.142 ± 0.044 | 0.158 ± 0.048 | 6.768, <0.001 | 6.174, <0.001 | |
| AD | CV1 | 1.522 ± 0.185 | 1.526 ± 0.198 | 1.511±0.208, | −0.233, 0.816 | −0.572, 0.568 |
| (×1,000) | CV2 | 1.504 ± 0.180 | 1.501 ± 0.185 | 1.495 ± 0.188 | 0.246, 0.806 | 0.093, 0.926 |
| CV3 | 1.464 ± 0.172 | 1.446 ± 0.173 | 1.454 ± 0.178 | 0.272, 0.786 | 1.760, 0.078 | |
| RD | CV1 | 1.247 ± 0.148 | 1.234 ± 0.160 | 1.186 ± 0.159 | −5.989, <0.001 | −6.372, <0.001 |
| (×1,000) | CV2 | 1.234 ± 0.160 | 1.213 ± 0.157 | 1.172 ± 0.155 | −5.644, <0.001 | −5.829, <0.001 |
| CV3 | 1.203 ± 0.145 | 1.169 ± 0.140 | 1.144 ± 0.139 | −5.363, <0.001 | −3.874, <0.001 | |
| MD | CV1 | 1.339 ± 0.154 | 1.331 ± 0.166 | 1.294 ± 0.168 | −4.347, <0.001 | −4.577, <0.001 |
| (×1,000) | CV2 | 1.324 ± 0.162 | 1.309 ± 0.161 | 1.280 ± 0.159 | −3.638, <0.001 | −3.734, <0.001 |
| CV3 | 1.290 ± 0.149 | 1.261 ± 0.145 | 1.247 ± 0.145 | −3.395, <0.01 | −1.524, 0.128 | |
FA, fractional anisotropy; AD, axial diffusity; RD, radial diffusity; MD, mean diffusivity.
Values in 6th and 7th columns: Z and P values of a Wilcoxon signed‐ranks test.
Significant values (P < 0.05) are highlighted in boldface.
Evaluation of the Neonatal DW Atlas Using Diffusion Tensor Imaging and Tractography
In this section, we evaluate the quality of the neonatal DW atlas obtained from 29 subjects. Due to the large number of subjects, we use λ as 1.5 to build the DW atlas. The patch size is determined as 4 in consideration of the computation time. We have performed DTI and tractography using the TractVis (Version 0.6.3, trackvis.org) software. The Fiber Assignment by Continuous Tracking (FACT) method [Mori et al., 1999] is employed with the following parameters: seed FA threshold = 0.1 and maximum turning angle = 40°. From whole brain fiber tracts, we extract five major bundles, including forceps minor, forceps major, fornix, uncinate fasciculus and inferior fronto‐occipital fasciculus, via a multiple‐region‐of‐interest approach [Catani et al., 2002; Wakana et al., 2004].
Figure 12 shows the FA maps of the average, spatially consistent and spatio‐angularly consistent atlases. In the average atlas, the white matter structures have low contrast and unclear boundaries. These results indicate that the average atlas contains more isotropic signals on the white matter by simply averaging the diffusion signals of different orientation of the individual subjects. In the spatially consistent atlas, the white matter structures have more detailed representation in the entire brain. However, the FA of the spatially consistent atlas has similar magnitude to the average atlas. Without consideration of the angular neighbors, sparse representation selects angularly uncorrelated patches from the codebooks, introducing noise that weakens the signals in the white matter. Compared with the other atlases, there are more details in the white matter with higher FA values in the spatio‐angularly consistent atlas.
Figure 12.
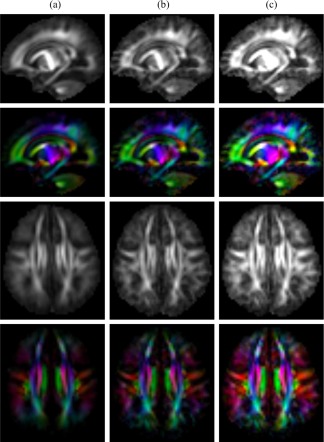
Fractional anisotropy (FA) maps of (a) average atlas, (b) spatially consistent atlas, and (c) spatio‐angularly consistent atlas. [Color figure can be viewed at http://wileyonlinelibrary.com]
The effectiveness of our method is also supported by the tractography on the major fiber bundles. Figure 13 shows the tractography of the fiber bundles with their FA values. Table 4 shows the diffusion parameters on the fiber bundles of each atlas. According to the diffusion parameters, the average atlas has more isotropic diffusion signals on the fiber tracts (lower FA and higher AD, RD, and MD) than the spatio‐angularly consistent atlas. With the spatio‐angular consistency, the fiber orientation is more consistent along the fiber bundles and more details of the fiber bundles can be observed (see (b) in Figure 13).
Figure 13.
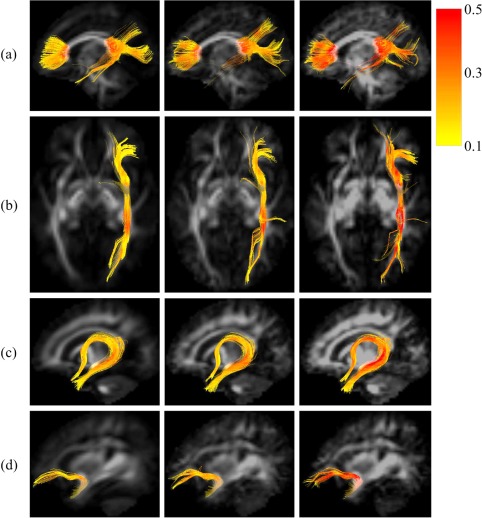
Tractography of (a) corpus callosum (Fminor, Fmajor), (b) inferior fronto‐occipital fasciculus, (c) fornix and (d) uncinate fasciculus on the average atlas (left), spatially consistent atlas (middle), and spatio‐angularly consistent atlas (right). The colors indicate the value of fractional anisotropy (FA) along the tracts. Darker color shows higher value for FA. [Color figure can be viewed at http://wileyonlinelibrary.com]
Table 4.
Diffusion parameters of the average atlas (M), the spatially consistent atlas (S) and the spatio‐angularly consistent atlas (SA) on the fiber bundles
| Fiber bundle | Atlas | FA | AD (×1,000) | RD (×1,000) | MD (×1,000) | ||||
|---|---|---|---|---|---|---|---|---|---|
| Forceps minor | M | 0.273 ± 0.116 |
|
1.160 ± 0.159 | 1.376 ± 0.121 | ||||
| S | 0.289 ± 0.104 | 1.703 ± 0.232 | 1.064 ± 0.140 | 1.277 ± 0.122 | |||||
| SA |
|
|
|
|
|||||
| Forceps major | M | 0.286 ± 0.108 |
|
1.201 ± 0.249 | 1.437 ± 0.245 | ||||
| S | 0.295 ± 0.097 | 1.818 ± 0.348 | 1.123 ± 0.208 | 1.354 ± 0.226 | |||||
| SA |
|
|
|
|
|||||
| Fornix | M | 0.222 ± 0.066 |
|
1.310 ± 0.286 | 1.493 ± 0.298 | ||||
| S | 0.226 ± 0.068 | 1.834 ± 0.379 | 1.291 ± 0.308 | 1.472 ± 0.322 | |||||
| SA |
|
|
|
|
|||||
| Uncinate fasciculus | M | 0.205 ± 0.055 |
|
1.137 ± 0.114 | 1.282 ± 0.095 | ||||
| S | 0.227 ± 0.057 | 1.486 ± 0.093 | 1.037 ± 0.100 | 1.187 ± 0.083 | |||||
| SA |
|
|
|
|
|||||
| Inferior fronto‐occipital fasciculus | M | 0.223 ± 0.065 |
|
1.297 ± 0.118 | 1.142 ± 0.132 | ||||
| S | 0.237 ± 0.072 | 1.488 ± 0.131 | 1.030 ± 0.109 | 1.183 ± 0.092 | |||||
| SA |
|
|
|
|
CONCLUSION
In this article, we have proposed a novel method for DW atlas construction that ensures consistency in both spatial and angular dimensions. Our approach constructs each patch of the atlas by jointly representing reference patches obtained from spatio‐angular neighboring patches. Each reference patch is determined by mode of the distribution of aligned patches using mean shift algorithm which is not sensitive to outliers. Experimental results based on diffusion tensor imaging confirm that, using our proposed method of considering spatio‐angular consistency, the constructed atlas preserves richer structural details compared with the average atlas and the spatially consistent atlas. Also considering spatio‐angular consistency, the fiber orientations were more consistent along the fiber bundles, showing more anisotropic behavior. Moreover, the proposed atlas, when used as normalization template, better aligns brain structures, especially in the white matter region, than atlases constructed without angular consistency.
B. Saghafi and J. Kim contributed equally to this work.
REFERENCES
- Bhagat YA, Beaulieu C (2004): Diffusion anisotropy in subcortical white matter and cortical gray matter: Changes with aging and the role of csf‐suppression. J Magn Reson Imaging 20:216–227. [DOI] [PubMed] [Google Scholar]
- Catani M, Howard RJ, Pajevic S, Jones DK (2002): Virtual in vivo interactive dissection of white matter fasciculi in the human brain. NeuroImage 17:77–94. [DOI] [PubMed] [Google Scholar]
- Chen G, Zhang P, Li K, Wee C‐Y, Wu Y, Shen D, Yap P‐T (2016): Angular resolution enhancement of diffusion mri data using inter‐subject information transfer In: Computational Diffusion MRI. Springer; pp. 145–157. [DOI] [PMC free article] [PubMed] [Google Scholar]
- Chilla GS, Tan CH, Xu C, Poh CL (2015): Diffusion weighted magnetic resonance imaging and its recent trend: A survey. Quant Imaging Med Surg 5:407. [DOI] [PMC free article] [PubMed] [Google Scholar]
- Comaniciu D, Ramesh V, Meer P (2001): The variable bandwidth mean shift and data‐driven scale selection. In: Computer Vision, 2001. ICCV 2001. Proceedings of the Eighth IEEE International Conference on. Vol. 1. IEEE. pp. 438–445.
- Descoteaux M, Angelino E, Fitzgibbons S, Deriche R (2006): Apparent diffusion coefficients from high angular resolution diffusion imaging: Estimation and applications. Magn Reson Med 56:395–410. [DOI] [PubMed] [Google Scholar]
- Deshpande R, Chang L, Oishi K (2015): Construction and application of human neonatal dti atlases. Front Neuroanat 9:138. [DOI] [PMC free article] [PubMed] [Google Scholar]
- Evans AC, Janke AL, Collins DL, Baillet S (2012): Brain templates and atlases. Neuroimage 62:911–922. [DOI] [PubMed] [Google Scholar]
- Hua K, Zhang J, Wakana S, Jiang H, Li X, Reich DS, Calabresi PA, Pekar JJ, van Zijl PC, Mori S (2008): Tract probability maps in stereotaxic spaces: Analyses of white matter anatomy and tract‐specific quantification. Neuroimage 39:336–347. [DOI] [PMC free article] [PubMed] [Google Scholar]
- Huang H, Zhang J, Wakana S, Zhang W, Ren T, Richards LJ, Yarowsky P, Donohue P, Graham E, Van Zijl PC, Mori S (2006): White and gray matter development in human fetal, newborn and pediatric brains. Neuroimage 33:27–38. [DOI] [PubMed] [Google Scholar]
- Jenkinson M, Beckmann CF, Behrens TE, Woolrich MW, Smith SM (2012): Fsl. Neuroimage 62:782–790. [DOI] [PubMed] [Google Scholar]
- Jia H, Wu G, Wang Q, Shen D (2010): Absorb: Atlas building by self‐organized registration and bundling. NeuroImage 51:1057–1070. [DOI] [PMC free article] [PubMed] [Google Scholar]
- Jia H, Yap PT, Shen D (2012): Iterative multi‐atlas‐based multi‐image segmentation with tree‐based registration. Neuroimage 59:422–430. [DOI] [PMC free article] [PubMed] [Google Scholar]
- Johansen‐Berg H, Behrens TEJ (2013): Diffusion MRI: From Quantitative Measurement to In Vivo Neuroanatomy. London: Academic Press; 632 p. [Google Scholar]
- Joshi S, Davis B, Jomier M, Gerig G (2004): Unbiased diffeomorphic atlas construction for computational anatomy. NeuroImage 23:S151–S160. [DOI] [PubMed] [Google Scholar]
- Liu J, Ji S, Ye J (2009): Multi‐task feature learning via efficient l 2, 1‐norm minimization. In: Proceedings of the twenty‐fifth conference on uncertainty in artificial intelligence. Virginia: AUAI Press. pp. 339–348.
- Mori S, Crain BJ, Chacko V, Van Zijl PC (1999): Three‐dimensional tracking of axonal projections in the brain by magnetic resonance imaging. Ann Neurol 45:265–269. [DOI] [PubMed] [Google Scholar]
- Mori S, Wakana S, Nagae‐Poetscher L, Van Zijl PC (2005): MRI atlas of human white matter. Amsterdam: Elsevier; 284 p. [DOI] [PubMed] [Google Scholar]
- Oishi K, Mori S, Donohue PK, Ernst T, Anderson L, Buchthal S, Faria A, Jiang H, Li X, Miller MI, Van Zijl PC, Chang L (2011): Multi‐contrast human neonatal brain atlas: Application to normal neonate development analysis. Neuroimage 56:8–20. [DOI] [PMC free article] [PubMed] [Google Scholar]
- Saghafi B, Chen G, Shi F, Yap P, Shen D (2016): Construction of neonatal diffusion atlases via spatio‐angular consistency. In: MICCAI Workshop on Patch‐based Techniques in Medical Imaging (Patch‐MI). pp. 9–16. [DOI] [PMC free article] [PubMed]
- Schwarz CG, Reid RI, Gunter JL, Senjem ML, Przybelski SA, Zuk SM, Whitwell JL, Vemuri P, Josephs KA, Kantarci K, Thompson PM, Petersen RC, Jack CR Jr (2014): Improved dti registration allows voxel‐based analysis that outperforms tract‐based spatial statistics. Neuroimage 94:65–78. [DOI] [PMC free article] [PubMed] [Google Scholar]
- Shen D, Wong W‐h, Ip HH (1999): Affine‐invariant image retrieval by correspondence matching of shapes. Image Vis Comput 17:489–499. [Google Scholar]
- Shi F, Wang L, Dai Y, Gilmore JH, Lin W, Shen D (2012): Label: pediatric brain extraction using learning‐based meta‐algorithm. Neuroimage 62:1975–1986. [DOI] [PMC free article] [PubMed] [Google Scholar]
- Shi F, Wang L, Wu G, Li G, Gilmore JH, Lin W, Shen D (2014): Neonatal atlas construction using sparse representation. Hum Brain Mapp 35:4663–4677. [DOI] [PMC free article] [PubMed] [Google Scholar]
- Smith SM (2002): Fast robust automated brain extraction. Hum Brain Mapp 17:143–155. [DOI] [PMC free article] [PubMed] [Google Scholar]
- Tang S, Fan Y, Wu G, Kim M, Shen D (2009): Rabbit: Rapid alignment of brains by building intermediate templates. NeuroImage 47:1277–1287. [DOI] [PMC free article] [PubMed] [Google Scholar]
- Tibshirani R (1996) Regression shrinkage and selection via the lasso. J R Stat Soc Ser B 58:267–288. [Google Scholar]
- Vercauteren T, Pennec X, Perchant A, Ayache N (2009): Diffeomorphic demons: Efficient non‐parametric image registration. NeuroImage 45:S61–S72. [DOI] [PubMed] [Google Scholar]
- Verma R, Mori S, Shen D, Yarowsky P, Zhang J, Davatzikos C (2005): Spa‐tiotemporal maturation patterns of murine brain quantified by diffusion tensor MRI and deformation‐based morphometry. Proc Natl Acad Sci U S A 102:6978–6983. [DOI] [PMC free article] [PubMed] [Google Scholar]
- Vogel CR, Oman ME (1998): Fast, robust total variation‐based reconstruction of noisy, blurred images. IEEE Trans Image Process 7:813–824. [DOI] [PubMed] [Google Scholar]
- Wakana S, Jiang H, Nagae‐Poetscher LM, Van Zijl PC, Mori S (2004): Fiber tractcherp://www.ncbi.nlm.nih.gov/pubmed/182762. Radiology 230:77–87. [DOI] [PubMed] [Google Scholar]
- Wang L, Shi F, Lin W, Gilmore JH, Shen D (2011): Automatic segmentation of neonatal images using convex optimization and coupled level sets. Neuroimage 58:805–817. [DOI] [PMC free article] [PubMed] [Google Scholar]
- Wang L, Shi F, Li G, Gao Y, Lin W, Gilmore JH, Shen D (2014): Segmentation of neonatal brain MR images using patch‐driven level sets. Neuroimage 84:141–158. [DOI] [PMC free article] [PubMed] [Google Scholar]
- Xue Z, Shen D, Davatzikos C (2006a): Statistical representation of high‐dimensional deformation fields with application to statistically constrained 3d warping. Med Image Anal 10:740–751. [DOI] [PubMed] [Google Scholar]
- Xue Z, Shen D, Karacali B, Stern J, Rottenberg D, Davatzikos C (2006b): Simulating deformations of mr brain images for validation of atlas‐based segmentation and registration algorithms. Neuroimage 33:855–866. [DOI] [PMC free article] [PubMed] [Google Scholar]
- Yang J, Shen D, Davatzikos C, Verma R (2008): Diffusion tensor image registration using tensor geometry and orientation features. In: Medical Image Computing and Computer‐Assisted Interventionisted00 2008. Springer. pp. 905–913. [DOI] [PubMed]
- Yap P‐T, Wu G, Zhu H, Lin W, Shen D (2009): Timer: Tensor image morphing for elastic registration. NeuroImage 47:549–563. [DOI] [PMC free article] [PubMed] [Google Scholar]
- Yap PT, Zhang Y, Shen D (2016): Multi‐tissue decomposition of diffusion mri signals via l 0 sparse‐group estimation. IEEE Trans Image Process 25:4340–4353. [DOI] [PMC free article] [PubMed] [Google Scholar]
- Zacharaki EI, Shen D, Lee S‐K, Davatzikos C (2008): Orbit: A multiresolution framework for deformable registration of brain tumor images. IEEE Trans Med Imaging 27:1003–1017. [DOI] [PMC free article] [PubMed] [Google Scholar]
- Zhang W, Li R, Deng H, Wang L, Lin W, Ji S, Shen D (2015): Deep convolutional neural networks for multi‐modality isointense infant brain image segmentation. Neuroimage 108:214–224. [DOI] [PMC free article] [PubMed] [Google Scholar]
- Zhang Y, Shi F, Yap P‐T, Shen D (2016): Detail‐preserving construction of neonatal brain atlases in space‐frequency domain. Hum Brain Mapp 37:2133–2150. [DOI] [PMC free article] [PubMed] [Google Scholar]


