

Abstract
Aims
Adherence to medicines is vital in treating diseases. Initial medication non‐adherence (IMNA) – defined as not obtaining a medication the first time it is prescribed – has been poorly explored. Previous studies show IMNA rates between 6 and 28% in primary care (PC). The aims of this study were to determine prevalence and predictive factors of IMNA in the most prescribed and expensive pharmacotherapeutic groups in the Catalan health system.
Methods
This is a retrospective, register‐based cohort study which linked the Catalan PC System (Spain) prescription and invoicing databases. Medication was considered non‐initiated when it was not collected from the pharmacy by the end of the month following the one in which it was prescribed. IMNA prevalence was calculated using July 2013–June 2014 prescription data. Predictive factors related to patients, general practitioners and PC centres were identified through multilevel logistic regression analyses. Missing data were attributed using simple imputation.
Results
Some 1.6 million patients with 2.9 million prescriptions were included in the study sample. Total IMNA prevalence was 17.6% of prescriptions. The highest IMNA rate was observed in anilides (22.6%) and the lowest in angiotensin‐converting‐enzyme (ACE) inhibitors (7.4%). Predictors of IMNA are younger age, American nationality, having a pain‐related or mental disorder and being treated by a substitute/resident general practitioner in a resident‐training centre.
Conclusions
The rate of IMNA is high when all medications are taken into account. Attempts to strengthen trust in resident general practitioners and improve motivation to initiate a needed medication in the general young and older immigrant population should be addressed in Catalan PC.
Keywords: adherence, big data, clinical pharmacology, pharmacoepidemiology, primary care
What is Already Known about this Subject
The prevalence of initial medication non‐adherence (IMNA) oscillates between 6 and 28%.
IMNA varies depending on the population, medicines and country, along with gender, age and some specific diseases associated with it.
IMNA rates oscillate in some pharmacological groups and predictive factors in PC.
What this Study Adds
Prevalence of IMNA was 17%, ranging from 8% (ACE inhibitors) to 23% (anilides).
Nationality and patient diseases were strong predictors of IMNA; clinically relevant interactions existed between nationality and age, disability and mental disorders.
Prescriptions issued in a teaching centre and/or by a substitute/resident GP increased the odds of IMNA.
Introduction
Although adherence to medicines is vital in achieving clinical goals and treating diseases 1, 2, research clearly shows high rates of non‐adherence 3, 4. Consequences of non‐adherence may vary from worsening health status to an increase in health service usage 1, 5, 6. However, most studies have focused on post‐initiation medication non‐adherence (skipping doses, taking lower or higher doses, or discontinuing treatment) and little attention has been paid to initial medication non‐adherence (IMNA) 7, 8. IMNA is defined as not obtaining a medication the first time it is prescribed 9. IMNA is defined by a preperiod (the minimum time to consider a prescription event as new) and a follow‐up period (the length of time to a dispensing event once a prescription has been made out) 9. Primary non‐adherence has been used as a synonymous term for IMNA as it describes the situation where medication is not dispensed at the pharmacy. However, some authors use the description primary non‐adherence regardless of whether it is the first prescription or not, thus including post‐IMNA 2, 10. For the purposes of this study, IMNA is the most accurate term. The first studies reporting IMNA rates were published in the second half of the 2000s 11, 12. The very few papers that specifically addressed the problem of IMNA suggest that prevalence rates oscillate between 4% and 40% in specific populations or specialized care 13, 14 and between 6% and 28% in the general population in primary care 7, 10, 15, 16, 17. IMNA rates vary depending on the medication under consideration, the duration of the preperiod and follow‐up period, and where the study is performed 9.
Identifying the medicines with higher IMNA prevalence is important for designing strategies to deal with this issue. The varying preperiod and follow‐up period within studies, together with the fact that most studies focused only on specific medication, limit our capacity to identify the most problematic pharmacological groups. To our knowledge, the first study to compare different groups was carried out in Denmark. It involved all the anatomic groups and 15 pharmacotherapeutic groups over a 4‐month follow‐up period. The highest IMNA rates in anatomic groups were found in drugs from the blood and blood‐forming organs and genitourinary system groups, with 16.9% and 12.3% two‐year IMNA prevalence, respectively. The pharmacotherapeutic subgroup with the highest IMNA rate was nonsteroidal anti‐inflammatory drugs 7.
Adherence is complex health‐related behaviour that is affected not only by patient profile but also by interpersonal and institutional factors 1. IMNA predictive factors include being female, younger age, taking more than three medicines and having a low income 7, 15. However, there are no studies exploring the impact of the General Practitioner (GP) or Primary Care Centre (PCC) characteristics on IMNA.
Since the patient is never in contact with the prescribed medication, IMNA is a completely specific form of non‐adherence which affects the entire health system. Having a detailed view of the pharmacological subgroups where this behaviour is more prevalent and the factors that predict IMNA is necessary to minimize this phenomenon. As far as we know, in Spain, this information has still not been studied in a large population in detail because of the challenge of linking prescription and dispensing databases. The recent connection of prescription and invoicing (i.e., dispensing) databases offers a unique opportunity for health care systems to explore this issue.
The aims of this study were: (i) to calculate IMNA prevalence for the most prescribed and expensive pharmacotherapeutic groups within the Catalan health system; (ii) to determine IMNA predictive factors with respect to prescription, GP and PCC; and (iii) to evaluate how variations in the definition of the IMNA follow‐up period affect IMNA rates.
Methods
We followed the STROBE statement for the reporting of observational studies in epidemiology 18. This was a retrospective, register‐based cohort study of primary care patients being prescribed a new medication in Catalonia (Spain) between July 2013 and June 2014. Data were obtained from the public Primary Healthcare System database in Catalonia (Institut Català de la Salut‐ICS): System for the Development of Research in Primary Care (SIDIAP) 19. The study obtained approval from the Idiap‐JordiGol i Gurina Ethics Committee (P14/140) and the Fundació Sant Joan de Déu Ethics Committee (PIC‐111‐14).
Setting
The Spanish public healthcare system provides universal coverage for citizens and foreign nationals. It is funded through taxes and free of charge at the moment of use. With regard to prescribed medication, patients only pay a proportion of the total price of the medication as determined by their employment (pensioner or active) and socioeconomic status. To obtain reimbursement for the dispensed medication, the pharmacies send monthly registries of the medication dispensed to the healthcare authorities. It is a decentralized system, where each of the 17 Spanish Autonomous Communities controls health planning, public health and the management of health services 20. In Catalonia, a region of over 7.5 million inhabitants, there are 371 publicly funded PCCs. A total of 294 are managed by the ICS and these cover 80% of the Catalan population (5.8 million) 21. Primary care is the first point of contact with the system. Each individual has an assigned GP who issues all the prescriptions except when he/she is on leave or the consultation is done by a substitute or resident GP.
SIDIAP database
The SIDIAP database was implemented in 2010 and includes all the information on primary care patients covered by the ICS 21: patients’ sociodemographic and clinical data, prescribed and dispensed medication, prescriber, sociodemographic characteristics of the prescriber, PCC and PCC characteristics.
Regarding prescriptions, the SIDIAP database registers prescribed medication dispensed at pharmacies. Public sources also register the total cost of the medication, the invoiced amount and the month the pharmacies invoice the ICS.
The SIDIAP database is managed by public healthcare authorities. It is anonymous, encoded and secure, and meets all current legal requirements.
Sample
This study includes patients (>14 years old) that were newly prescribed a medication included in the list of the 10 most prescribed pharmacotherapeutic subgroups or in the seven most costly in 2014 for the ICS (Table 1). To be considered an initial prescribing event, the length of preperiod required, free of prescriptions from the same pharmacotherapeutic subgroups, was 2 months. A specific rule was stated for the penicillin with extended spectrum subgroup where a preperiod of 1 month was used. There were two exceptions in pharmacotherapeutic subgroup inclusion: (1) combinations of penicillin (including beta‐lactamase inhibitors) were excluded because of similarities between this subgroup and the penicillin with extended spectrum subgroup; and (2) the other antidepressants subgroup was excluded because it is mainly prescribed by specialists. Both were among the seven most expensive subgroups.
Table 1.
Number of prescriptions per pharmacological subgroup, IMNA rates 1, 2 and 3 months after prescription month and proportion of single prescription filled
| Number of prescriptions (%) | IMNA rates (%) | IMNA rates (%) | IMNA rates (%) | ||
|---|---|---|---|---|---|
| Pharmacological Subgroup (ATC code) | One month after prescription month | Two months after prescription month | Three months after prescription month | Single prescription filleda (%) | |
| All groups | 2857 948 (100) | 17.62 | 16.66 | 16.05 | 53.64 |
| Proton pump inhibitors (A02BC) bc | 314 339 (11.00) | 18.37 | 17.25 | 16.58 | 47.56 |
| Insulins and analogues for injection, long acting (A10AE) c | 8270 (0.29) | 13.17 | 9.47 | 7.78 | 13.17 |
| Platelet aggregation inhibitors excl. heparin (B01AC) b | 34 139 (1.19) | 11.78 | 9.92 | 9.11 | 23.02 |
| ACE inhibitors, plain (C09AA) b | 74 346 (2.60) | 7.46 | 6.18 | 5.66 | 17.91 |
| HMG CoA reductase inhibitors (C10AA) b,c | 69 602 (2.44) | 8.80 | 7.37 | 6.74 | 10.04 |
| Penicillin with extended spectrum (J01CA) b | 358 567 (12.55) | 9.81 | 9.47 | 9.22 | 76.88 |
| Propionic acid derivatives (M01AE) b | 813 525 (28.47) | 21.22 | 20.38 | 19.74 | 60.00 |
| Anilides (N02BE) b | 635 301 (22.23) | 22.61 | 21.20 | 20.73 | 52.96 |
| Other antiepileptics (N03AX) c | 55 728 (1.95) | 11.54 | 10.30 | 9.78 | 40.84 |
| Benzodiazepine derivatives (N05BA) b | 285 018 (9.97) | 16.75 | 15.82 | 15.32 | 51.56 |
| Selective serotonin reuptake inhibitors (N06AB) b | 97 635 (3.42) | 11.51 | 10.12 | 9.55 | 26.94 |
| Adrenergics in combination with corticosteroids or other drugs, excl. anticholinergics (R03AK) c | 37 840 (1.32) | 13.99 | 12.03 | 10.74 | 47.52 |
| Anticholinergics (R03BB) c | 73 638 (2.58) | 9.37 | 8.51 | 8.06 | 58.79 |
Only prescriptions filled the month they were prescribed or the following month
Most prescribed pharmacological subgroup
Most expensive pharmacological subgroups
Outcome
Prescriptions are registered at the moment they are written up while dispensing is registered monthly (when the pharmacies send the invoices to the ICS at the end of the month). Consequently, if a medication is prescribed during the final days of any given month and dispensed the following month, it will be registered as dispensed during the month following prescription.
IMNA was defined as not having collected the prescribed medicine from a pharmacy either in the month it was prescribed or the following month (follow‐up period).
Potential IMNA predictors at the prescription/patient level were: gender, age (at the time of the prescription), nationality [grouped into Spain, Europe (not including Spain), Africa, Americas and Asia‐Oceania], socioeconomic status (five categories, from low to high for urban areas, and a rural category), and active diseases and comorbidities (number of active diseases) at the moment of prescription. Diseases are recorded in the International Statistical Classification of Diseases and Related Health Problems (ICD‐10). The most prevalent groups of pathologies were selected in this study and clustered as follows: allergy; pain (including arthritis, arthrosis, rheumatological diseases and back pain); respiratory (including asthma and COPD); disability (including blindness, urinary incontinency and hypoacusia); cardiovascular (cardiovascular diseases, arterial hypertension, dyslipidemia and dependency on alcohol or tobacco, although they are not cardiovascular conditions, are included as cardiovascular risk factors); mental (depression, schizophrenia, and neurotic, stress and somatic symptom disorders); neurological (neuropathy, epilepsy and migraine); diabetes mellitus (DM1 and DM2); digestive (cirrhosis, chronic constipation, hernia hiatus, peptic ulcer, dyspepsia and gastroesophageal reflux disease); and thyroid‐related diseases.
Potential IMNA predictors at the GP level were gender, age and GP type (assigned or substitute/resident). Substitute GPs are fully trained GPs who cover for the assigned GP when he or she is on leave and resident GPs are GPs in a training period. At the PCC level, the type of centre (resident‐training centre or not) was also registered.
According to the literature, adherence to medicines is related to patient (sociodemographic and clinical), GP and PCC factors 1. Consequently, this study includes those factors potentially related to non‐adherence included in the SIDIAP database.
Analysis
Prevalence of overall IMNA and by pharmacological group was calculated as the proportion of non‐filled prescriptions in the month they were issued or the following month. Sensitivity analysis regarding the definition of IMNA was done in two ways. First, the IMNA follow‐up period was increased to 2 and 3 months following the prescription month. Second, as a patient may fill the prescription but not initiate the medication, we estimated the proportion, in a worst case scenario, of patients who filled only one prescription in the month it was prescribed or the following month and never filled it again; they may have filled a prescription but not taken the medication.
Four variables had missing values: nationality (40%), socioeconomic status (10%), GP gender (10%) and age (10%). We generated one imputed database using multivariate imputation with chained equations using all the available variables in the model. To assess the reliability of the imputation model, we randomly eliminated the same proportion of missing values from the database without missing data (n = 1319 224) and ran the imputation model. Subsequently, imputed values were compared to the original values. Erroneous imputation values were around 5% in all four variables. GP age was missing only for those GPs that were substitutes and/or resident GPs who were younger than the sample of GPs registered in the database. Thus, age of the GPs was assumed to be 32.5 years, which corresponds to the mean age of substitutes and residents 22.
To assess the patient, GP and PCC variables that predict IMNA, we used multilevel logistic regression with three levels: prescription, GP and PCC. The intraclass correlation coefficients (ICC) for GP and PCC were 0.023 [95% confidence interval (CI): 0.022; 0.024] and 0.011 (95% CI: 0.009; 0.013), respectively. Parameters of the multilevel models were estimated using the second order Taylor approximation and penalized quasi‐likelihood method 23. First, we tested all variables in bivariate multilevel logistic regression models to determine odds ratios (OR) of potential IMNA predictive factors. To select the relevant variables, we used criteria of statistical significance and effect size. Categorical variables with a P‐value < 0.05 and an OR lower than 0.9 or higher than 1.1, and continuous variables with a P‐value < 0.05 and an OR lower than 0.99 or higher than 1.01, were included in the multivariate multilevel logistic regression model.
We only explored interactions that met previously explained criteria, i.e., those that were able to invert the OR of any of their isolated terms and the interaction between assigned GP and resident‐training PCC because we considered it a high‐quality indicator of the training process. Thus, we included the following interactions in the models: PCC type and GP type; nationality and disability, nationality and mental disorder; nationality and patient age; disability and cardiovascular disease; cardiovascular disease and mental disorder; cardiovascular disease and respiratory disease; DM and digestive disorder; DM and thyroid gland‐related disorder.
Descriptive analyses were performed with Stata MP13.0 while multilevel analyses were performed with the combination of Stata MP13.0 and MlwiN v.2.33 through the runmlwin command developed by Leckie and Charlton 23.
Results
Sociodemographic characteristics
A total of 1599 286 patients met the study inclusion criteria. This population was newly prescribed the 2857 948 medications included in the study. There were 6953 GPs from 294 PCCs. Table 2 details the characteristics of patients, GPs and PCCs.
Table 2.
Characteristics of the sample: stratified at prescription, patient, general practitioner and primary care centre level
| Patient level | n = 1599 286 | % |
|---|---|---|
| Gender (female) | 925 824 | 57.89 |
| Age a (mean ± SD) | 52.40 ± 19.42 | |
| Area socioeconomic status | ||
| Urban 1 | 220 346 | 13.78 |
| Urban 2 | 254 482 | 15.91 |
| Urban 3 | 268 714 | 16.80 |
| Urban 4 | 280 018 | 17.51 |
| Urban 5 | 280 268 | 17.52 |
| Rural | 295 458 | 18.47 |
| Nationality | ||
| Spaniard | 1271 812 | 79.52 |
| American b | 129 556 | 8.10 |
| Asian/Oceanian | 35 365 | 2.21 |
| Other European | 56 637 | 3.54 |
| African | 105 916 | 6.62 |
| Prescription level | n = 2857 948 | % |
|---|---|---|
| Active diseases c | ||
| Allergy | 93 216 | 3.26 |
| Pain | 1 362 423 | 47.67 |
| Back pain | 967 534 | 33.85 |
| Arthrosis | 454 917 | 15.92 |
| Rheumatologic disease | 308 644 | 10.80 |
| Respiratory disease | 299 407 | 10.48 |
| Disability | 596 308 | 20.86 |
| Blindness | 353 698 | 12.38 |
| Cardiovascular | 1583 872 | 55.42 |
| Arterial hypertension | 849 242 | 29.72 |
| Dyslipidemia | 566 309 | 19.82 |
| Dependency to substances | 732 328 | 25.62 |
| Mental disorder | 885 806 | 30.99 |
| Mood disorders | 501 844 | 17.56 |
| Other mental disorders d | 503 916 | 17.63 |
| Neurological | 329 015 | 11.51 |
| Diabetes mellitus | 312 537 | 10.94 |
| Diabetes mellitus 2 | 302 383 | 10.58 |
| Digestive system disorder | 495 810 | 17.35 |
| Thyroid gland related disease | 218 444 | 7.64 |
| Number of comorbidities; grouped e (mean ± SD) | 2.16 ± 1.51 |
| General Practitioner level | n = 6953 | % |
|---|---|---|
| Gender (female) | 3319 | 65.16 |
| Age (mean ± SD) | 47.54 ± 10.13 | |
| Assigned GPs | 5093 | 73.25 |
| Substitute/Resident | 1860 | 26.75 |
| Primary Care Centre level | n = 294 | % |
|---|---|---|
| Training Centre | 72 | 24.49 |
Age of the patient in years when first prescription in the study period was made
American refers to the Americas (North, Central and South America)
Subcategories of active diseases are only shown when prevalence is higher than 10%
Other mental disorders include schizophrenia, schizotypal, delirious, neurotic, stress‐related and somatic symptom disorders
Sum of group of pathologies
Prevalence of IMNA
IMNA rates and results from the bivariate analysis are presented in Table 1. Overall, the prevalence of IMNA in the month following prescription was 17.62%. The highest prevalence of IMNA was observed in the anilides group (22.61%) and the lowest in the ACE inhibitors group (7.46%).
The prevalence of IMNA 2 and 3 months following prescription was 16.66% and 16.05%, respectively. Overall, 53.64% of prescriptions were filled before the end of the month following the prescription month and never filled again.
Predictors of IMNA
Univariate analysis
Table 3 shows IMNA predictors based on the bivariate logistic multilevel models. Female and older patients were more likely to initiate treatment. Having a nationality other than Spanish or African was a strong predictor of IMNA. In comparison to not having a particular disease, patients with this active disease, with the exception of allergy, were more likely to initiate medication. Among all nationalities, diabetes mellitus was a strong predictor of initial medication adherence. The odds of IMNA decreased when the number of active diseases increased. When GPs were younger and/or female, IMNA was more likely. The odds of IMNA increased when the prescription was issued by a substitute or a resident GP or at a resident‐training PCC.
Table 3.
IMNA rates and odds ratio for variables at the patient, General Practitioner and Primary Care Centre: multilevel bivariate logistic regression analysis
| Variable | Proportion of IMNA (%) | Odds ratio | 95% confidence interval |
|---|---|---|---|
| Patient characteristics | |||
| Gender | |||
| Male | 17.84 | Ref | |
| Female | 17.47 | 0.98 | 0.97, 0.98 |
| Age a (continuous) | 0.97 | 0.97, 0.97 | |
| Socioeconomic status | |||
| Urban 1 | 18.17 | Ref | Ref |
| Urban 2 | 18.16 | 0.99 | 0.98, 1.00 |
| Urban 3 | 17.83 | 0.98 | 0.96, 0.99 |
| Urban 4 | 17.80 | 0.97 | 0.96, 0.99 |
| Urban 5 | 18.58 | 0.99 | 0.98, 1.00 |
| Rural | 15.37 | 0.95 | 0.93, 0.96 |
| Nationality | |||
| Spaniard | 16.56 | Ref | |
| American b | 26.39 | 1.77 | 1.76, 1.79 |
| Asian/Oceanian | 21.50 | 1.28 | 1.26, 1.31 |
| Other European | 20.70 | 1.35 | 1.33, 1.38 |
| African | 16.61 | 1.03 | 1.02, 1.05 |
| Active diseases c | |||
| Allergy | 19.14 | 1.09 | 1.07, 1.11 |
| Pain | 16.26 | 0.82 | 0.82, 0.83 |
| Respiratory disease | 14.92 | 0.80 | 0.79, 0.81 |
| Disability | 13.00 | 0.65 | 0.64, 0.65 |
| Cardiovascular | 14.45 | 0.61 | 0.61, 0.62 |
| Mental disorder | 17.09 | 0.95 | 0.94, 0.95 |
| Neurological | 17.37 | 0.95 | 0.94, 0.96 |
| Diabetes mellitus | 9.94 | 0.49 | 0.49, 0.50 |
| Digestive system disorder | 14.82 | 0.77 | 0.76, 0.77 |
| Thyroid gland‐related disease | 14.60 | 0.79 | 0.78, 0.80 |
| Number of comorbidities; grouped d (continuous) | 0.84 | 0.83, 0.84 | |
| General Practitioner (GP) characteristics | |||
| Gender | |||
| Male | 16.54 | Ref | |
| Female | 17.61 | 1.05 | 1.04, 1.07 |
| Age (continuous) | 0.99 | 0.99, 0.99 | |
| Type of GP | |||
| Assigned GP | 17.24 | Ref | |
| Substitute/Resident GP | 20.97 | 1.29 | 1.26, 1.32 |
| Primary Centre Care characteristics | |||
| Training Centre | |||
| No | Ref | ||
| Yes | 1.13 | 1.08, 1.19 | |
| Clinically relevant interactions | |||
| Nationality × Patient age a (continuous) | |||
| Constant | 0.77 | 0.75, 0.79 | |
| Spaniard | Ref | ||
| American | 1.09 | 1.05, 1.12 | |
| Asian/Oceanian | 0.72 | 0.68, 0.76 | |
| Other European | 0.86 | 0.82, 0.91 | |
| African | 0.65 | 0.63, 0.67 | |
| Age (1 year increase) | 0.97 | 0.97, 0.97 | |
| American × Age (1 year increase) | 1.005 | 1.005, 1.006 | |
| Asian/Oceanian × Age (1 year increase) | 1.007 | 1.005, 1.008 | |
| Other European × Age (1 year increase) | 1.005 | 1.004, 1.006 | |
| African × Age (1 year increase) | 1.004 | 1.003, 1.005 | |
| Disability × Cardiovascular disease | |||
| Constant | 0.27 | 0.27, 0.28 | |
| None | Ref | ||
| Disability | 0.78 | 0.77, 0.80 | |
| Cardiovascular disease | 0.66 | 0.65, 0.66 | |
| Disability × Cardiovascular disease | 0.84 | 0.82, 0.85 | |
| Disability × Diabetes mellitus (DM) | |||
| Constant | 0.23 | 0.23, 0.24 | |
| None | Ref | ||
| Disability | 0.67 | 0.67, 0.68 | |
| DM | 0.50 | 0.49,0.50 | |
| Disability × DM | 1.19 | 1.15, 1.22 | |
| Mental disorder × Cardiovascular disease | |||
| Constant | 0.27 | 0.26, 0.28 | |
| None | Ref | ||
| Mental disorder | 0.94 | 0.93, 0.95 | |
| Cardiovascular disease | 0.59 | 0.59, 0.60 | |
| Mental disorder × Cardiovascular disease | 1.11 | 1.10, 1.13 | |
| Cardiovascular disease × Respiratory disease | |||
| Constant | 0.27 | 0.26, 0.27 | |
| None | Ref | ||
| Cardiovascular disease | 0.62 | 0.62, 0.63 | |
| Respiratory disease | 0.92 | 0.91, 0.94 | |
| Cardiovascular disease × Respiratory disease | 0.88 | 0.86, 0.90 | |
| Diabetes mellitus (DM) × Digestive disorder | |||
| Constant | 0.23 | 0.22, 0.23 | |
| None | Ref | ||
| DM | 0.48 | 0.48, 0.49 | |
| Digestive disorder | 0.77 | 0.76, 0.78 | |
| DM × Digestive disorder | 1.17 | 1.14, 1.21 | |
| Diabetes mellitus (DM) × Thyroid gland‐related disease | |||
| Constant | 0.22 | 0.22, 0.23 | |
| None | Ref | ||
| DM | 0.49 | 0.48, 0.49 | |
| Thyroid gland‐related disease | 0.78 | 0.76, 0.78 | |
| DM × Thyroid gland‐related disease | 0.48 | 1.14, 1.21 | |
| Nationality × Disability | |||
| Constant | 0.21 | 0.21, 0.22 | |
| Spaniard | Ref | ||
| American | 1.65 | 1.63, 1.67 | |
| Asian/Oceania | 1.18 | 1.15, 1.20 | |
| Other European | 1.26 | 1.25, 1.29 | |
| African | 0.95 | 0.94, 0.97 | |
| Disability | 0.65 | 0.64, 0.65 | |
| Spaniard × Disability | Ref | Ref | |
| American × Disability | 1.28 | 1.24, 1.32 | |
| Asian/Oceanian × Disability | 1.25 | 1.16, 1.36 | |
| Other European × Disability | 1.12 | 1.06, 1.19 | |
| African × Disability | 1.32 | 1.26, 1.40 | |
| Nationality × Mental disorder | |||
| Constant | 0.19 | 0.19, 0.20 | |
| Spaniard | Ref | ||
| American | 1.80 | 1.78, 1.82 | |
| Asian/Oceanian | 1.27 | 1.24, 1.29 | |
| Other European | 1.37 | 1.34, 1.39 | |
| African | 1.02 | 1.01, 1.03 | |
| Mental | 0.98 | 0.97, 0.99 | |
|
Spaniard × Mental disorder
American × Mental disorder
Asian/Oceanian × Mental disorder Other European × Mental disorder African × Mental disorder |
Ref | Ref | |
| 0.93 | 0.91, 0.96 | ||
| 1.05 | 0.98, 1.13 | ||
| 0.95 | 0.92, 0.99 | ||
| 1.06 | 1.02, 1.10 | ||
| Training Centre (TC) × Assigned GP | |||
| Constant | 0.19 | 0.19, 0.20 | |
| Not TC × Assigned GP | Ref | ||
| Substitute/Resident GP | 1.25 | 1.21, 1.28 | |
| TC | 1.06 | 1.01, 1.12 | |
| TC × Substitute/Resident GP | 1.08 | 1.04, 1.13 | |
Age in years refers to the first prescription made in the study period
American refers to the Americas (North, Central and South America)
Reference, for each of the active diseases, was population who had the active disease against the population who did not
Sum of group of pathologies
Interactions
The highest decrease in the likelihood of IMNA when nationality interacts with other pathologies such as mental disorder or disability was shown in other Europeans compared to the same nationality without the pathology. Young age was an IMNA protective factor for all nationalities. Interactions between pathologies might raise or attenuate the likelihood of IMNA but, in all cases, people with comorbidities showed a lower likelihood of IMNA. Being prescribed a new treatment by a substitute/resident GP at a resident‐training PCC increased the likelihood of IMNA.
Multivariate analysis
The multilevel multivariate logistic regression model is shown in Table 4. Older age, being a Spaniard or African and having a disease other than pain or mental disorders were protective factors for IMNA. Clinically relevant interactions include those between nationality and age; nationality and disability; nationality and mental disorders; and type of GP and type of PCC. Figure 1 shows how the prevalence of IMNA, based on this analysis, evolved as patients of different nationalities got older. The African population consistently showed the lowest odds of IMNA independently of age. In the younger population, the nationalities with the greatest likelihood of IMNA were American and Spanish. This changed in the elderly; other European became the nationality with the second highest likelihood of IMNA while Spaniards’ likelihood of IMNA decreased and approached that of Africans. Getting a prescription at a teaching centre and/or from a substitute or resident GP increased the odds of IMNA. Mental disorders and disability moderated the likelihood of IMNA in some nationalities. The largest effect was shown for the African population. The African population with a mental disorder had greater likelihood of IMNA than the African population without a mental disorder. This effect was seen in a similar way in the Spanish population but the effect was smaller. In contrast, the population from the Americas has a greater likelihood of initiating pharmacological treatment when they have a mental disorder.
Table 4.
Multilevel multivariate logistic regression analysis of the dependence of IMNA on several characteristics of patient, General Practitioner and Primary Care Centre
| Patient characteristics | Odds ratio | 95% confidence interval |
|---|---|---|
| Constant | 0.71 | 0.69, 0.72 |
| Age a (continuous) | 0.98 | 0.98, 0.98 |
| Nationality | ||
| Spaniard | Ref | |
| American b | 1.11 | 1.07, 1.14 |
| Asian/Oceanian | 0.71 | 0.67, 0.76 |
| Other European | 0.88 | 0.84, 0.92 |
| African | 0.65 | 0.63, 0.67 |
| Comorbidity c | ||
| Pain | 1.08 | 1.07, 1.08 |
| Respiratory disease | 0.93 | 0.92, 0.94 |
| Disability | 0.94 | 0.93, 0.95 |
| Cardiovascular | 0.94 | 0.93, 0.95 |
| Mental disorder | 1.01 | 1.00, 1.02 |
| Diabetes mellitus | 0.80 | 0.79, 0.81 |
| Digestive disorder | 0.97 | 0.96, 0.97 |
| Thyroid gland‐related disease | 0.94 | 0.93, 0.95 |
| General Practitioner (GP) characteristics | ||
| Substitute/Resident GP | 1.18 | 1.16, 1.20 |
| Primary Care Centre characteristics | ||
| Training Centre (TC) | 1.04 | 1.01, 1.11 |
| Interactions | ||
| Nationality × Age | ||
| Spaniard × Age | Ref | |
| American × Age | 1.004 | 1.004, 1.005 |
| Asian/Oceanian × Age | 1.006 | 1.004, 1.007 |
| European (not Spain) × Age | 1.004 | 1.003, 1.005 |
| African × Age | 1.003 | 1.002, 1.004 |
| Nationality × Disability | ||
| Spaniard × Disability | Ref | |
| American × Disability | 1.05 | 1.02,1.08 |
| Asian and Oceanian × Disability | 1.01 | 0.93, 1.10 |
| European (not Spain) × Disability | 0.97 | 0.91, 1.02 |
| African × Disability | 1.07 | 1.02, 1.13 |
| Nationality × Mental disorder | ||
| Spain × Mental disorder | Ref | |
| American × Mental disorder | 0.96 | 0.94, 0.99 |
| Asia/Oceania × Mental disorder | 1.07 | 0.99, 1.15 |
| Europe (not Spain) × Mental disorder | 0.97 | 0.93, 1.01 |
| African × Mental disorder | 1.07 | 1.04, 1.11 |
| TC × Substitute/Resident GP | 1.04 | 1.00, 1.09 |
Age in years refers to the first prescription made in the study period
American refers to the Americas (North, Central and South America)
Reference, for each of the active diseases, was population who had the active disease against population who did not
Figure 1.
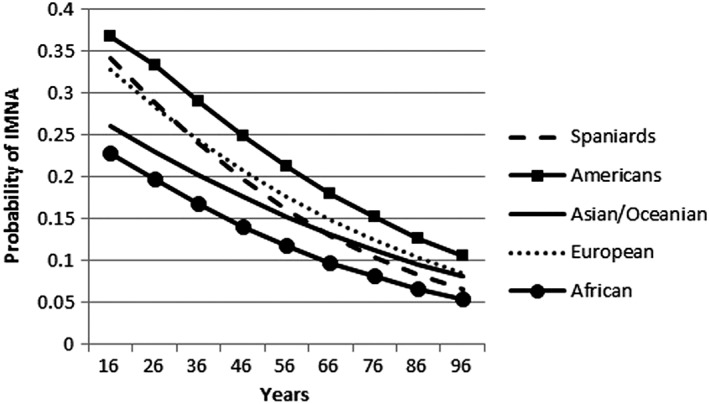
Trends in IMNA based on interaction between age of patient and nationality in multilevel multivariate logistic regression model
Discussion
This is the first study conducted in Spain, and probably the largest worldwide, to assess IMNA prevalence and predictive factors. It is part of a larger mixed‐method project including an ongoing qualitative study. Understanding patients’ reasons for non‐initiation of medication, together with pharmacoepidemiological results, will complement understanding of IMNA. We found that at least 17.62% of new prescriptions issued in the Catalan public primary care system are not dispensed in the month following prescription. This rate slightly decreases to 16.05% when the follow‐up period is 3 months.
Prevalence of IMNA in our study is in line with the findings of other studies which reported rates of IMNA ranging from 9% to 36% on a wide variety of medications prescribed in primary care 7, 16, 17, 24. Between‐country differences could be explained by differences in preperiod and follow‐up period used in the studies. However, Pottegård et al. showed that 90% of patients who filled their prescriptions within 4 months, did it within the first week 7. Similarly, Shin et al. showed an increase in initial medication adherence of only 1.8% when the follow‐up period increased from 14 to 90 days 16. We only observed an increase in initial medication adherence of 1.5% between 1 and 3 months. These data indicate that most patients who fill a new medication do so within the first month.
Lowest rates of IMNA are observed in penicillins and medications for some chronic conditions [such as ACE inhibitors, HMG CoA reductase inhibitors or selective serotonin reuptake inhibitors (SSRI)]. This supports the hypothesis that initial medication adherence is more likely if patients perceive the disease as severe and/or threatening 25. In line with this, rates of non‐adherence after 1 month are highly reduced after 3 months in all chronic conditions but remained high in treatments typically prescribed for symptomatic diseases (i.e., anilides and proton pump inhibitors). The highest rates of IMNA are observed in medicines prescribed for short‐term acute pathologies, such as anilides (e.g., paracetamol), propionic acid derivatives (e.g., ibuprofen) and proton pump inhibitors (e.g., omeprazole). Another possible explanation for IMNA in medications for symptomatic diseases is that the patients had units of the drug in the medicine cabinet (‘the medicine‐cabinet effect’) from previous use (prescription to the patient or a relative, over‐the‐counter dispensation) 26.
High rates of single‐prescription‐filled were seen in pharmacological groups mainly prescribed to treat acute disorders where a single prescription may suffice. However, attention must be paid to medications for chronic pathologies such as ACE inhibitors, SSRIs, insulins and anticholinergics, where filling just one prescription represents a pathology‐control failure, independently of whether the medication was taken or not. The greatest rise in rates between the 1‐month rate and single‐prescription‐filled was observed in anticholinergics. Although pathologies treated by these medications also require multiple prescriptions, the explanation may be linked to patient difficulties or unfamiliarity with more complex pharmaceutical devices such as inhalers or nebulizers 27.
Consistent with other studies 7, 15, 16, 17, 24, younger people were less likely to initiate treatment. This could be explained by the fact that young people, who are generally healthier, do not perceive the new diagnosis as threatening 25 or, alternatively, react to the new diagnosis with anger and refuse to take medication for a chronic condition 28.
Nationality showed the highest effect in relation to IMNA, especially among people from the Americas, who usually immigrate from Central and South America 26. This could be explained by mistrust or misconception about the Spanish health system; Velasco et al. 29 showed that around 25% of people from these countries have difficulties navigating the Spanish primary health care system. Similarly, the prevalence of IMNA is higher in the European and Asian population older than 27 and 65 years, respectively. Cultural beliefs and GP–patient communication might explain these rates, as other authors previously pointed out 30, 31. Young immigrants, possibly better adapted to the system 32, 33, have lower rates of IMNA than Spaniards. However, little is known about the adaptation of the young immigrant population to the health care system.
The effect of mental disorders on IMNA varies according to nationality, with higher rates in Asians and Africans with mental disorders. This could be explained by higher social stigma regarding mental disorders in the Asian and African immigrant populations 34, 35. The increase in likelihood of IMNA in patients with pain disorders might be related to the ‘medicine‐cabinet effect’ and the fact that medication taken for mild symptomatic pathologies, which reduce symptoms without acting on the origin of the disease, may have a low benefit–risk ratio. On the other hand, patients with chronic pathologies such as diabetes or cardiovascular disorders, who may have greater awareness of the consequences of their condition 36, 37, showed a lower likelihood of IMNA.
The prescriber plays a role in the initiation of medicines. Trust in the GP has been described as associated with achievement of clinical goals and adherence 13, 38. In our study, prescriptions from assigned GPs showed lower IMNA rates. Furthermore, in resident‐training PCCs, prescriptions not issued by the assigned GP had an even higher likelihood of IMNA. Patient trust could decrease because resident GPs are receiving training and are normally younger GPs who conduct the consultation unassisted.
Strengths and limitations
The main strengths of this study are that it is highly representative and considers a large number of pharmacological treatments. Our study included most of the population (80% of the Catalan population). As far as we know, this study analysed one of the largest samples in the pharmacoepidemiological field to date. Interactions between potential IMNA predictive factors have never been explored. In this regard, our results revealed interesting findings. Interpreting those findings was one of the most challenging aspects of the study.
Working with administrative registry studies has inherent limitations. We had missing information about some GPs so we imputed this information to minimize the issue. Some relevant variables – related to patients’ beliefs about medication or illness, GP–patient relationship and adverse‐effect experiences – which could influence IMNA were not recorded in clinical charts and could not be explored.
The definition of IMNA is based on matching prescription and invoicing databases. The invoicing database only provides monthly invoicing data. This limitation prevented us from determining the exact time span between when the prescription was issued and when it was filled at the pharmacy. Another limitation related to the IMNA definition is that dispensing does not necessarily imply consumption and we might have underestimated IMNA. To deal with this potential limitation, we took a conservative approach and extended the follow‐up period to at least 1 month and carried out sensitivity analyses on distinct follow‐up periods and by single‐filled prescription. In contrast, as previously mentioned, the ‘medicine‐cabinet effect’ might have overestimated the IMNA rate.
In conclusion, the rate of IMNA in Catalonia is high when all medications are taken into account. IMNA rates decreased slightly when follow‐up periods longer than 1 month were analysed. IMNA is specially marked in the young population in general and in the older immigrant population. Acute pathologies and related medication are especially sensitive to IMNA. The representativeness of this study may help health planners when establishing new strategies. Improving trust in resident GPs, ensuring optimum care in the vulnerable immigrant population and strengthening the motivation of young people to initiate a needed pharmacological treatment, as well as explaining the importance of not abandoning a newly‐prescribed medication, should be addressed in primary care.
Competing Interests
There are no competing interests to declare.
We thank María Luisa Vazquez and Victora Porthé from Consorci de Salut i Social de Catalunya for their help in interpreting the interaction between nationality and gender in IMNA. We thank Stephen Kelly for help in English language editing.
Funding
This research was funded by the project ‘El problema de la no iniciación del tratamiento farmacológico: evaluación con métodos mixtos’ (PI14/00052) included in the Spanish National Plan for R&D cofounded by the Institute of Health Carlos III (ISCIII) and the European Fund for Regional Development (FEDER).
Contributors
M.R.V., A.F., M.F.J., P.M.P., M.T.P.M. and A.M.J. designed the original study. I.A.L., A.S.N., M.R.V. and A.F. designed and conducted the analysis strategy. I.A.L., with the help of all authors, wrote the manuscript. All authors contributed to editing and approved the final version of the manuscript.
Aznar‐Lou, I. , Fernández, A. , Gil‐Girbau, M. , Fajó‐Pascual, M. , Moreno‐Peral, P. , Peñarrubia‐María, M. T. , Serrano‐Blanco, A. , Sánchez‐Niubó, A. , March‐Pujol, M. A. , Jové, A. M. , and Rubio‐Valera, M. (2017) Initial medication non‐adherence: prevalence and predictive factors in a cohort of 1.6 million primary care patients. Br J Clin Pharmacol, 83: 1328–1340. doi: 10.1111/bcp.13215.
References
- 1. Marks DF, Murray M, Evans B, Estacio EV. Medication Taking: Adherence and Resistance. In: Health Psychology: Theory, Research and Practice, 3rd edn. London: Sage Publications, 2010; 410–436. [Google Scholar]
- 2. da Costa FA, Pedro AR, Teixeira I, Bragança F, da Silva JA, Cabrita J. Primary non‐adherence in Portugal: findings and implications. Int J Clin Pharm 2015; 37: 626–635. [DOI] [PubMed] [Google Scholar]
- 3. Cramer JA. A systematic review of adherence with medications for diabetes. Diabetes Care 2004; 27: 1218–1224. [DOI] [PubMed] [Google Scholar]
- 4. DiMatteo MR. Variations in patients’ adherence to medical recommendations: a quantitative review of 50 years of research. Med Care 2004; 42: 200–209. [DOI] [PubMed] [Google Scholar]
- 5. Ismaila A, Corriveau D, Vaillancourt J, Parsons D, Dalal A, Su Z, et al. Impact of adherence to treatment with tiotropium and fluticasone propionate/salmeterol in chronic obstructive pulmonary diseases patients. Curr Med Res Opin 2014; 30: 1427–1436. [DOI] [PubMed] [Google Scholar]
- 6. Chang P‐Y, Chien L‐N, Lin Y‐F, Chiou H‐Y, Chiu W‐T. Nonadherence of oral antihyperglycemic medication will increase risk of end‐stage renal disease. Medicine (Baltimore) 2015; 94: e2051. [DOI] [PMC free article] [PubMed] [Google Scholar]
- 7. Pottegård A, Christensen RD, Houji A, Christiansen CB, Paulsen MS, Thomsen JL, et al. Primary non‐adherence in general practice: a Danish register study. Eur J Clin Pharmacol 2014; 70: 757–763. [DOI] [PubMed] [Google Scholar]
- 8. Vrijens B, De Geest S, Hughes DA, Przemyslaw K, Demonceau J, Ruppar T, et al. A new taxonomy for describing and defining adherence to medications. Br J Clin Pharmacol 2012; 73: 691–705. [DOI] [PMC free article] [PubMed] [Google Scholar]
- 9. Hutchins DS, Zeber JE, Roberts CS, Williams AF, Manias E, Peterson AM. Initial medication adherence – review and recommendations for good practices in outcomes research: an ISPOR Medication Adherence and Persistence Special Interest Group Report. Value Health 2015; 18: 690–699. [DOI] [PubMed] [Google Scholar]
- 10. Fischer MA, Stedman MR, Lii J, Vogeli C, Shrank WH, Brookhart MA, et al. Primary medication non‐adherence: analysis of 195,930 electronic prescriptions. J Gen Intern Med 2010; 25: 284–290. [DOI] [PMC free article] [PubMed] [Google Scholar]
- 11. Hansen DG, Vach W, Rosholm J‐U, Søndergaard J, Gram LF, Kragstrup J. Early discontinuation of antidepressants in general practice: association with patient and prescriber characteristics. Fam Pract 2004; 21: 623–629. [DOI] [PubMed] [Google Scholar]
- 12. Jackevicius CA, Li P, Tu JV. Prevalence, predictors, and outcomes of primary nonadherence after acute myocardial infarction. Circulation 2008; 117: 1028–1036. [DOI] [PubMed] [Google Scholar]
- 13. Bauer AM, Parker MM, Schillinger D, Katon W, Adler N, Adams AS, et al. Associations between antidepressant adherence and shared decision‐making, patient‐provider trust, and communication among adults with diabetes: Diabetes Study of Northern California (DISTANCE). J Gen Intern Med 2014; 29: 1139–1147. [DOI] [PMC free article] [PubMed] [Google Scholar]
- 14. Mestre TA, eodoro T T, Reginold W, Graf J, Kasten M, Sale J, et al. Reluctance to start medication for Parkinson's disease: a mutual misunderstanding by patients and physicians. Parkinsonism Relat Disord 2014; 20: 608–612. [DOI] [PubMed] [Google Scholar]
- 15. Thengilsdóttir G, Pottegård A, Linnet K, Halldórsson M, Almarsdóttir AB, Gardarsdóttir H. Do patients initiate therapy? Primary non‐adherence to statins and antidepressants in Iceland. Int J Clin Pract 2015; 69: 597–603. [DOI] [PubMed] [Google Scholar]
- 16. Shin J, McCombs JS, Sanchez RJ, Udall M, Deminski MC, Cheetham TC. Primary nonadherence to medications in an integrated healthcare setting. Am J Manag Care 2012; 18: 426–434. [PubMed] [Google Scholar]
- 17. Fischer MA, Choudhry NK, Brill G, Avorn J, Schneeweiss S, Hutchins D, et al. Trouble getting started: predictors of primary medication nonadherence. Am J Med 2011; 124: 1081.e9 1081.22. [DOI] [PubMed] [Google Scholar]
- 18. von Elm E, Altman DG, Egger M, Pocock SJ, Gøtzsche PC, Vandenbroucke JP. The Strengthening the Reporting of Observational Studies in Epidemiology (STROBE) statement: guidelines for reporting observational studies. Ann Intern Med 2007; 147: 573–577. [DOI] [PubMed] [Google Scholar]
- 19. Bolíbar B, Fina Avilés F, Morros R, Garcia‐Gil Mdel M, Hermosilla E, Ramos R, et al. SIDIAP database: electronic clinical records in primary care as a source of information for epidemiologic research. Med Clínica 2012; 138: 617–621. [DOI] [PubMed] [Google Scholar]
- 20. Garcia‐Armesto S, Abadía‐Taira MB, Durán A, Hernández‐Quevedo C, Bernal‐Delgado E. Spain: Health system review. Health Syst Transit 2010; 12: 1–295. [PubMed] [Google Scholar]
- 21. García‐Gil MDM, Hermosilla E, Prieto‐Alhambra D, Fina F, Rosell M, Ramos R, et al. Construction and validation of a scoring system for the selection of high‐quality data in a Spanish population primary care database (SIDIAP). Inform Prim Care 2011; 19: 135–145. [DOI] [PubMed] [Google Scholar]
- 22. Grupo de Eco Salud ULPGC DG de Ordenación Personal . Informe Descriptivo Encuesta adjudicatarios MIR‐R1. Convocatoria 2012–2013 [online]. Available at http://www.msssi.gob.es/profesionales/formacion/necesidadEspecialistas/doc/InformeMIR2013.pdf (last accessed 27 September 2016).
- 23. Leckie G, Charlton C. runmlwin: A program to run the MLwiN multilevel modeling software from within Stata. J Stat Softw 2012; 52: 1–40. [Google Scholar]
- 24. Tamblyn R, Eguale T, Huang A, Winslade N, Doran P. The incidence and determinants of primary nonadherence with prescribed medication in primary care: a cohort study. Ann Intern Med 2014; 160: 441–450. [DOI] [PubMed] [Google Scholar]
- 25. Gil‐Girbau M, Aznar‐Lou I, Peñarrubia‐María M, Fernandez A, Fajó‐Pascual M, Moreno‐Peral P, et al El problema de la no‐iniciación al tratamiento farmacológico: resultados preliminares de un estudio cualitativo. Zaragoza, 2016.
- 26. Instituto Nacional de Estadística (INE). Encuesta Nacional de Inmigrantes. Resultados por continentes y países más representados. Año 2007. Available at http://www.ine.es/jaxi/Tabla.htm?path=/t20/p319/a2007/p03/l0/&file=04001.px&L=0 (last accessed 5 January 2017).
- 27. Sharafkhaneh A, Wolf RA, Goodnight S, Hanania NA, Make BJ, Tashkin DP. Perceptions and attitudes toward the use of nebulized therapy for COPD: patient and caregiver perspectives. COPD 2013; 10: 482–492. [DOI] [PubMed] [Google Scholar]
- 28. Johnson HM, Warner RC, LaMantia JN, Bowers BJ. ‘I have to live like I'm old.’ Young adults’ perspectives on managing hypertension: a multi‐center qualitative study. BMC Fam Pract 2016; 17: 31. [DOI] [PMC free article] [PubMed] [Google Scholar]
- 29. Velasco C, Vinasco AM, Trilla A. Immigrant perceptions of the Spanish National Healthcare System and its services. Aten Primaria 2015; 48: 149–158. [DOI] [PMC free article] [PubMed] [Google Scholar]
- 30. Saurina C, Vall‐Llosera L, Saez M. A qualitative analysis of immigrant population health practices in the Girona healthcare region. BMC Public Health 2010; 10: 379. [DOI] [PMC free article] [PubMed] [Google Scholar]
- 31. Suurmond J, Uiters E, Bruijne MC, Stronks K, Essink‐Bot M‐L. Negative health care experiences of immigrant patients: a qualitative study. BMC Health Serv Res 2011; 11: 10. [DOI] [PMC free article] [PubMed] [Google Scholar]
- 32. Kwak K, Rudmin F. Adolescent health and adaptation in Canada: examination of gender and age aspects of the healthy immigrant effect. Int J Equity Health 2014; 13: 103. [DOI] [PMC free article] [PubMed] [Google Scholar]
- 33. Portes A, Vickstrom E, Aparicio R. Coming of age in Spain: the self‐identification, beliefs and self‐esteem of the second generation. Br J Sociol 2011; 62: 387–417. [DOI] [PMC free article] [PubMed] [Google Scholar]
- 34. Aznar‐Lou I, Serrano‐Blanco A, Fernández A, Luciano JV, Rubio‐Valera M. Attitudes and intended behaviour to mental disorders and associated factors in Catalan population, Spain: cross‐sectional population‐based survey. BMC Public Health 2016; 16: 127. [DOI] [PMC free article] [PubMed] [Google Scholar]
- 35. Evans‐Lacko S, Henderson C, Thornicroft G. Public knowledge, attitudes and behaviour regarding people with mental illness in England 2009–2012. Br J Psychiatry Suppl 2013; 55: s51–s57. [DOI] [PubMed] [Google Scholar]
- 36. Hagger MS, Orbell S. A meta‐analytic review of the common‐sense model of illness representations. Psychol Health 2003; 18: 141–184. [Google Scholar]
- 37. Ross S, Walker A, MacLeod MJ. Patient compliance in hypertension: role of illness perceptions and treatment beliefs. J Hum Hypertens 2004; 18: 607–613. [DOI] [PubMed] [Google Scholar]
- 38. Jones DE, Carson KA, Bleich SN, Cooper LA. Patient trust in physicians and adoption of lifestyle behaviors to control high blood pressure. Patient Educ Couns 2012; 89: 57–62. [DOI] [PMC free article] [PubMed] [Google Scholar]