Abstract
Adiponectin, an adipocyte-derived circulating protein, accumulates in the heart, vascular endothelium, and skeletal muscles through an interaction with T-cadherin (T-cad), a unique glycosylphosphatidylinositol-anchored cadherin. Recent studies have suggested that this interaction is essential for adiponectin-mediated cardiovascular protection. However, the precise protein-protein interaction between adiponectin and T-cad remains poorly characterized. Using ELISA-based and surface plasmon analyses, we report here that T-cad fused with IgG Fc as a fusion tag by replacing its glycosylphosphatidylinositol-anchor specifically bound both hexameric and larger multimeric adiponectin with a dissociation constant of ∼1.0 nm and without any contribution from other cellular or serum factors. The extracellular T-cad repeats 1 and 2 were critical for the observed adiponectin binding, which is required for classical cadherin-mediated cell-to-cell adhesion. Moreover, the 130-kDa prodomain-bearing T-cad, uniquely expressed on the cell surface among members of the cadherin family and predominantly increased by adiponectin, contributed significantly to adiponectin binding. Inhibition of prodomain-processing by a prohormone convertase inhibitor increased 130-kDa T-cad levels and also enhanced adiponectin binding to endothelial cells both by more preferential cell-surface localization and by higher adiponectin-binding affinity of 130-kDa T-cad relative to 100-kDa T-cad. The preferential cell-surface localization of 130-kDa T-cad relative to 100-kDa T-cad was also observed in normal mice aorta in vivo. In conclusion, our study shows that a unique key feature of the T-cad prodomain is its involvement in binding of the T-cad repeats 1 and 2 to adiponectin and also demonstrates that adiponectin positively regulates T-cad abundance.
Keywords: adipokine, adiponectin, cadherin, cell surface protein, glycosylphosphatidylinositol (GPI anchor), protein domain, protein-protein interaction
Introduction
Adiponectin is a circulating protein exclusively produced by adipocytes. It is synthesized as a single peptide that undergoes multimerization to form trimers, hexamers, and high molecular weight (HMW2; 12–18-mers) multimers before secretion (1, 2). Structural studies of the various multimers have demonstrated that the trimers form a ball and stick-like structure, hexamer consists of two trimers arranged in a parallel head-to-head manner, and HMW multimers appear to consist mainly of 18-mers (hexamers of trimers) in two conformations: a flat fan-shaped formation and a bouquet-shaped configuration (3, 4). Clinical analyses have demonstrated that the HMW multimer adiponectin is the active form and responsible for the pleiotropic effects (5–8). It accumulates in tissues through interaction with T-cadherin, a unique glycosylphosphatidylinositol (GPI)-anchored cadherin (9–11), discovered initially as a calcium-dependent adiponectin-binding protein by expression cloning (12). T-cadherin shares a common ectodomain organization with high sequence similarity and is a close phylogenetic relative of classical cadherins (13). However, it is considered atypical among cadherins in that it lacks the transmembrane helix and cytoplasmic domain, which is usually required for intracellular signaling, and instead is attached to the plasma membrane via a GPI moiety (Fig. 1A). Recently, genome-wide single nucleotide polymorphism (SNP) analysis has provided evidence for a clear association between SNPs of T-cadherin gene and both plasma adiponectin levels and cardiovascular diseases (14–19). The levels of T-cadherin protein, but not its mRNA expression, are increased by adiponectin and are markedly low in adiponectin-deficient mice (9–11), suggesting the importance of adiponectin and adiponectin-induced regulation of T-cadherin protein for cardiovascular protection.
Figure 1.
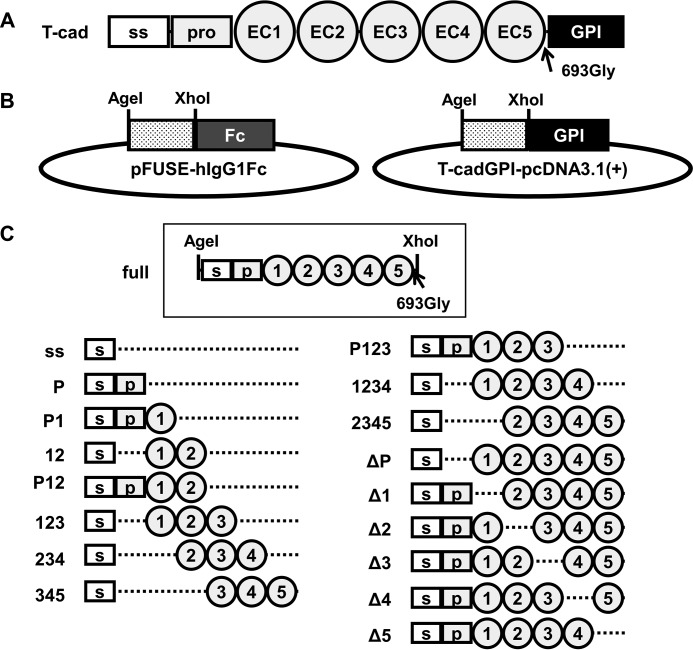
Construction strategy of mouse T-cadherin domain deletion mutants. A, structure of mouse T-cad. The arrow indicates the amino acid (glycine) just before glycosylphosphatidylinositol-anchoring domain. ss, signal sequence; pro, prodomain; GPI, glycosylphosphatidylinositol-anchoring domain. B, expression vectors for Fc-fused (left, pFUSE-hIgG1Fc backbone) and GPI-anchoring (right, pcDNA3.1(+) backbone) T-cadherin mutants in this study. All T-cadherin mutant fragments were inserted in-frame between AgeI and XhoI sites. C, T-cadherin mutant fragments. s, signal sequence; p, prodomain, 1–5, extracellular domain 1–5.
Cadherin family proteins are initially synthesized bearing a prodomain, which is thought to limit premature homotypic association within the cell. Functional cadherins have been considered to lack this prodomain during the sorting to cell surface (20). Interestingly, a 130-kDa form of prodomain-containing T-cadherin, similar to the processed form of T-cadherin (100-kDa), is expressed on the cell surface (21) and appears to be more strongly increased by adiponectin than the 100-kDa T-cadherin form, as reported in our previous study (11), suggesting that the prodomain of T-cadherin plays a role in interaction with adiponectin.
In the present study we provide evidence that T-cadherin specifically binds adiponectin without requiring other serum or cellular factors, with a single class of high affinity binding. The region encompassing EC1 and EC2 of T-cadherin, overlapping the region proposed for T-cadherin-mediated cell-to-cell trans interaction (22), is also required for adiponectin binding. The prodomain of T-cadherin contributed to adiponectin binding. The 130-kDa prodomain-bearing T-cadherin was preferentially localized on the cell surface and bound more adiponectin than its 100-kDa form. In turn, adiponectin increased T-cadherin protein abundance, especially the 130-kDa prodomain-containing T-cadherin, thus forming a unique prodomain-mediated feed-forward regulation of T-cadherin abundance and adiponectin binding.
Results
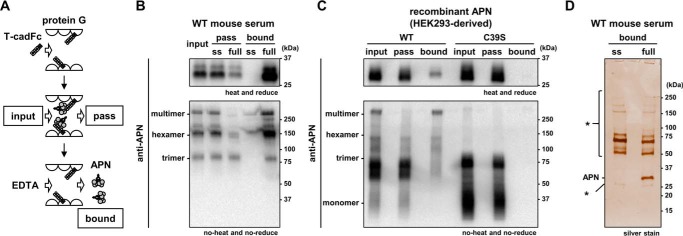
To delineate the binding of adiponectin to T-cadherin, we constructed the human IgG Fc fusion protein of T-cadherin (T-cadFc) as well as its GPI-anchored form (Fig. 1, B and C). When calcium-dependent adiponectin binding of T-cadFc was tested by capturing T-cadFc to Protein G-agarose resin (T-cadFc capture assay, Fig. 2A and supplemental Fig. S1), T-cadFc, but not its signal sequence alone, fused with IgG-Fc, bound adiponectin in normal mouse serum (Fig. 2B) and in conditioned medium of HEK293 cells expressing recombinant adiponectin (Fig. 2C). Importantly, HMW multimer and hexamer, but not trimeric, adiponectin in wild-type (WT) mouse serum was captured by T-cadFc and eluted by EDTA, and trimeric adiponectin appeared in the pass fraction from either samples (Fig. 2, B and C). A disulfide bond through the amino-terminal cysteine was required for the formation of a hexamer and larger HMW multimers, whereas mutation in this amino-terminal Cys to Ser was associated with a lack of formation of hexamer and larger HMW multimers (1–2). The binding selectively of T-cadFc to hexamer and larger HMW multimer adiponectin was further confirmed by a modified CS-mutant adiponectin (Fig. 2C).
Figure 2.
Ca2+-dependent binding of hexamer and multimer adiponectin to T-cadherin. A, schematic illustration of Protein G-based T-cadFc capture assay for evaluating adiponectin (APN) binding. Fc-fusion protein expressed into serum-free DMEM by HEK293 was incubated with Protein G-agarose. After extensive washing, mouse serum or HEK293-derived recombinant adiponectin (input) was applied. The supernatant (pass) and EDTA-mediated elution (bound) were collected. B and C, adiponectin/T-cadherin binding assay. Wild-type mouse serum (B) or HEK293-derived recombinant adiponectin (C) was applied as input. Representative immunoblots for adiponectin are shown in heat and reduced conditions (upper panel) and no-heat and no-reduce conditions (lower panel). D, silver staining analysis of the bound fraction of B. *, nonspecific bands. The constructs of ss (signal sequence) and full are shown in Fig. 1C.
Next, we tested whether adiponectin is a selective ligand for T-cadherin in blood in vivo by examining EDTA elution of bound materials from WT serum (Fig. 2D). Although SDS-PAGE and silver staining identified multiple bands when using WT serum, adiponectin appeared as the sole band specifically detected by silver staining in elution from T-cadFc but not from signal sequence alone (Fig. 2D), suggesting that adiponectin is a specific major ligand for T-cadherin in vivo, although minor proteins eluted were not fully characterized in this study.
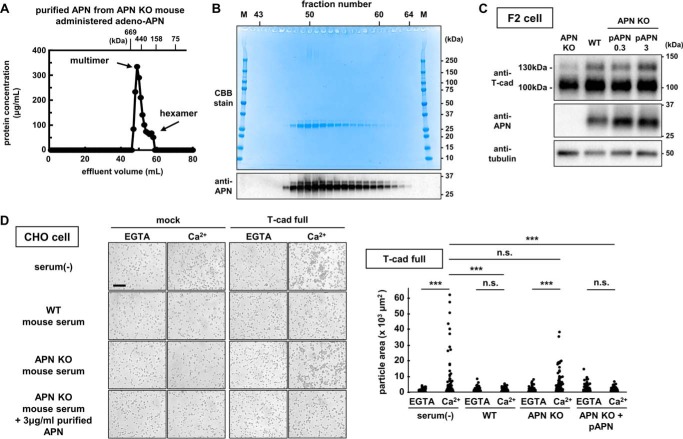
We exploited T-cadFc for multimeric adiponectin purification from serum samples obtained after adenoviral overexpression of adiponectin. Fig. 3A shows the gel-filtration profile of purified adiponectin by T-cadFc using HiloadTM 16/60 SuperdexTM 200 pg. Adiponectin was eluted at fractions corresponding mainly to HMW multimer adiponectin with minor hexamer adiponectin (Fig. 3A) and negligible amounts of contaminants (Fig. 3B). Purified adiponectin accumulated in endothelial cells and markedly increased 130-kDa prodomain-containing T-cadherin and, less effectively, the 100-kDa T-cadherin, similar to WT mouse serum containing adiponectin (Fig. 3C). Overexpression of T-cadherin in Chinese hamster ovary (CHO) cells induced statically significant calcium-dependent cell aggregation under serum-free conditions, as reported previously (22), and in the presence of adiponectin-KO serum (Fig. 3D). However, the addition of adiponectin-containing WT serum or purified adiponectin in adiponectin-KO serum significantly influenced T-cadherin-mediated cell aggregation (Fig. 3D), suggesting that adiponectin can compete with homophilic trans interaction of T-cadherin and that purified adiponectin works in a manner similar to adiponectin present in WT serum.
Figure 3.
Purification of adiponectin from serum of adiponectin-KO mice overexpressing adiponectin. A, gel filtration analysis of purified adiponectin (APN) obtained from adiponectin knock-out mice infected with full-length adiponectin-expressing adenovirus. Each fraction (1 ml/fraction) of protein concentration was determined with the BCA assay. Effluent volume of molecular weight standards (gel filtration calibration kit HMW (GE Healthcare)) using the same procedure is indicated at the top of the figure. B, CBB staining (upper panel) and immunoblot for adiponectin (lower panel) of the fractions 42–63 shown in A in heat and reduced conditions. M, marker. C, purified adiponectin increased T-cadherin protein. F2 cells were cultured in DMEM containing 5% adiponectin knock-out mouse serum (APN-KO), 5% wild-type mouse serum (WT), AKO + 0.3 μg/ml purified adiponectin (p-APN0.3), AKO + 3 μg/ml purified adiponectin (p-APN3). D, cell aggregation assay to evaluate trans interaction of T-cadherin. Left panel, CHO cell aggregates in the presence (Ca2+) or absence of Ca2+ (EGTA) on cells expressing full-length (T-cad-full) or signal sequence (mock) fused with GPI-anchoring region as illustrated in T-cadGPI-pcDNA3.1(+) in Fig. 1B. The inclusion of 10% WT mouse serum or 3 μg/ml purified adiponectin in APN-KO mouse serum but not AKO mouse serum alone affected T-cadherin-dependent cell aggregation. Scale bar, 200 μm. Right panel, quantification of aggregation. Approximately 400–500 particles were automatically identified and plotted in each group. Tukey-Kramer's test. ***, p < 0.001; n.s., not significant.
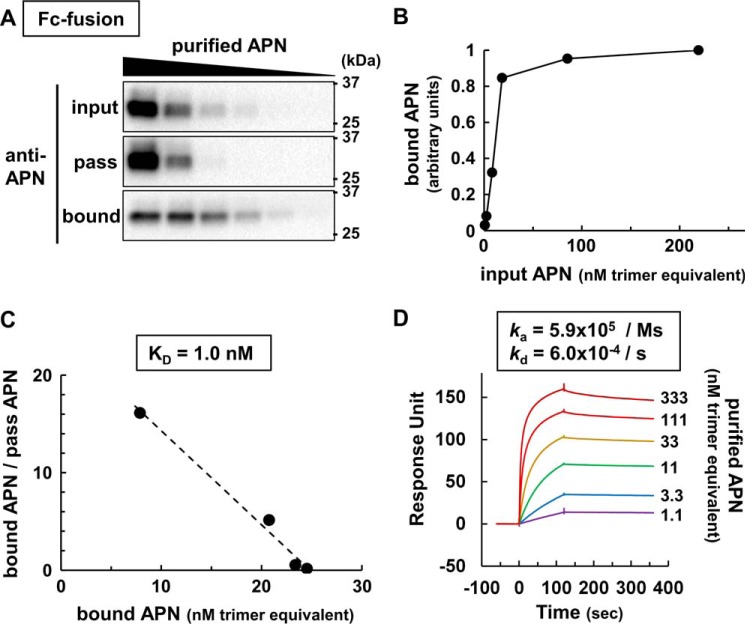
Next, we used this purified adiponectin for adiponectin-T-cadherin kinetic binding studies. High adiponectin concentrations induced by adding purified adiponectin to our T-cadFc capture assay resulted in saturation of adiponectin binding and substantial adiponectin passed through T-cadFc (Fig. 4A). Next, we constructed a saturation curve for the bound adiponectin (Fig. 4B) using ELISA, which was well consistent with that described previously in a cell-based binding study (12). Scatchard analysis of the data derived an apparent KD value of 1.0 nm assuming the trimer adiponectin as the binding unit (Fig. 4C), corresponding to ∼0.5 μg/ml adiponectin at half-maximal binding. These binding characteristics were well reproduced when T-cadFc was captured on surface plasmon assay (Fig. 4D). Higher concentrations of purified adiponectin increased the binding to captured T-cadFc, with a ka = 5.9 × 10⁵ adiponectin/ms. Once the binding was established, it was relatively stable with kd = 6.0 × 10⁻⁴/s. The calculated KD value was 1.0 nm, which was almost identical to the abovementioned T-cadFc capture assay (Fig. 4D).
Figure 4.
Adiponectin binding analysis in T-cadFc capture and surface plasmon assays. A, representative immunoblot for adiponectin (APN) in bound fractions of T-cadFc capture assay using the strategy depicted in Fig. 2A. Increasing concentrations of purified adiponectin were applied as the input fraction. Trimer equivalents of adiponectin concentrations of all fractions were determined experimentally by ELISA. B and C, saturable binding curve (B) and its Scatchard plot of ELISA-based binding assay (C). The binding constant (KD) was calculated as the slope of the approximation straight line. D, SPR analysis of purified adiponectin (APN) and full-length T-cadFc. ∼100 response units of T-cad fused with human IgG-Fc were trapped by anti-human IgG Fc antibody immobilized on the sensor surface, and each concentration (333–1.1 nm trimer equivalent) of purified adiponectin was injected at time = 0. Each sensorgram was adjusted to that of purified adiponectin = 0 nm (not shown). Kinetics constants (ka and kd) were analyzed using BIACORE T200 evaluation software v1.0, assuming a 1:1 binding model.
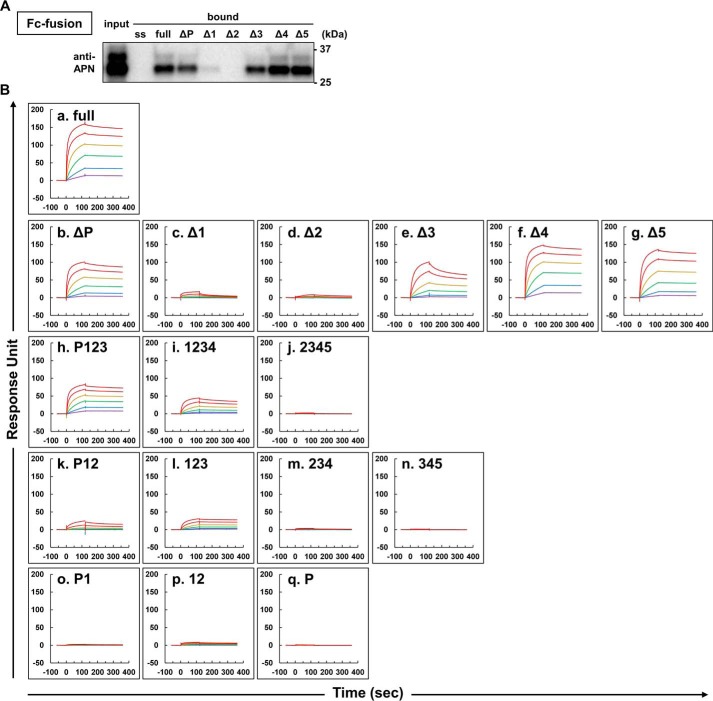
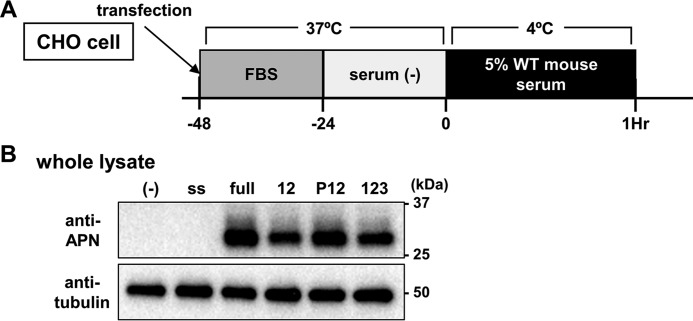
Next, we explored the T-cadherin domains required for adiponectin binding using a series of previously described Fc fusion constructs (Fig. 1, A and C). A single domain deletion of extracellular cadherin repeat 1 (EC1) or EC2 of T-cadherin was associated with marked loss of adiponectin binding in the T-cadFc capture assay (Fig. 5A) and in the surface plasmon assay (Fig. 5B, a–g), respectively. A series of domain deletion mutants of T-cadFc lacking either of EC1 or EC2 showed strong decrease of their adiponectin binding, as shown in Δ1 (Fig. 5B, c), Δ2 (Fig. 5B, d), EC2–5 (domain 2345, Fig. 5B, j), EC2–4 (domain 234, Fig. 4B, m), EC3–5 (domain 345, Fig. 5B, n), prodomain with EC1 (domain P1, Fig. 5B, o), and prodomain (domain P, Fig. 5B, q). Even the minimum of EC12 (domain 12, Fig. 5B, p) or EC12 with prodomain (domain P12, Fig. 5B, k) gave a weak but steady increase of adiponectin binding. These results strongly suggest that the region EC1 to EC2 is indispensable for adiponectin binding. Furthermore, expression of the deletion mutant constructs in CHO cells, which have no detectable endogenous T-cadherin (Fig. 6A), enhanced the binding of adiponectin to cells expressing EC12 (domain 12), EC12 with prodomain (domain P12), and EC1–3 (domain 123), suggesting that adiponectin binding requires an extended region overlapping EC1–2 of T-cadherin (Fig. 6B). No standardization of the amount of mutant T-cadherin expressed on CHO cell surface in this experiment may limit direct comparison of the amount of bound adiponectin with the results of surface plasmon assay described in Fig. 5B. Interestingly, the same region was reported as homophilic trans interaction of T-cadherin (22, 23), which was inhibited by the presence of adiponectin (Fig. 3D).
Figure 5.
Deletion of T-cadherin domain on adiponectin binding. A, representative immunoblot for adiponectin, which bound Ca2+ dependently to T-cadFc domain deletion mutants using the strategy shown in Fig. 2A. B, SPR analysis of T-cadFc domain deletion mutants (a–q, see Fig. 1C). The sensorgram in A is for full-T-cadFc identical to Fig. 4D for comparison. Identical concentrations (333–1.1 nm) of purified adiponectin were applied in each mutant T-cadFc analysis. The surface plasmon responses for all mutants were equally scaled to that of a. (full-T-cadFc).
Figure 6.
Extracellular domain EC1–2 is sufficient for adiponectin binding. A, schematic illustration of cell-based T-cadherin domain deletion. Each deletion mutant fused with GPI-anchoring region as illustrated in T-cadGPI-pcDNA3.1(+) in Fig. 1B was transiently expressed in CHO cells. Adiponectin binding was evaluated after a 1-h incubation with 5% WT mouse serum at 4 °C. B, representative immunoblot for adiponectin (APN) and tubulin of CHO cells expressing T-cadherin mutants. −, mock; ss, signal sequence; full, full-length T-cadherin; 12, extracellular domain 1 and 2, P12, prodomain and 12; 123, 12 and extracellular domain 3.
It is noteworthy that a single deletion of the prodomain (ΔP) affected adiponectin binding in both the T-cadherin capture assay (Fig. 5A) and surface plasmon assay (Fig. 5B, b compared with a). Although a single prodomain alone (domain P, Fig. 5B, q) or with EC1 (domain P1, Fig. 5B, o) poorly bound adiponectin, the addition of prodomain to EC12 (domain P12, Fig. 5B, k) and to EC123 (domain P123, Fig. 5B, h) increased adiponectin binding compared with EC12 (domain 12, Fig. 5B, p) and EC123 (domain 123, Fig. 5B, l), respectively.
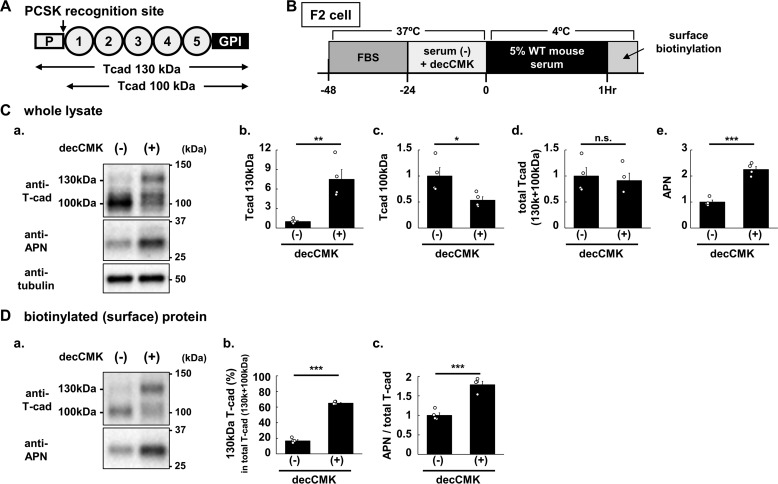
The prodomain of classical cadherins, including T-cadherin, structurally resemble extracellular cadherin domains (20), separated by the typical dibasic prohormone convertase (PCSK) recognition site from the “adhesive” extracellular cadherin domains. The molecular structures of the 130-kDa prodomain-bearing T-cadherin, 100-kDa T-cadherin, so-called the “mature form,” and a conserved PCSK recognition site, are illustrated in Fig. 7A. Unlike other classical cadherins, the 130-kDa prodomain-containing T-cadherin is uniquely expressed on the cell surface along with 100-kDa T-cadherin (21). Accordingly, we further investigated the role of the prodomain on cell-based binding using mouse F2 endothelial cells (Fig. 7B). PCSK inhibition by decanoyl-Arg-Val-Lys-Arg-chloromethyl ketone (decCMK) increased the levels of 130-kDa T-cadherin but reduced 100-kDa T-cadherin levels in whole cell lysates (Fig. 7C, a–d), in agreement with the notion that the typical dibasic PCSK recognition site is conserved in T-cadherin among the cadherins (20). Interestingly, PCSK inhibition also significantly increased adiponectin binding (Fig. 7C, a and e). What is the mechanism of PCSK inhibition-induced increase in adiponectin binding? It is possible that the binding ability of 130-kDa T-cadherin is higher than that of the 100-kDa T-cadherin. Alternatively (or additionally), the cell surface localization of 130-kDa T-cadherin is higher than 100-kDa T-cadherin. Because adiponectin binding must initially take place on the cell surface, we used cell-impermeable biotinylation to assess cell surface-localized T-cadherin (Fig. 7D). PCSK inhibition increased 130-kDa T-cadherin but decreased 100-kDa T-cadherin on the cell surface (Fig. 7D, a). These changes resulted in an increase in the ratio of 130-kDa T-cadherin to total T-cadherin (100-kDa + 130 kDa) on the cell surface (Fig. 7D, b) as well as increased adiponectin binding normalized by total T-cadherin (100-kDa + 130 kDa) on the cell surface (Fig. 7D, a and c). Thus, the 130-kDa T-cadherin seems to have higher adiponectin binding ability compared with 100-kDa T-cadherin, in good agreement with the above cell-free adiponectin binding analysis with T-cadFc (Fig. 5, A and B).
Figure 7.
Adiponectin binding to cell surface expressed prodomain (130 kDa) or mature (100-kDa) T-cadherin. A, molecular structures of 130-kDa prodomain-bearing T-cad and 100-kDa T-cad and a conserved PCSK recognition site. B, schematic illustration of cell surface-expressed 130- and 100-kDa T-cad on F2 cells treated with Furin Inhibitor I (decanoyl-Arg-Val-Lys-Arg-chloromethyl ketone (decCMK)). 24-h serum-starved F2 cells were incubated with 5% WT mouse serum (the final adiponectin concentration was 0.67 μg/ml) for 1 h at 4 °C. C, a, representative immunoblot of whole cell lysate (4 μg of protein/lane) of F2 cells for T-cad, adiponectin (APN), and tubulin. Quantified signal intensities of T-cad 130 kDa (b), T-cad 100-kDa (c), total (130 + 100-kDa) T-cad (d), and APN (e). D, a, representative immunoblot of surface-biotinylated protein (isolated from 16 μg of whole cell lysate/lane) of F2 cells for T-cad and APN. The ratio of 130 kDa T-cad to total (130 + 100-kDa) T-cad was calculated (b), and APN bound on the cell surface was normalized with total T-cad (right panel) (c). All the data points were shown as scatter plots with the mean ± S.E. n = 4 for each group, Student's t test. ***, p < 0.001; **, <0.01; *, <0.05; n.s., not significant.
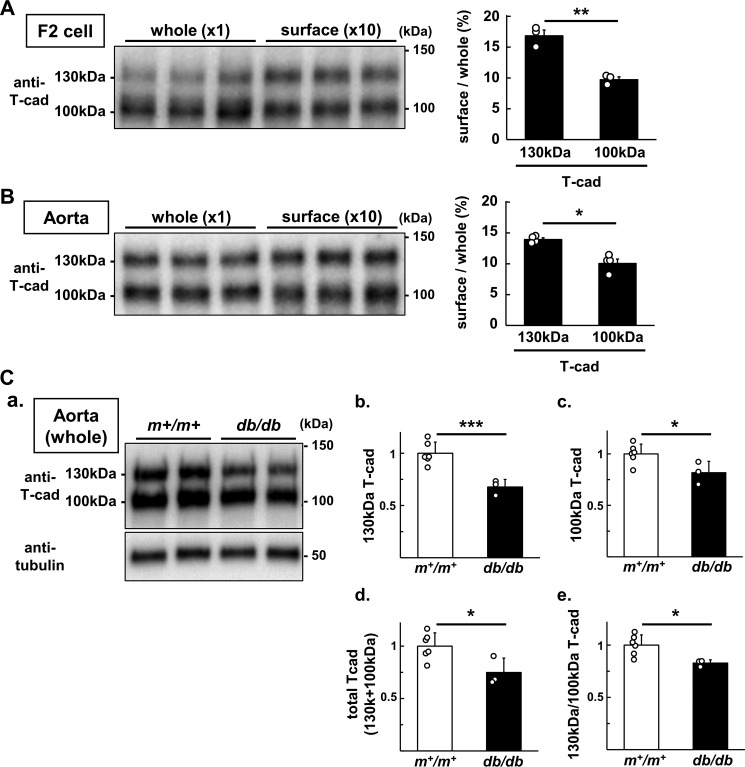
Next, we compared the cell surface localization of 130-kDa T-cadherin and 100-kDa T-cadherin after biotinylation of cell surface T-cadherin on endothelial cells cultured in the presence of normal mouse serum (Fig. 8A). Biotinylated endothelial cell surface-localized T-cadherin was analyzed together with T-cadherin in whole cell lysate by Western blotting (Fig. 8A), and the percentage of cell surface-localized T-cadherin was expressed relative to that of T-cadherin in whole cell lysate. The 130-kDa T-cadherin was preferentially localized on the endothelial cell surface compared with the 100-kDa T-cadherin (Fig. 8A). In another experiment, we biotinylated cell surface T-cadherin on the endothelium of mouse aorta in vivo (Fig. 8B) as described under “Experimental Procedures.” Although no detectable T-cadherin exists in subendothelial layer of the vessel wall, the aortic endothelium of normal WT mice contains a measurable amount of T-cadherin (11), where cell-impermeable biotinylation reagent can reach through infusion. Biotinylated endothelial cell surface-localized T-cadherin was analyzed along with T-cadherin in whole aorta lysate by Western blotting (Fig. 8B). Similar to F2 endothelial cells, 130-kDa T-cadherin showed preferential localization on endothelial cell surface compared with the 100-kDa T-cadherin (Fig. 8B). It would be important to see whether such differential regulation of different molecular weights of T-cadherin is also observed in an in vivo setting of obese and diabetic condition. We examined T-cadherin amounts in db/db mice comparing with their control m+/m+ mice (Fig. 8C). Interestingly, 130-kDa T-cadherin was more significantly decreased than 100-kDa T-cadherin in db/db mice compared with control m+/m+ mice (Fig. 8C).
Figure 8.
Presence of precursor (130 kDa) and mature (100 kDa) T-cadherin on the cell surface. A and B, representative immunoblot for whole cell and cell surface (biotinylated) T-cad of F2 cells incubated with 5% WT mouse serum for 24 h (A) and normal WT mouse aorta (B). B, T-cad on aortic endothelial surface was biotinylated in anesthetized normal WT mice using in vivo biotinylation protocol (see “Experimental procedures”). A and B, whole lysate and surface-biotinylated protein (isolated from a 10-fold amount of whole lysate) were analyzed (left panel). Signal intensities of 130- and 100-kDa T-cad were quantified and surface abundance ratios defined as cell surface/whole cell of each molecular weight of T-cad calculated (right panel). C, 130/100-kDa T-cadherin protein abundance in the aorta of m+/m+ and db/db mice. a, representative immunoblots for T-cadherin, APN, and α-tubulin for internal standard. b–e, relative intensity of 130-kDa T-cadherin (b), 100-kDa T-cadherin (c), total (130 + 100 kDa) T-cadherin (d), and 130 kDa/100 kDa ratio of T-cadherin (e) following normalization with α-tubulin. All the data points were shown as scatter plots with the mean ± S.E. (A and B) or the mean ± S.D. (C). n = 3 (A), n = 4 (B), n = 6 (C) for m+/m+ and n = 3 for db/db. Student's t test; ***, p < 0.001; **, p < 0.01; *, p < 0.05.
Discussion
Our study demonstrated that adiponectin binds to T-cadherin without the aid of any other cellular or serum components. A previous study using the expression cloning method identified the importance of T-cadherin for adiponectin binding to C2C12 myotubes (12). Subsequent studies on T-cadherin-deficient mice also reported the importance of T-cadherin in accumulation of adiponectin in muscle, heart, and aorta (9–11). However, whether T-cadherin directly binds adiponectin without the involvement of other factors, such as AdipoRs, another candidate receptor for adiponectin, remained unresolved. To explore this, we employed a recombinant IgGFc fusion construct of T-cadherin. Recombinant T-cadFc bound hexamer and larger HMW multimer adiponectin, both in normal mouse serum and in conditioned medium of HEK293 cells expressing recombinant adiponectin. Adiponectin appeared as a single major protein specifically bound to and released from T-cadFc by EDTA after application of WT mouse serum. These data indicate that adiponectin binds to T-cadherin without the involvement of any other cellular or serum components.
Numerous studies have elucidated the molecular mechanism(s) of the different effects of adiponectin as its identification in fat cDNA by our group and other investigators (24, 25). However, recombinant adiponectin, irrespective of its mammalian cell origin and although it contains much less HMW multimer adiponectin, has been widely used in previous studies. However, HMW multimer adiponectin has been increasingly recognized in many clinical studies as the active form of adiponectin (5–8). To our knowledge there is currently no simple method for the preparation of active multimeric adiponectin from serum. Here, we demonstrated that the use of T-cadherin, especially conjugation with IgG Fc, greatly simplified the purification procedure to obtain the natural active form of adiponectin.
Adiponectin binds to T-cadherin with single high affinity, and such binding requires the region encompassing EC1-EC2 of T-cadherin, overlapping the region reported for homophilic trans interaction of T-cadherin (22). It is reported that T-cadherin can trans dimerize through an interface near the EC1-EC2 calcium-binding sites (22). Our study showed that the same region extending from EC1 to EC2 is crucial for adiponectin binding. T-cadherin-mediated trans interaction was reproduced in the present study using a cell aggregation assay. Interestingly, the presence of adiponectin affected T-cadherin-mediated cell aggregation. In addition to the current knowledge on genomic association between SNPs around T-cadherin gene and plasma adiponectin levels and cardiovascular disease, future genome-wide next-generation sequencing covering the T-cadherin-coding sequence will address this region as important for determining plasma adiponectin level and risk for cardiovascular disease in human subjects.
All other cadherins homophilically interact and regulate cell-cell junctions, and no such heterologous binding with a secreted ligand is reported on cadherins except for T-cadherin with adiponectin. The reason for the unique interaction of T-cadherin with adiponectin may provide important clues for understanding the physiological roles of adiponectin and T-cadherin. In addition to the unique structural feature of T-cadherin among classical cadherins (i.e. having GPI-anchor instead of transmembrane and cytosolic regions), it is reported that ectopic overexpression of T-cadherin results in unique expression of prodomain-containing T-cadherin on the cell surface (21). Structural analysis suggested that the prodomain of classical cadherins are distant relatives of cadherin adhesive domains but lack all the features important for cadherin-cadherin interactions (20). Here, our study establishes that naturally expressed 130-kDa prodomain-bearing T-cadherin is preferentially expressed on the cell surface compared with the so-called mature form (100-kDa), both in in vitro endothelial cells and in in vivo aortic endothelial cells, where T-cadherin gene is abundantly expressed. The 130-kDa prodomain-containing T-cadherin binds more adiponectin with higher affinity compared with the 100-kDa prodomain-free T-cadherin, as demonstrated by the surface plasmon assay and in endothelial cells. Furthermore, adiponectin increased the expression of 130-kDa T-cadherin more predominantly than 100-kDa T-cadherin both in vitro and in vivo. Such differential regulation of different molecular weight of T-cadherin was also observed in the aorta of the obese and diabetic mouse model. Collectively, we have demonstrated a feed-forward regulation of T-cadherin protein by adiponectin in which the unique prodomain of T-cadherin plays a key role in adiponectin binding and membrane localization.
Experimental procedures
Animals
C57BL/6J (wild type), m+/m+, and db/db mice were purchased from CLEA Japan. Adiponectin knock-out mice were generated as described previously from C57BL/6 background (26). In all experiments, 12–14-week-old male mice were anesthetized with an intraperitoneal injection of a mixture of medetomidine (0.3 mg/kg body weight), midazolam (4 mg/kg body weight), and butorphanol tartrate (5 mg/kg body weight), sacrificed, and their tissues harvested for analysis. The experimental protocol was approved by the Ethics Review Committee for Animal Experimentation of Osaka University School of Medicine and also conforms to the Guide for the Care and Use of Laboratory Animals published by the United States National Institutes of Health.
Construction of plasmids
General PCR techniques were used for the construction of plasmids. All primers were purchased from GeneDesign, Inc. The full-length of mouse adiponectin and T-cadherin were amplified from total cDNA of C57BL/6J mouse epididymal white adipose tissue and heart, respectively. Each amplified fragment was cloned into pcDNA3.1(+) and used as a template. The ranges of amino acid sequences for each T-cadherin domain based on NCBI reference sequence NP_062681.2 were defined as follows: for signal peptide (residues 1–22), prodomain (23–138), EC1 (145–241), EC2 (249–359), EC3 (367–473), EC4 (488–581), EC5 (589–680), and GPI-anchoring domain (694–714). Expression vectors for Fc-fused (pFUSE-hIgG1Fc (InvivoGen) backbone) or GPI-anchoring (pcDNATM3.1(+) (Invitrogen) backbone) T-cadherin mutants were designed for inserting fragments between AgeI and XhoI sites.
Cell culture, transfection, and recombinant protein expression
CHO, HEK293, and mouse vascular endothelial F-2 cells (27), obtained from Riken Cell Bank, were maintained in DMEM with 10% FBS, 100 units/ml penicillin, and 100 μg/ml streptomycin at 37 °C in a humidified atmosphere of 5% CO2. For recombinant T-cadFc or adiponectin expression, HEK293 cells were grown to subconfluence in 10-cm dishes, transfected with 4 μg/dish of endotoxin-free plasmids by Lipofectamine2000TM (Invitrogen) according to the instructions provided by the manufacturer. Then, 24 h after transfection, the cells were washed gently with PBS(−) and cultured with serum-free DMEM for 24 h. The medium was harvested, filtered with 0.45-μm Durapore Millex-HVTM PVDF Syringe filter unit (Merck Millipore), and frozen at −80 °C until just before use. The concentration of each mutant T-cadFc was quantified by immunoblotting and compared with “full” T-cadFc (residues 1–693), which was purified with Protein G and quantified by CBB staining in advance. For recombinant adiponectin, the filtered medium was concentrated, and buffer was exchanged with PBS(−) using CentriconTM Plus-70 (Merck Millipore). The concentrations of recombinant adiponectin in the samples were measured using the mouse adiponectin ELISA kit (Otsuka Pharmaceutical Co).
SDS-PAGE and immunoblotting
CBB Stain One SuperTM (Nacalai tesque) or EzStain SilverTM (Atto Corp.) was used according to the instructions supplied by the manufacturer. The antibodies and the dilutions used in this study were as follows: goat anti-Acrp30 (R&D Systems, 1:2,000), goat anti-human cadherin13 (R&D systems, 1:2,000), rabbit anti-α-tubulin (Cell Signaling, 1:1,000), ZymaxTM rabbit anti-goat IgG (H+L) HRP conjugate (Invitrogen, 1:10,000), and ECL Anti-Rabbit IgG, HRP linked whole antibody from donkey (GE Healthcare, 1:10,000).
Protein G-based capture assay of adiponectin binding to T-cadFc
About 40 μl of Protein G-Sepharose 4 Fast FlowTM (GE Healthcare) was washed and equilibrated with binding buffer (50 mm Tris-HCl, pH 7.4, 150 mm NaCl, 1 mm CaCl2, 0.1 mm MgCl2, 0.1% Triton X-100, and 0.1% NaN3). The same molar quantity of mutant T-cadFc (2 pmol) was mixed with resin and incubated overnight at 4 °C. After discarding the supernatant and washing 3 times with binding buffer, 100 μl of 5% mouse serum or 1–2 μg/ml of recombinant adiponectin (“input” fraction) diluted with binding buffer was mixed, and the mixture was incubated overnight at 4 °C. The supernatant was collected as “free” fraction. After triplicate washing with binding buffer, the resin was incubated with 100 μl of 10 mm EDTA for 5 min at room temperature. The eluate was collected as the “bound” fraction.
Purification of adiponectin with T-cadFc from mouse serum
Adenovirus expressing full-length mouse adiponectin (Ad-adiponectin) was purified using the Adenovirus Standard Purification VirakitTM (Virapur). Ad-adiponectin was injected at 2.0 × 10⁹ plaque-forming units/mouse via the tail vein in adiponectin-KO mice. Blood samples were collected from mice at day 4 post-injection, and serum adiponectin levels were measured by ELISA. The resultant serum rich in high molecular multimeric adiponectin was applied to full T-cadFc entrapped on HiTrapTM Protein G-Sepharose (GE Healthcare). After extensive washing with binding buffer, adiponectin was eluted with 5 mm EDTA and buffer-exchanged with PBS(+).
Gel filtration chromatography
Two milligram of purified adiponectin in PBS(+) was separated by HiLoadTM 16/60 SuperdexTM 200 pg gel-filtration column (GE Healthcare) equipped to AKTATM FPLC (GE Healthcare) at a flow rate of 0.8 ml/min. Each 1-ml fraction was collected and analyzed.
Surface plasmon resonance (SPR) analysis
The experiments were performed using BIACORETM T200 with a Series S Sensor Chip CM5 (GE Healthcare). Anti-human IgG-Fc antibody was immobilized over all four flow cells using the Human Antibody Capture KitTM (GE Healthcare) according to the instructions supplied by the manufacturer. The immobilization level of anti-human IgG-Fc antibody ranged from 4000 to 5000 response units. All assays were performed at 25 °C in running buffer (the composition was similar to that of the binding buffer used in T-cadFc capture assay) at a flow rate of 30 μl/min. Roughly identical amounts of mutant T-cad Fc (1 fmol/mm2) were captured over flow cells 2, 3, or 4, immobilized anti-human IgG-Fc antibody. Flow cell 1, which captured signal sequence alone fused with IgGFc, was used as a reference for all mutant T-cadFc assays. For kinetics assay, 333, 111, 33, 11, 3.3, and 1.1 nm (trimer adiponectin equivalent) of purified adiponectin were diluted with running buffer and injected over all 4 flow cells for 2 min. After 4 min of dissociation time, 10 mm EDTA was injected for 30 s to remove adiponectin-bound to T-cadFc. The captured T-cadFc level did not change throughout the kinetics assay. The results of these assays were analyzed using BIACORETM T200 evaluation software v1.0 and BIACORETM T200 Kinetics Summary Software v1.0 (GE Healthcare). The ka/kd values were calculated assuming a 1:1 binding model.
Cell aggregation assay
“Short-term” aggregation experiments were performed basically as described previously (28). CHO cells were transfected with control or full-length T-cadherin expressing plasmid 24 h before the assay. Cells were dislodged using Cell Dissociation Solutions (Sigma) to preserve surface proteins without enzymatic modification and resuspended in Hanks' balanced salt solution(−) (Nacalai tesque) with 1% BSA in the presence (5 mm CaCl2) or absence (1 mm EGTA) of Ca2+. The suspended cells (1–2 × 10⁵ cells) were incubated at 37 °C for 40 min in 24-well plates with orbital shaking. 10% wild-type mouse serum or adiponectin knock-out mouse serum was included to evaluate the effect of adiponectin. Cell aggregation was evaluated as the particle area in four independent low-power fields using ImageJ software version 1.51j (United States National Institutes of Health) according to the method described previously (29).
Cell surface protein biotinylation in vitro and in vivo
Cell surface protein biotinylation and subsequent isolation were carried by using Cell Surface Biotinylation KitTM (Pierce) according to the instructions provided by the manufacturer. C57BL/6J WT mice (12 weeks old) were anesthetized, and whole blood was collected via the inferior vena cava. The mice were kept on ice in the following procedures. Ice-cold PBS(+) was infused through the left ventricle for 30 min at 2.5 ml/min to drain off blood proteins, and cell surface biotinylation reagent Sulfo-NHS-LC-SS-Biotin (Pierce) dissolved (0.25 mg/ml) in PBS(+) was infused for 20 min at 2.5 ml/min. Tissues were dissected from mice kept on ice and snap frozen in liquid nitrogen.
Statistical analysis
Values are expressed as the mean ± S.E. Differences between variables were compared by Student's t test or Tukey-Kramer's test. The probability (P) values of <0.05 were considered statistically significant. All statistical analyses were performed with the JMP Pro 11.2.0 for Windows (SAS Institute).
Author contributions
S. F. and S. K. designed the research protocol, performed the biochemical, cellular, and in vivo experiments, analyzed the data, and co-wrote the manuscript. Y. O., Y. F., H. Nagao, S. M., and Y. T. performed some animal experiments and contributed to discussions. H. Nishizawa, T. F., and N. M. assisted with experiments and provided input on research design. J. T. oversaw molecular binding analysis and provided input on research design. S. K. and I. S. directed the research and co-wrote the paper with assistance from all other authors.
Supplementary Material
Acknowledgments
We thank the staff of the Center of Medical Research and Education, Graduate School of Medicine Osaka University, for excellent technical support.
This work was supported in part by Grant-in-aid for Scientific Research (C) 16K09802 (to S. K.), Grant-in-aid for Scientific Research (C) 16K09801 (to N. M.) and Grant-in-aid for Scientific Research (B) 15H04853 (to I. S.) and, grants from Takeda Science Foundation (to N. M.), Japan Foundation for Applied Enzymology (to Y. F.), Core Research for Evolutional Science and Technology (CREST), and Japan Science and Technology Agency (JST) (to I. S.). The authors declare that they have no conflicts of interest with the contents of this article.
This article contains supplemental Fig. S1.
- HMW
- high molecular weight
- T-cad
- T-cadherin
- T-cadFc
- human IgG Fc fusion protein of T-cadherin
- GPI
- glycosylphosphatidylinositol
- EC
- extracellular cadherin repeat
- PCSK
- prohormone convertase
- SNP
- single nucleotide polymorphism
- CBB
- Coomassie Brilliant Blue
- SPR
- surface plasmon resonance.
References
- 1. Pajvani U. B., Du X., Combs T. P., Berg A. H., Rajala M. W., Schulthess T., Engel J., Brownlee M., and Scherer P. E. (2003) Structure-function studies of the adipocyte-secreted hormone Acrp30/adiponectin. Implications for metabolic regulation and bioactivity. J. Biol. Chem. 278, 9073–9085 [DOI] [PubMed] [Google Scholar]
- 2. Waki H., Yamauchi T., Kamon J., Ito Y., Uchida S., Kita S., Hara K., Hada Y., Vasseur F., Froguel P., Kimura S., Nagai R., and Kadowaki T. (2003) Impaired multimerization of human adiponectin mutants associated with diabetes: molecular structure and multimer formation of adiponectin. J. Biol. Chem. 278, 40352–40363 [DOI] [PubMed] [Google Scholar]
- 3. Tsao T. S., Tomas E., Murrey H. E., Hug C., Lee D. H., Ruderman N. B., Heuser J. E., and Lodish H. F. (2003) Role of disulfide bonds in Acrp30/adiponectin structure and signaling specificity: different oligomers activate different signal transduction pathways. J. Biol. Chem. 278, 50810–50817 [DOI] [PubMed] [Google Scholar]
- 4. Radjainia M., Wang Y., and Mitra A. K. (2008) Structural polymorphism of oligomeric adiponectin visualized by electron microscopy. J. Mol. Biol. 381, 419–430 [DOI] [PubMed] [Google Scholar]
- 5. Hara K., Horikoshi M., Yamauchi T., Yago H., Miyazaki O., Ebinuma H., Imai Y., Nagai R., and Kadowaki T. (2006) Measurement of the high-molecular weight form of adiponectin in plasma is useful for the prediction of insulin resistance and metabolic syndrome. Diabetes Care 29, 1357–1362 [DOI] [PubMed] [Google Scholar]
- 6. Inoue T., Kotooka N., Morooka T., Komoda H., Uchida T., Aso Y., Inukai T., Okuno T., and Node K. (2007) High molecular weight adiponectin as a predictor of long-term clinical outcome in patients with coronary artery disease. Am. J. Cardiol. 100, 569–574 [DOI] [PubMed] [Google Scholar]
- 7. Hirose H., Yamamoto Y., Seino-Yoshihara Y., Kawabe H., and Saito I. (2010) Serum high-molecular-weight adiponectin as a marker for the evaluation and care of subjects with metabolic syndrome and related disorders. J. Atheroscler. Thromb. 17, 1201–1211 [DOI] [PubMed] [Google Scholar]
- 8. Basu R., Pajvani U. B., Rizza R. A., and Scherer P. E. (2007) Selective downregulation of the high molecular weight form of adiponectin in hyperinsulinemia and in type 2 diabetes: differential regulation from nondiabetic subjects. Diabetes 56, 2174–2177 [DOI] [PubMed] [Google Scholar]
- 9. Denzel M. S., Scimia M. C., Zumstein P. M., Walsh K., Ruiz-Lozano P., and Ranscht B. (2010) T-cadherin is critical for adiponectin-mediated cardioprotection in mice. J. Clin. Invest. 120, 4342–4352 [DOI] [PMC free article] [PubMed] [Google Scholar]
- 10. Parker-Duffen J. L., Nakamura K., Silver M., Kikuchi R., Tigges U., Yoshida S., Denzel M. S., Ranscht B., and Walsh K. (2013) T-cadherin is essential for adiponectin-mediated revascularization. J. Biol. Chem. 288, 24886–24897 [DOI] [PMC free article] [PubMed] [Google Scholar]
- 11. Matsuda K., Fujishima Y., Maeda N., Mori T., Hirata A., Sekimoto R., Tsushima Y., Masuda S., Yamaoka M., Inoue K., Nishizawa H., Kita S., Ranscht B., Funahashi T., and Shimomura I. (2015) Positive feedback regulation between adiponectin and T-cadherin impacts adiponectin levels in tissue and plasma of male mice. Endocrinology 156, 934–946 [DOI] [PMC free article] [PubMed] [Google Scholar]
- 12. Hug C., Wang J., Ahmad N. S., Bogan J. S., Tsao T. S., and Lodish H. F. (2004) T-cadherin is a receptor for hexameric and high-molecular-weight forms of Acrp30/adiponectin. Proc. Natl. Acad. Sci. U.S.A. 101, 10308–10313 [DOI] [PMC free article] [PubMed] [Google Scholar]
- 13. Hulpiau P., and van Roy F. (2009) Molecular evolution of the cadherin superfamily. Int. J. Biochem. Cell Biol. 41, 349–369 [DOI] [PubMed] [Google Scholar]
- 14. Chung C. M., Lin T. H., Chen J. W., Leu H. B., Yang H. C., Ho H. Y., Ting C. T., Sheu S. H., Tsai W. C., Chen J. H., Lin S. J., Chen Y. T., and Pan W. H. (2011) A genome-wide association study reveals a quantitative trait locus of adiponectin on CDH13 that predicts cardiometabolic outcomes. Diabetes 60, 2417–2423 [DOI] [PMC free article] [PubMed] [Google Scholar]
- 15. Fava C., Danese E., Montagnana M., Sjögren M., Almgren P., Guidi G. C., Hedblad B., Engström G., Lechi A., Minuz P., and Melander O. (2011) A variant upstream of the CDH13 adiponectin receptor gene and metabolic syndrome in Swedes. Am. J. Cardiol. 108, 1432–1437 [DOI] [PubMed] [Google Scholar]
- 16. Gao H., Kim Y. M., Chen P., Igase M., Kawamoto R., Kim M. K., Kohara K., Lee J., Miki T., Ong R. T., Onuma H., Osawa H., Sim X., Teo Y. Y., Tabara Y., Tai E. S., and van Dam R. M. (2013) Genetic variation in CDH13 is associated with lower plasma adiponectin levels but greater adiponectin sensitivity in East Asian populations. Diabetes 62, 4277–4283 [DOI] [PMC free article] [PubMed] [Google Scholar]
- 17. Jee S. H., Sull J. W., Lee J. E., Shin C., Park J., Kimm H., Cho E. Y., Shin E. S., Yun J. E., Park J. W., Kim S. Y., Lee S. J., Jee E. J., Baik I., Kao L., Yoon S. K., Jang Y., and Beaty T. H. (2010) Adiponectin concentrations: a genome-wide association study. Am. J. Hum. Genet. 87, 545–552 [DOI] [PMC free article] [PubMed] [Google Scholar]
- 18. Wu Y., Li Y., Lange E. M., Croteau-Chonka D. C., Kuzawa C. W., McDade T. W., Qin L., Curocichin G., Borja J. B., Lange L. A., Adair L. S., and Mohlke K. L. (2010) Genome-wide association study for adiponectin levels in Filipino women identifies CDH13 and a novel uncommon haplotype at KNG1-ADIPOQ. Hum. Mol. Genet. 19, 4955–4964 [DOI] [PMC free article] [PubMed] [Google Scholar]
- 19. Morisaki H., Yamanaka I., Iwai N., Miyamoto Y., Kokubo Y., Okamura T., Okayama A., and Morisaki T. (2012) CDH13 gene coding T-cadherin influences variations in plasma adiponectin levels in the Japanese population. Hum. Mutat. 33, 402–410 [DOI] [PubMed] [Google Scholar]
- 20. Koch A. W., Farooq A., Shan W., Zeng L., Colman D. R., and Zhou M. M. (2004) Structure of the neural (N-) cadherin prodomain reveals a cadherin extracellular domain-like fold without adhesive characteristics. Structure 12, 793–805 [DOI] [PubMed] [Google Scholar]
- 21. Ranscht B., and Dours-Zimmermann M. T. (1991) T-cadherin, a novel cadherin cell adhesion molecule in the nervous system lacks the conserved cytoplasmic region. Neuron 7, 391–402 [DOI] [PubMed] [Google Scholar]
- 22. Ciatto C., Bahna F., Zampieri N., VanSteenhouse H. C., Katsamba P. S., Ahlsen G., Harrison O. J., Brasch J., Jin X., Posy S., Vendome J., Ranscht B., Jessell T. M., Honig B., and Shapiro L. (2010) T-cadherin structures reveal a novel adhesive binding mechanism. Nat. Struct. Mol. Biol. 17, 339–347 [DOI] [PMC free article] [PubMed] [Google Scholar]
- 23. Joshi M. B., Kyriakakis E., Pfaff D., Rupp K., Philippova M., Erne P., and Resink T. J. (2009) Extracellular cadherin repeat domains EC1 and EC5 of T-cadherin are essential for its ability to stimulate angiogenic behavior of endothelial cells. FASEB J. 23, 4011–4021 [DOI] [PubMed] [Google Scholar]
- 24. Maeda K., Okubo K., Shimomura I., Funahashi T., Matsuzawa Y., and Matsubara K. (1996) cDNA cloning and expression of a novel adipose specific collagen-like factor, apM1 (AdiPose Most abundant Gene transcript 1). Biochem. Biophys. Res. Commun. 221, 286–289 [DOI] [PubMed] [Google Scholar]
- 25. Scherer P. E., Williams S., Fogliano M., Baldini G., and Lodish H. F. (1995) A novel serum protein similar to C1q, produced exclusively in adipocytes. J. Biol. Chem. 270, 26746–26749 [DOI] [PubMed] [Google Scholar]
- 26. Maeda N., Shimomura I., Kishida K., Nishizawa H., Matsuda M., Nagaretani H., Furuyama N., Kondo H., Takahashi M., Arita Y., Komuro R., Ouchi N., Kihara S., Tochino Y., Okutomi K., Horie M., Takeda S., Aoyama T., Funahashi T., and Matsuzawa Y. (2002) Diet-induced insulin resistance in mice lacking adiponectin/ACRP30. Nat. Med. 8, 731–737 [DOI] [PubMed] [Google Scholar]
- 27. Toda K., Tsujioka K., Maruguchi Y., Ishii K., Miyachi Y., Kuribayashi K., and Imamura S. (1990) Establishment and characterization of a tumorigenic murine vascular endothelial cell line (F-2). Cancer Res. 50, 5526–5530 [PubMed] [Google Scholar]
- 28. Patel S. D., Ciatto C., Chen C. P., Bahna F., Rajebhosale M., Arkus N., Schieren I., Jessell T. M., Honig B., Price S. R., and Shapiro L. (2006) Type II cadherin ectodomain structures: implications for classical cadherin specificity. Cell 124, 1255–1268 [DOI] [PubMed] [Google Scholar]
- 29. Bassagañas S., Carvalho S., Dias A. M., Pérez-Garay M., Ortiz M. R., Figueras J., Reis C. A., Pinho S. S., and Peracaula R. (2014) Pancreatic cancer cell glycosylation regulates cell adhesion and invasion through the modulation of α2β1 integrin and E-cadherin function. PLoS ONE 9, e98595. [DOI] [PMC free article] [PubMed] [Google Scholar]
Associated Data
This section collects any data citations, data availability statements, or supplementary materials included in this article.


