

ABSTRACT
Background: Endothelial cells are known to contribute to kidney fibrosis via endothelial–mesenchymal transition (EndoMT). Matrix metalloproteinase 9 (MMP-9) is known to be profibrotic. However, whether MMP-9 contributes to kidney fibrosis via EndoMT is unknown.
Methods: Primary mouse renal peritubular endothelial cells (MRPECs) were isolated and treated by recombinant human transforming growth factor beta 1 (rhTGF-β1) with or without MMP-9 inhibitor or by recombinant human MMP-9 (rhMMP-9) alone. Kidney fibrosis was induced by unilateral ureteral obstruction (UUO) in MMP-9 knockout (KO) and wide-type (WT) control mice. The effects of MMP-9 on EndoMT of MRPECs and kidney fibrosis were examined.
Results: We showed that MRPECs underwent EndoMT after rhTGF-β1 treatment or in UUO kidney as evidenced by decreased expression of endothelial markers, vascular endothelial cadherin (VE-cadherin) and CD31, and increased levels of mesenchymal markers, α-smooth muscle actin (α-SMA) and vimentin. The expression of fibrosis markers was also up-regulated significantly after rhTGF-β1 treatment in MRPECs. The EndoMT and fibrosis markers were significantly less in rhTGF-β1-treated MMP-9 KO MRPECs, whereas MMP-9 alone was sufficient to induce EndoMT in MRPECs. UUO kidney of MMP-9 KO mice showed significantly less interstitial fibrosis and EndoMT in MRPECs. Notch signaling shown by Notch intracellular domain (NICD) was increased, while Notch-1 was decreased in rhTGF-β1-treated MRPECs of MMP-9 WT but not MMP-9 KO mice. Inhibition of MMP-9 or Notch signaling prevented rhTGF-β1- or rhMMP-9-induced α-SMA and NICD upregulation in MRPECs. UUO kidney of MMP-9 KO mice had less staining of Notch signaling transcription factor Hey-1 in VE-cadherin-positive MRPECs than WT controls.
Conclusions: Our results demonstrate that MMP-9-dependent Notch signaling plays an important role in kidney fibrosis through EndoMT of MRPECs.
Keywords: endothelial–mesenchymal transition, kidney fibrosis, Matrix metalloproteinase 9, Notch, peritubular endothelial cells
INTRODUCTION
Kidney fibrosis is a hallmark of chronic kidney disease. It is characterized by the accumulation of myofibroblasts and excessive deposition of extracellular matrix components. Myofibroblasts are the key effectors in the development and progression of kidney fibrosis. The cellular origins of myofibroblasts are diverse, including resident fibroblasts, fibrocytes from bone marrow, pericytes and perivascular fibroblasts [1–4]. Importantly, renal endothelial cells have been shown to contribute to kidney fibrosis via endothelial–mesenchymal transition (EndoMT) [2, 3, 5].
Matrix metalloproteinase 9 (MMP-9), also known as gelatinase B, has been proven by us and others to cause kidney fibrosis [6, 7]. We have demonstrated that MMP-9 induced epithelial-mesenchymal transition (EMT) in rat proximal tubular epithelial (NRK52E) cells downstream of TGF-β1 and that MMP-9 of macrophage origin is responsible for TGF-β1-induced EMT in murine tubular epithelial (C1.1) cells [6, 7]. Recently, we found that MMP-9 also induced EndoMT in human glomerular endothelial cells (unpublished data), but the underlying mechanisms remains unknown.
EndoMT occurs during organ development, and under pathological conditions such as cardiac and pulmonary fibrosis, and during the recruitment of carcinoma-associated fibroblasts [8–11]. EndoMT is characterized by down-regulation of cell–cell contact and endothelial markers including CD31 and vascular endothelial cadherin (VE-cadherin), and up-regulation of mesenchymal markers such as fibroblast-specific protein (FSP-1) and α-smooth muscle actin (α-SMA) [12]. LeBleu et al. showed that ∼10% of interstitial myofibroblasts expressed markers of both endothelial cells and activated fibroblasts in lineage-tagged transgenic mice after unilateral ureteral obstruction (UUO) [5]. Zeisberg and colleagues reported that 30–50% of myofibroblasts in kidney fibrosis co-expressed the endothelial marker CD31 and the fibroblast/myofibroblast markers FSP-1 and/or α-SMA [13]. However, the exact origin of the endothelial cells (glomerular, peritubular or vascular) is uncertain, and the mechanisms and signaling pathways that control EndoMT are largely unknown.
Notch signaling is a highly conserved pathway that regulates cell fate. Notch proteins including Notch-1 to -4, and their ligands Jagged-1, 2 and Delta like (Dll)-1, 3 and 4, are all transmembrane proteins [14]. Upon ligand binding, Notch intracellular domain (NICD) is released by proteolytic cleavage via presenilin-/gamma-secretase [15], and translocates to the nucleus. Once in the nucleus, NICD converts the transcription repressor CSL [CBF1/Su(H)/lag2] to a transcription activator, which promotes the expression of a set of target genes including HES and HERP [16]. The Notch signaling pathway has been shown to act downstream of vascular endothelial growth factor (VEGF) signaling to regulate the morphogenesis of endothelial cells by activating specific MMPs [17]. In addition, activation of Notch in endothelial cells results in morphological, phenotypic and functional changes consistent with mesenchymal transformation [18]. Inhibition of Notch signaling by gamma-secretase inhibitor (GSI) ameliorates tubulointerstitial fibrosis in mouse models [19]. Moreover, silencing of Notch-1 protein leads to down-regulation and inactivation of VEGF and MMP-9, thereby inhibiting invasion and metastasis of pancreatic cancer cells [20]. However, the relationship between the Notch signaling pathway and MMPs in EndoMT and fibrosis is poorly understood.
The aim of this study was to investigate the contribution of MMP-9 to EndoMT of mouse renal peritubular endothelial cells (MRPECs) and kidney fibrosis, and the relationship between Notch signaling and MMP-9 in EndoMT.
MATERIALS AND METHODS
Animals and UUO
Male BALB/c mice ∼6 weeks old were purchased from the Australian Research Center (Perth, Australia). MMP-9 knockout (KO) mice crossed into a BALB/c background were kindly provided by Prof. Zena Werb of University of California via Prof. Erick Thompson of Melbourne University. Experiments were carried out in accordance with the protocols approved by the Animal Ethics Committee of Western Sydney Local Health District. Kidney fibrosis was induced by UUO as previously described [21]. Sham-operated mice underwent the same surgical procedure except for the ureteral ligation. A total of six mice were used in each control and experimental group. Kidneys were harvested at 2 weeks after UUO.
Cell culture and treatment
Primary MRPECs were isolated from kidneys as described previously [22], and cultured at 37°C in 5% CO2 in endothelial cell medium (ScienCell, Carlsbad, CA, USA) supplemented with 5% fetal bovine serum (ScienCell), 1% epithelial growth supplement (ScienCell) and 1% penicillin/streptomycin (ScienCell) and 2.5–5 µg/mL VEGF (Sigma-Aldrich, St Louis, MO, USA). MRPECs were cultured at low density in fibronectin pre-coated flasks or plates the day before treatment. The cells were then washed with phosphate-buffered saline (PBS) and cultured in serum-free endothelial cell medium with rhTGF-β1 (5 and 10 ng/mL; Invitrogen, Carlsbad, CA, USA) alone, with rhTGF-β1 and MMP-9 inhibitor I (0.05, 0.25 and 0.5 nmol/mL; Merck Chemicals, Darmstadt, Germany) [23], with recombinant human MMP-9 (rhMMP-9) (2 µg/mL; Biomol International, Plymouth Meeting, PA, USA), or rhTGF-β1 and GSI (0.05 and 0.1 nmol/mL).
Immunofluorescence analysis
Cells were seeded onto glass coverslips placed in 6-well plates and cultured until they reached 50–60% confluence. Cells were then washed with PBS and fixed with cold absolute methanol for 10 min at −20°C. Fixed cells were washed with PBS and blocked with 2% bovine serum albumin (BSA; Sigma-Aldrich) in PBS for 1 h at room temperature. Cells were then incubated with primary antibodies against endothelial cell marker rabbit polyclonal anti-VE-cadherin (1:200; Alexis Biochemicals, Farmingdale, NY, USA) and mesenchymal marker mouse monoclonal anti-α-SMA (1:200; Sigma-Aldrich) in 2% BSA in PBS for 1 h at room temperature. Secondary fluorescent-conjugated anti-rabbit Alexa Fluor® 488 (1:600; Invitrogen) was used for VE-cadherin and anti-mouse Alexa Fluor® 546 (1:600; Invitrogen) was used for α-SMA for 40 min at room temperature in dark, followed by washing in PBS and distilled water and counterstaining with 4′,6-diamidino-2-phenylindole (DAPI; Invitrogen) for 5 min. They were then washed in PBS and distilled water before mounting with fluorescence mounting medium (Dako, Glostrup, Denmark) for visualization by fluorescence microscopy. For antibody isotype controls, rabbit IgG2a κ purified (eBioscience, San Diego, CA, USA) was used for VE-cadherin staining and mouse IgG2a κ (Biolegend, San Diego, CA, USA) was used for α-SMA staining, and their corresponding secondary antibodies were applied.
For tissue staining, frozen blocks from kidney were cut into 5 µm sections and fixed with ice-cold acetone at −20°C for 10 min and blocked with 2% BSA for 1 h. Double immunofluorescence staining was performed using the following combinations of antibodies: VE-cadherin and α-SMA, Hey-1 (1:150; Abcam, Cambridge, UK) and α-SMA. Tissue sections were sequentially incubated with a single primary antibody followed by its corresponding fluorescence-conjugated secondary antibody. Tissue sections were washed three times with PBS between each staining and counterstained with DAPI for 5 min before mounting with the fluorescence mounting medium. Rabbit IgG (Invitrogen) was used as a negative control for Hey-1. Images were obtained using a fluorescence microscope (Zeiss, Jena, Germany) at ×200 magnification.
Western blot analysis
Protein lysates from equal numbers of cultured cells were obtained by Tris-glycine SDS sample buffer (Gradipore, Frenchs Forest, Australia) and homogenized by drawing five times through a 0.5 mL insulin syringe. Equal quantities of protein were loaded per lane on 12-well NuPAGE 4–15% Bris-Tris gels (Bio-Rad, Hercules, CA, USA) for electrophoresis under reduced conditions. After electrophoresis, the proteins were transferred onto polyvinylidene difluoride membrane (Bio-Rad) using Mini Trans-Blot Electrophoretic Transfer Cell (Bio-Rad). For immunodetection, membranes were blocked in 5% skim milk in PBS overnight at 4°C and incubated for 2 h at room temperature with primary antibodies prepared in blocking buffer: mouse monoclonal anti-α-SMA (1:300, Sigma-Aldrich), rabbit polyclonal anti-VE-cadherin (1:1000; Alexis Biochemicals), mouse monoclonal anti-CD31 (1:1000; Cell Signaling Technology, Boston, MA, USA), mouse monoclonal anti-NICD (1:1000; Merck Millipore, Billerica, MA, USA), rabbit monoclonal anti-Notch-1 (1:1000; Cell Signaling Technology), rabbit monoclonal anti-vimentin (1:1000; Cell Signaling Technology), mouse monoclonal anti-collagen I (Col-I) and goat polyclonal anti-fibronectin (FN1) antibody (1:200; Santa Cruz Biotechnology, Santa Cruz, CA, USA). The membranes were washed three times (10 min per wash on a rocking platform) and incubated for 1 h with their respective horseradish peroxidase (HRP)-conjugated secondary antibodies: goat anti-mouse HRP and goat anti-rabbit HRP (1:5000; Cell Signaling Technology). The membranes were washed three times (10 min per wash on a rocking platform) and bands were visualized with an enhanced chemiluminescence detection kit (Invitrogen). Mouse monoclonal anti-β-actin antibody (1:1000; Cell Signaling Technology) was used as the control for each sample.
Gelatin zymography
MMP-9 activity in a medium derived from rhTGF-β1-treated MRPECs was determined by gelatin zymography. Briefly, the medium was mixed with Tris-Glycine SDS Native Sample Buffer (1:1; Invitrogen) and electrophoresed through 10% Novex Zymogram Gelatin Gels (Invitrogen) with Tris-Glycine SDS Running Buffer (Invitrogen) under constant voltage of 125 V for 120 min. The gel was then incubated in Zymogram Renaturing Buffer (Invitrogen) for 30 min at room temperature with gentle agitation and washed with developing buffer (Invitrogen) for 30 min. The gel was further incubated for 24 h in fresh developing buffer at 37°C. After being developed, the gel was stained with 0.5% (w/v) Coomassie Blue R-250 (Bio-Rad) in 50% (v/v) methanol, 10% (v/v) acetic acid for 30 min at room temperature, and destained as described previously [24]. Gelatinolytic activity of MMP-9 was visualized as a clear band on a blue background. Band intensity was quantified by densitometry using the ImageJ software. Briefly, zymogram gels were scanned using Kodak Gel Logic 100 imaging system and processed into gray scale. Gray scale images were quantified densitometrically by the measurement of the mean intensity of positive band multiplied by its corresponding area. The optical band intensity was then corrected by subtracting the background intensity of equal area.
Histological analysis
Tissue sections were stained for fibrosis using Gomori trichrome. For histological quantitation, a minimum of 15 non-overlapping images of cortex were taken under ×200 magnification for each kidney unless otherwise specified, and quantitated in a blinded manner. Quantitation for Gomori trichrome staining was performed by a modified grid-counting method adapted from Vielhauer et al. [25].
Statistical analysis
Results from at least three independent experiments were expressed as means ± SEM. Statistical significance was evaluated using a two-tailed t-test for comparison between two groups, whereas one-way analysis of variance was used for the comparison of multiple groups. P < 0.05 was considered significant.
RESULTS
Peritubular endothelial cells undergo mesenchymal transition after UUO
To localize peritubular endothelial cells in mouse kidney tissue, we stained the specific endothelial cell marker VE-cadherin by immunofluorescence. As expected, the glomerular endothelial cells were stained positive (Figure 1A and C). Extensive VE-cadherin-positive cells were also found in the peritubular space in a normal kidney tissue (Figure 1A and C). To examine whether peritubular endothelial cells might contribute to fibrosis by EndoMT, we stained both VE-cadherin and α-SMA in the obstructed kidney of UUO mice. The results showed that VE-cadherin and α-SMA double positive cells were found in the peritubular capillary space outside the glomeruli (Figure 1F), indicating that EndoMT-derived myofibroblasts were localized within the peritubular interstitium and were distinct from other vascular endothelial cells by their histological location. These results provide direct evidence for the involvement of peritubular endothelial cells in EndoMT leading to kidney fibrosis.
FIGURE 1.

Peritubular endothelial cells exhibit EndoMT in mice with UUO. (A–C) Kidney sections from sham-operated mice were stained using an immunofluorescent antibody against VE-cadherin (A: green) to detect endothelial cells and an immunofluorescent antibody against α-SMA to detect myofibroblasts (B: red). (C) Overlay of VE-cadherin, α-SMA and nuclear staining DAPI (blue). (D–F) Kidney sections from mice with UUO were stained with VE-cadherin (D: green) and α-SMA (E: red). (F) Overlay of the VE-cadherin, α-SMA and DAPI (blue) staining. Orange staining indicated VE-cadherin and α-SMA double positive cells in peritubular space away from glomeruli. Original magnification ×200.
TGF-β1 induces EndoMT and fibrosis markers in MRPECs via MMP-9
To establish an in vitro model of peritubular EndoMT, subconfluent primary MRPECs isolated from mouse kidney were treated with rhTGF-β1 (5 and 10 ng/mL) for 24 h. These isolated primary MRPECs have been proved to be peritubular endothelial cells by staining of panendothelial cell antigen (PV-1) and other markers [22]. Endothelial marker CD31 and VE-cadherin as well as mesenchymal marker α-SMA and vimentin expression were determined by western blot. The expression of fibrosis markers, Col-I and FN was also detected by western blot analysis. We found that rhTGF-β1 at the concentration of 10 ng/mL significantly reduced CD31 and VE-cadherin proteins, while rhTGF-β1 at the concentration of both 5 and 10 ng/mL increased the expression of α-SMA and vimentin (Figure 2A). Immunofluorescence staining also demonstrated that 10 ng/mL rh-TGF-β1 treatment reduced VE-cadherin and increased α-SMA in MRPECs (Figure 2B). Accordingly, Col-I and FN expressions were markedly induced by rhTGF-β1 at both concentrations (Figure 2C). These results demonstrate that rhTGF-β1 is sufficient to induce EndoMT and fibrosis in MRPECs.
FIGURE 2.

MMP-9 is involved in TGF-β1-induced EndoMT in MRPECs. (A) Representative western blots and quantitation of CD31, α-SMA, VE-cadherin and vimentin in MRPECs treated with rhTGF-β1 (5 and 10 ng/mL). β-actin was used as the loading control. (B) Immunofluorescence staining of α-SMA (red) and VE-cadherin (green) with nuclear stain (DAPI, blue) in MRPECs treated with 10 ng/mL rhTGF-β1. Original magnification ×200. (C) Representative western blots and quantitation of Col-I and FN in MRPECs treated with rhTGF-β1 (5 and 10 ng/mL). β-actin was used as the loading control. (D) Representative western blots and quantitation of CD31, VE-cadherin and α-SMA in MRPECs treated or not with rh-TGF-β1 (10 ng/mL) and MMP-9 inhibitor I (0.05, 0.25 and 0.5 nmol/mL). (E) MMP-9 expression examined by gelatin zymography of lysate of MRPECs treated with rh-TGF-β1. Data in bar graphs are means ± SEM (n ≥ 3 for each group). *P < 0.05 versus MRPECs without rhTGF-β1 treatment. †P < 0.05 versus MRPECs treated with 10 ng/mL rhTGF-β1.
To test whether MMP-9 is involved in TGF-β1-induced EndoMT, MRPECs were treated with 10 ng/mL rhTGF-β1 alone or in the presence of increasing concentrations of MMP-9 inhibitor I for 24 h. We found that MMP-9 inhibitor I abolished rhTGF-β1-induced reduction of CD31 and VE-cadherin and the induction of α-SMA in a dose-dependent manner (Figure 2D). Furthermore, zymography showed that MMP-9 activity was increased after rhTGF-β1 treatment (Figure 2E). These results demonstrate that TGF-β1-induced EndoMT is mediated, at least in part, through MMP-9.
MMP-9 induces EndoMT and fibrotic markers in MRPECs
To determine whether MMP-9 contributes to EndoMT and fibrosis, we incubated subconfluent MRPECs with 2 µg/mL rhMMP-9 for 48 h and examined the expression of endothelial and mesenchymal markers as well as fibrotic markers by western blot and immunofluorescence staining. We showed that rhMMP-9 significantly decreased the levels of endothelial markers CD31 and VE-cadherin while increasing mesenchymal markers α-SMA and vimentin when compared with control MRPECs (Figure 3A and B). Consistently, immunofluorescence staining demonstrated that rhMMP-9 reduced VE-cadherin and increased α-SMA expression (Figure 3C). rhMMP-9 treatment also significantly up-regulated Col-I and FN expression (Figure 3D). Thus, MMP-9 alone is sufficient to induce EndoMT and fibrosis in MRPECs.
FIGURE 3.

rhMMP-9 alone induces EndoMT of MRPECs. (A) Representative CD31, VE-cadherin, α-SMA and vimentin expression in MRPECs treated with or without 2 µg/mL rhMMP-9 for 48 h measured by western blot. (B) Quantitation of CD31, VE-cadherin, α-SMA and vimentin expression in MRPECs treated with or without 2 µg/mL rhMMP-9 for 48 h. (C) Representative immunofluorescence staining of α-SMA (red) and VE-cadherin (green) with nuclear counter stain (DAPI, blue) of MRPECs treated with or without 2 µg/mL rhMMP-9 for 48 h. (D) Representative western blots and quantitation of Col-I and FN in MRPECs treated with or without 2 µg/mL rhMMP-9 for 48 h. Original magnification ×200. Data in bar graphs are means ± SEM (n ≥ 3 for each group). *P < 0.05 versus MRPECs without rhMMP-9 treatment.
TGF-β1-induced EndoMT is decreased in MMP-9-deficient MRPECs
To further examine the role of MMP-9 in EndoMT and fibrosis induced by TGF-β1 in MRPECs, MRPECs derived from MMP-9 KO and wild-type (WT) control mice were treated with 10 ng/mL rhTGF-β1. Western blot analysis showed that MMP-9 deficiency significantly attenuated rhTGF-β1-induced increase of α-SMA, Col-I and FN and decrease of CD31 and VE-cadherin (Figure 4A and B). Immunofluorescence staining confirmed that rhTGF-β1-induced EndoMT was significantly reduced in MMP-9 KO MRPECs compared with that of WT controls (Figure 4C). Interestingly, rhTGF-β1-induced EndoMT was accompanied by a dramatic increase of NICD and decrease of Notch-1 in WT MRPECs (Figure 4A and B). However, this TGF-β1-induced Notch signaling was reduced in MMP-9-deficient MRPECs (Figure 4A and B). These results suggest that the effect of MMP-9 on TGF-β1-induced EndoMT is achieved via the Notch pathway.
FIGURE 4.

TGF-β1-induced EndoMT and activation of Notch pathway are reduced in MMP-9-deficient MRPECs. (A) Representative western blots of CD31, VE-cadherin, α-SMA, NICD, Notch-1, Col-I and FN in MRPECs derived from MMP-9 KO mice or WT controls treated with or without 10 ng/mL rhTGF-β1 for 48 h. (B) Quantitation of CD31, VE-cadherin, α-SMA, NICD, Notch-1, Col-I and FN in MRPECs derived from MMP-9 KO mice or WT controls treated with or without 10 ng/mL rhTGF-β1 for 48 h. (C) Indirect immunofluorescence staining of VE-cadherin and α-SMA in primary MRPECs derived from MMP-9 KO mice or WT controls treated with or without 10 ng/mL TGF-β1 for 48 h. Original magnification ×200. Data in bar graphs are means ± SEM (n ≥ 3 for each group). *P < 0.05 versus corresponding MRPECs without rhTGF-β1 treatment. †P < 0.05 versus MRPECs derived from MMP-9 WT mice.
Inhibition of Notch attenuates rhMMP-9-induced EndoMT in MRPECs
To confirm that the Notch pathway is involved in MMP-9-induced EndoMT in MRPECs, a specific inhibitor of Notch signaling, GSI, was used. MRPECs were treated with 2 µg/mL rhMMP-9 with or without GSI (0.05 or 0.1 nM/mL). VE-cadherin, NICD and α-SMA expression were measured by western blot. GSI significantly inhibited rhMMP-9-induced NICD and α-SMA expression in a dose-dependent manner, whereas the levels of CD31 and VE-cadherin were not significantly altered (Figure 5A and B).
FIGURE 5.

Inhibition of Notch pathway by GSI reduces rhMMP-9-induced EndoMT in MRPECs. (A) Representative western blots of CD31, VE-cadherin, α-SMA and NICD expression in MRPECs treated with rhMMP-9 (2 μg/mL) alone or with GSI (0.05 or 0.1 nM/mL). (B) Quantitation of CD31, VE-cadherin, α-SMA and NICD in MRPECs treated with rhMMP-9 (2 μg/mL) alone or with GSI (0.05 or 0.1 nM/mL). Data in bar graphs are means ± SEM (n ≥ 3 for each group). *P < 0.05 versus MRPECs without rhMMP-9 treatment. †P < 0.05 versus MRPECs treated with rhMMP-9 only.
MMP-9 deficiency reduces EndoMT and fibrosis in UUO
We next explored the role of MMP-9 in kidney fibrosis using the UUO model in MMP-9 KO and WT control mice. EndoMT was examined by α-SMA/VE-cadherin double staining and kidney fibrosis was assessed by Gomori trichrome staining. After UUO, marked interstitial α-SMA expression (Figure 6B and E) and kidney fibrosis (Figure 6H and K) in obstructed kidneys were observed in MMP-9 WT mice. In contrast, UUO kidney of MMP-9 KO mice had considerably lower α-SMA levels (Figure 6D and E) [α-SMA positive area: 12.81 ± 1.30% (MMP-9 KO) versus 25.45 ± 4.42% (MMP-9 WT), P < 0.05] and interstitial fibrosis (Figure 6J and K) [5.66 ± 0.81% (MMP-9 KO) versus 25.20 ± 3.69% (MMP-9 WT), P < 0.05]. Importantly, there were significantly fewer peritubular α-SMA/VE-cadherin double positive EndoMT cells in the kidneys of MMP-9 KO mice (Figure 6D and F) than those of WT controls (Figure 6B and F) [14.78 ± 0.7362 (MMP-9 KO) versus 20.73 ± 1.622 (MMP-9 WT), P < 0.05]. These results demonstrate that MMP-9 deficiency contributes to an ∼30% reduction in total α-SMA-positive myofibroblasts arising from EndoMT of peritubular endothelial cells, with another 20% reduction from other sources.
FIGURE 6.
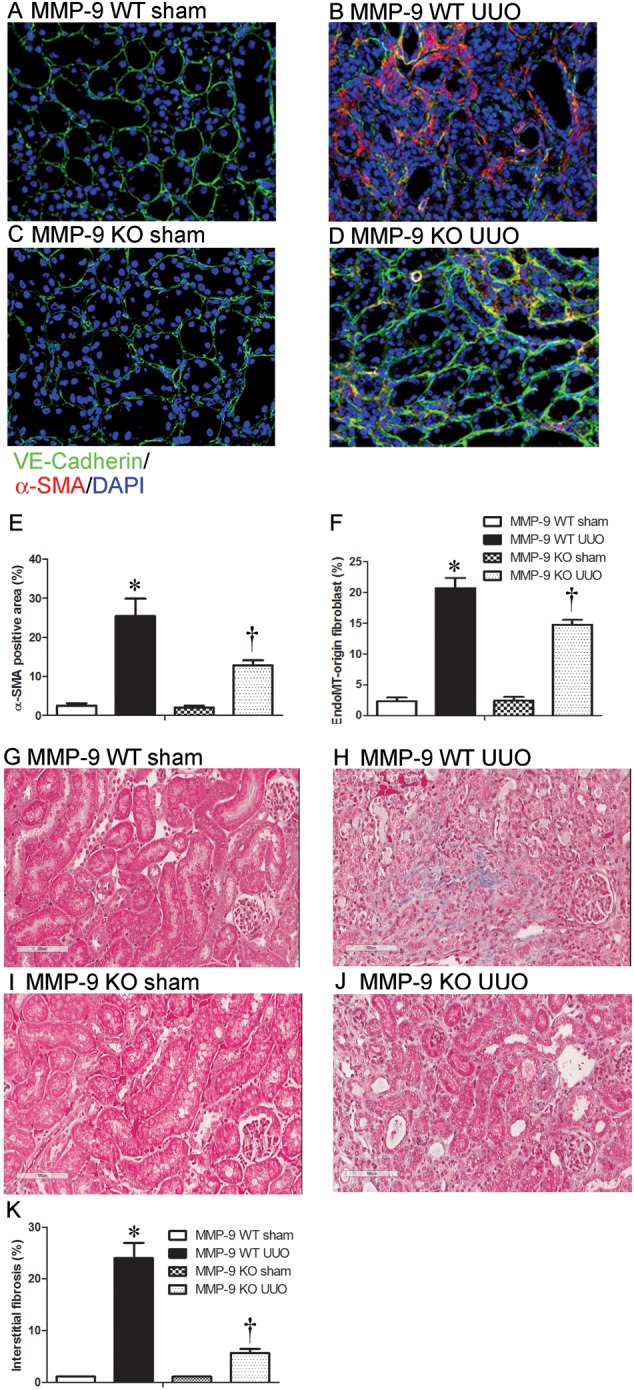
MMP-9 deficiency inhibits EndoMT and kidney fibrosis. (A–D) Co-localization of peritubular VE-cadherin (green) and α-SMA (red) in kidney sections from sham-operated kidney or UUO kidney of MMP-9 WT (A and B) or MMP-9 KO mice (C and D). (E and F) Quantitative analysis of α-SMA-positive area (E) and co-localization of VE-cadherin and α-SMA in kidney sections (F) from sham-operated or UUO kidneys of MMP-9 WT or MMP-9 KO mice. (G–J) Representative Gomori trichrome staining of kidney sections from sham-operated or UUO kidneys of MMP-9 WT (G and H) or MMP-9 KO (I and J) mice (Gomori trichrome, original magnification ×200). (K) Semiquantitative score of tubulointerstitial fibrosis in the cortex of kidney sections from sham-operated or UUO kidneys of MMP-9 WT or MMP-9 KO mice. Data in bar graphs are means ± SEM (n ≥ 3 for each group). *P < 0.05 versus corresponding sham-control mice. †P < 0.05 versus MMP-9 WT mice.
MMP-9 deficiency results in reduced expression of Hey-1 in UUO
Hey-1 is a downstream transcription factor of the Notch pathway. To further elucidate the relationship between MMP-9 and Notch signaling in kidney fibrosis, we determined the expression of Hey-1 in the obstructed kidneys of MMP-9 KO and WT control mice by immunofluorescence staining. In comparison with corresponding sham-controls, the expression of interstitial Hey-1 co-localized with α-SMA staining was increased significantly in the obstructed kidney of MMP-9 WT mice. However, no increase in Hey-1 expression was observed in the obstructed kidneys of MMP-9 KO mice (Figure 7). These results provide further evidence for the role of MMP-9 in mediating Notch signaling in kidney fibrosis.
FIGURE 7.

MMP-9 deficiency downregulates Hey-1 expression in UUO. Representative immunofluorescence staining and quantitation of Hey-1 (green) and α-SMA (red) and their tubulointerstitial co-localization with DAPI (blue) in sham-control and obstructed kidneys of MMP-9 WT or MMP-9 KO mice. Original magnification ×200. *P < 0.05 versus corresponding sham-control mice. †P < 0.05 versus MMP-9 WT mice.
DISCUSSION
MMP-9 is a zinc-dependent matrix-degrading enzyme with complex biological functions depending on its cellular origins and site of activity. We previously reported that MMP-9 of both tubular and macrophage origin was critical to TGF-β1-induced tubular cell EMT [6, 24]. It has been confirmed that MMP-9 is necessary for the disruption of epithelial cell basement membrane, a key step to complete the entire course of EMT [26]. Kidney endothelial cells that underwent EndoMT were recently demonstrated to play a more important role in kidney fibrosis than tubular cells or pericytes [5]. But the underlying molecular mechanism remains poorly defined. We hypothesized that MMP-9 may also play a role in EndoMT. Our results demonstrated that MMP-9 indeed mediates TGF-β1-induced EndoMT, via activation of the Notch pathway.
Kidney endothelial cells are found in vascular, glomerular and peritubular capillary beds. Although it has been generally accepted that endothelial cells contribute to myofibroblast formation in kidney fibrosis [13], the roles of the various kidney endothelial cells in kidney fibrosis are not clearly defined. Techniques for isolating glomerular endothelial cells are established [27, 28], but isolation of peritubular endothelial cells has not been described elsewhere. In this study, we isolated MRPECs by our recently established method [6], and investigated the roles of MRPECs in kidney fibrosis. We showed that co-localization of endothelial marker VE-cadherin with mesenchymal marker α-SMA in the kidneys of UUO mice was mainly found outside glomeruli (Figure 1F) in the tubulointerstitial space. These results demonstrated that peritubular endothelial cells do contribute to kidney fibrosis. We acknowledge that the co-staining of endothelial with mesenchymal markers in demonstrating EndoMT may underestimate the actual number of EndoMT cells, as endothelial markers are decreased and even lost during EndoMT.
Both MMP-9 and MMP-2 are expressed in endothelial cells of different organs [1]. However, our in vitro results showed that active MMP-9 was significantly increased (Figure 2D), while no MMP-2 activity was observed during TGF-β1-induced EndoMT in MRPECs (data not shown). rhMMP-9 alone was capable of inducing EndoMT in MRPECs. Importantly, MMP-9 inhibitor reduced TGF-β1-induced EndoMT of MRPECs in a dose-dependent manner (Figure 2C). These results suggest that MMP-9 but not MMP-2 contributes to EndoMT of peritubular endothelial cells.
Previously, we showed that the inhibition of MMP-9 activity by an MMP-2/9 inhibitor or MMP-9 neutralizing antibody prevented the development of kidney fibrosis [6]. Wang et al. also reported that ureteral obstruction in MMP-9-deficient mice led to a reduction in tubular cell EMT and hence a decrease in kidney fibrosis [29]. In addition to promoting EMT of tubular epithelial cells, our present in vivo study using MMP-9 KO mouse in UUO model clearly demonstrated that MMP-9 also promotes EndoMT of peritubular endothelial cells and thus contributes to kidney fibrosis (Figure 4A and C).
The Notch family is involved in the differentiation or pathological changes of various types of cells including kidney podocytes and tubular cells [30]. Notch signaling is markedly reduced in the adult kidney, however, increased Notch signaling has been noted in chronic kidney injury [30]. Inhibition of the Notch pathway ameliorated diabetic kidney disease, nephrotic syndrome and fibrosis in different rodent models [31]. Inhibition of Notch activation reduced EMT and consequent kidney fibrosis [31]. However, whether Notch signaling plays a role in EndoMT is unknown. In the present study, we showed that treatment of MRPECs with rhMMP-9 resulted in the cleavage of Notch-1 (Figure 4A and B). In addition, the activation of Notch-1 was significantly reduced during TGF-β1-induced EndoMT in MMP-9 deficiency (Figure 4A and B). In MRPECs, inhibition of the Notch pathway by GSI reduced rhMMP-9-induced EndoMT, whereas MMP-9 deficiency reduced expression of Hey-1, a downstream transcription factor of Notch signaling (Figure 7).
In summary, we found that MMP-9-dependent Notch signaling plays an important role in kidney fibrosis, at least partly through EndoMT of peritubular endothelial cells. Therefore, pharmacological inhibition of the MMP-9/Notch pathway may serve as an effective approach to prevent kidney fibrosis.
ACKNOWLEDGEMENTS
This work was supported by the National Health and Medical Research Council (NHMRC) Project Grants 632688 and 1046647. Funding to pay the Open Access publication charges for this article was provided by The Westmead Institute for Medical Research, The University of Sydney.
CONFLICT OF INTEREST STATEMENT
None declared.
REFERENCES
- 1. Gao H, Zhang J, Liu T et al. . Rapamycin prevents endothelial cell migration by inhibiting the endothelial-to-mesenchymal transition and matrix metalloproteinase-2 and -9: an in vitro study. Mol Vis 2011; 17: 3406–3414 [PMC free article] [PubMed] [Google Scholar]
- 2. Grgic I, Duffield JS, Humphreys BD. The origin of interstitial myofibroblasts in chronic kidney disease. Pediatr Nephrol 2012; 27: 183–193 [DOI] [PMC free article] [PubMed] [Google Scholar]
- 3. Iwano M, Plieth D, Danoff TM et al. . Evidence that fibroblasts derive from epithelium during tissue fibrosis. J Clin Invest 2002; 110: 341–350 [DOI] [PMC free article] [PubMed] [Google Scholar]
- 4. Lin SL, Kisseleva T, Brenner DA et al. . Pericytes and perivascular fibroblasts are the primary source of collagen-producing cells in obstructive fibrosis of the kidney. Am J Pathol 2008; 173: 1617–1627 [DOI] [PMC free article] [PubMed] [Google Scholar]
- 5. LeBleu VS, Taduri G, O'Connell J et al. . Origin and function of myofibroblasts in kidney fibrosis. Nat Med 2013; 19: 1047–1053 [DOI] [PMC free article] [PubMed] [Google Scholar]
- 6. Tan TK, Zheng G, Hsu TT et al. . Matrix metalloproteinase-9 of tubular and macrophage origin contributes to the pathogenesis of renal fibrosis via macrophage recruitment through osteopontin cleavage. Lab Invest 2013; 93: 434–449 [DOI] [PubMed] [Google Scholar]
- 7. Zheng G, Lyons JG, Tan TK et al. . Disruption of E-cadherin by matrix metalloproteinase directly mediates epithelial–mesenchymal transition downstream of transforming growth factor-beta1 in renal tubular epithelial cells. Am J Pathol 2009; 175: 580–591 [DOI] [PMC free article] [PubMed] [Google Scholar]
- 8. Hashimoto N, Phan SH, Imaizumi K et al. . Endothelial–mesenchymal transition in bleomycin-induced pulmonary fibrosis. Am J Respir Cell Mol Biol 2010; 43: 161–172 [DOI] [PMC free article] [PubMed] [Google Scholar]
- 9. Nataraj D, Ernst A, Kalluri R. Idiopathic pulmonary fibrosis is associated with endothelial to mesenchymal transition. Am J Respir Cell Mol Biol 2010; 43: 129–130 [DOI] [PubMed] [Google Scholar]
- 10. Widyantoro B, Emoto N, Nakayama K et al. . Endothelial cell-derived endothelin-1 promotes cardiac fibrosis in diabetic hearts through stimulation of endothelial-to-mesenchymal transition. Circulation 2010; 121: 2407–2418 [DOI] [PubMed] [Google Scholar]
- 11. Zeisberg EM, Potenta S, Xie L et al. . Discovery of endothelial to mesenchymal transition as a source for carcinoma-associated fibroblasts. Cancer Res 2007; 67: 10123–10128 [DOI] [PubMed] [Google Scholar]
- 12. Li J, Bertram JF. Review: Endothelial-myofibroblast transition, a new player in diabetic renal fibrosis. Nephrology (Carlton) 2010; 15: 507–512 [DOI] [PubMed] [Google Scholar]
- 13. Zeisberg EM, Potenta SE, Sugimoto H et al. . Fibroblasts in kidney fibrosis emerge via endothelial-to-mesenchymal transition. J Am Soc Nephrol 2008; 19: 2282–2287 [DOI] [PMC free article] [PubMed] [Google Scholar]
- 14. Shawber CJ, Kitajewski J. Notch function in the vasculature: insights from zebrafish, mouse and man. Bioessays 2004; 26: 225–234 [DOI] [PubMed] [Google Scholar]
- 15. Kopan R. Notch: a membrane-bound transcription factor. J Cell Sci 2002; 115: 1095–1097 [DOI] [PubMed] [Google Scholar]
- 16. Kopan R, Ilagan MX. The canonical Notch signaling pathway: unfolding the activation mechanism. Cell 2009; 137: 216–233 [DOI] [PMC free article] [PubMed] [Google Scholar]
- 17. Funahashi Y, Shawber CJ, Sharma A et al. . Notch modulates VEGF action in endothelial cells by inducing Matrix Metalloprotease activity. Vasc Cell 2011; 3: 2. [DOI] [PMC free article] [PubMed] [Google Scholar]
- 18. Noseda M, McLean G, Niessen K et al. . Notch activation results in phenotypic and functional changes consistent with endothelial-to-mesenchymal transformation. Circ Res 2004; 94: 910–917 [DOI] [PubMed] [Google Scholar]
- 19. Bielesz B, Sirin Y, Si H et al. . Epithelial Notch signaling regulates interstitial fibrosis development in the kidneys of mice and humans. J Clin Invest 2010; 120: 4040–4054 [DOI] [PMC free article] [PubMed] [Google Scholar]
- 20. Wang Z, Banerjee S, Li Y et al. . Down-regulation of notch-1 inhibits invasion by inactivation of nuclear factor-kappaB, vascular endothelial growth factor, and matrix metalloproteinase-9 in pancreatic cancer cells. Cancer Res 2006; 66: 2778–2784 [DOI] [PubMed] [Google Scholar]
- 21. Moriyama T, Kawada N, Ando A et al. . Up-regulation of HSP47 in the mouse kidneys with unilateral ureteral obstruction. Kidney Int 1998; 54: 110–119 [DOI] [PubMed] [Google Scholar]
- 22. Zhao Y, Zhao H, Zhang Y et al. . Isolation and epithelial co-culture of mouse renal peritubular endothelial cells. BMC Cell Biol 2014; 15: 40. [DOI] [PMC free article] [PubMed] [Google Scholar]
- 23. Morancho A, Hernandez-Guillamon M, Boada C et al. . Cerebral ischaemia and matrix metalloproteinase-9 modulate the angiogenic function of early and late outgrowth endothelial progenitor cells. J Cell Mol Med 2013; 17: 1543–1553 [DOI] [PMC free article] [PubMed] [Google Scholar]
- 24. Tan TK, Zheng G, Hsu TT et al. . Macrophage matrix metalloproteinase-9 mediates epithelial–mesenchymal transition in vitro in murine renal tubular cells. Am J Pathol 2010; 176: 1256–1270 [DOI] [PMC free article] [PubMed] [Google Scholar]
- 25. Vielhauer V, Anders HJ, Mack M et al. . Obstructive nephropathy in the mouse: progressive fibrosis correlates with tubulointerstitial chemokine expression and accumulation of CC chemokine receptor 2- and 5-positive leukocytes. J Am Soc Nephrol 2001; 12: 1173–1187 [DOI] [PubMed] [Google Scholar]
- 26. Yang J, Shultz RW, Mars WM et al. . Disruption of tissue-type plasminogen activator gene in mice reduces renal interstitial fibrosis in obstructive nephropathy. J Clin Invest 2002; 110: 1525–1538 [DOI] [PMC free article] [PubMed] [Google Scholar]
- 27. Akis N, Madaio MP. Isolation, culture, and characterization of endothelial cells from mouse glomeruli. Kidney Int 2004; 65: 2223–2227 [DOI] [PubMed] [Google Scholar]
- 28. Marelli-Berg FM, Peek E, Lidington EA et al. . Isolation of endothelial cells from murine tissue. J Immunol Methods 2000; 244: 205–215 [DOI] [PubMed] [Google Scholar]
- 29. Wang X, Zhou Y, Tan R et al. . Mice lacking the matrix metalloproteinase-9 gene reduce renal interstitial fibrosis in obstructive nephropathy. Am J Physiol Renal Physiol 2010; 299: F973–F982 [DOI] [PubMed] [Google Scholar]
- 30. Sirin Y, Susztak K. Notch in the kidney: development and disease. J Pathol 2012; 226: 394–403 [DOI] [PMC free article] [PubMed] [Google Scholar]
- 31. Sharma S, Sirin Y, Susztak K. The story of Notch and chronic kidney disease. Curr Opin Nephrol Hypertens 2011; 20: 56–61 [DOI] [PMC free article] [PubMed] [Google Scholar]