Sir,
Sarkar et al. in 2017, in their recent article,[1] have very nicely elucidated various mechanisms of hypoxemia, and I would like to congratulate them for this endeavor.
In continuation, I would like to offer the following hypothesis which correlates well between the levels of hemoglobin saturation (SpO2) and partial pressure of oxygen in the arterial blood (PaO2).
We keep on looking arterial blood gas (ABG) reports and keenly watch multi-monitors in Intensive Care Units (ICUs) and wards. As standard teaching, we have a certain image and interpretation of high and low SpO2 and PaO2 reports.[2]
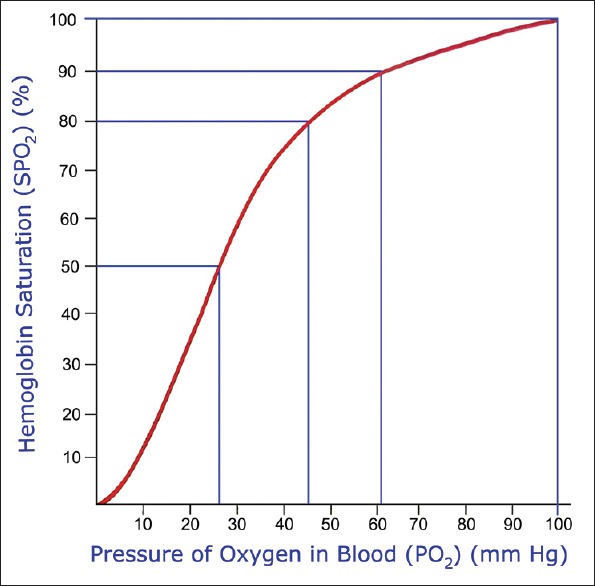
The sigmoid shape of the oxy–hemoglobin (Hb) dissociation curve reflects the cooperative interaction between Hb and oxygen (O2) molecules. The oxy–Hb dissociation curve is initially steep and then flattens out (sigmoid shape). The most important aspect of the curve is that as the oximeter reading falls below 90%, the PaO2 drops very rapidly and O2 delivery to the tissues is reduced and leads to irreversible brain damage and cardiac arrest.
The understanding of sigmoidal-shaped oxy–Hb dissociation curve comes very handy in these situations [Figure 1]. O2 saturation varies with the PaO2 in a nonlinear relationship and is affected by temperature, pH, 2,3 diphosphoglycerate, and PaCO2 (partial pressure of carbon dioxide in the arterial blood).[3] Above 90 mmHg of PaO2, the curve becomes almost flat, and there is a small rise in SpO2 in spite of big increments in PaO2. The flat upper part acts as a buffer in the sense that the PaO2 can drop to about 60 mmHg and yet the Hb will still remain highly saturated (90%) with O2. The steep lower part also has big advantage in that if the tissues require more O2, substantial amounts of O2 can be removed from Hb without greater drops in PaO2.[4] For example, Hb would be still 50% saturated although PaO2 has dropped to 26.6 mmHg (P50).
Figure 1.

Oxy–hemoglobin dissociation curve
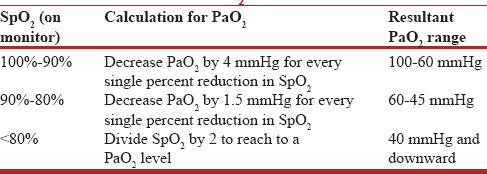
From last 30 years, while working in critical care wards, I always used to wonder if any formula can be devised which, while waiting for ABG results, can rapidly help a clinician to reach to a PaO2 level just by looking at SpO2 values, and I have come up with certain observations/calculations. For the first 10% reduction in SpO2 from 100% to 90%, decrease PaO2 by 4 mmHg for every single percent reduction in SpO2 with a resultant PaO2 falling from 100 to 60 mmHg [Table 1]. For the next 10% reduction in SpO2 from 90% to 80%, decrease PaO2 by 1.5 mmHg for each percent reduction in SpO2 which will result in PaO2 falling from 60 to 45 mmHg. Finally, for SpO2 levels below 80%, divide it by 2, that is half the value of SpO2, and we get the requisite PaO2 level.
Table 1.
Calculation for PaO2 assessment

This hypothesis can have some pitfalls, for example, cyanide poisoning and certain hemoglobinopathies, but still, a fair and working assessment may be drawn from this calculation. Two proven measurements further support this hypothesis:
As per classical teaching, at mixed venous point, the SpO2 of deoxygenated blood returning to the heart is taken as 75% with a saturation of 40 mmHg.[1,3] With the present calculation, O2 saturation would come out to be 75/2 = 37.5 mmHg, which, in clinical parlance, is not much further away from 40 mmHg
The hypothesis is further supported by the value of P50, which is 26.6 mmHg, and again, which is almost half of 50%.
This formula, which is not an exact mathematically proven entity, can be of extreme help to ICU residents and consultants. For example, if the monitor is showing a SpO2 of 70%, we can almost consider a value of PaO2 to be around 35 mmHg and take appropriate measures for the patient.
Financial support and sponsorship
Nil.
Conflicts of interest
There are no conflicts of interest.
REFERENCES
- 1.Sarkar M, Niranjan N, Banyal PK. Mechanisms of hypoxemia. Lung India. 2017;34:47–60. doi: 10.4103/0970-2113.197116. [DOI] [PMC free article] [PubMed] [Google Scholar]
- 2.Leitch AG. Functions of the lung. In: Seaton A, Seaton D, Leitch AG, editors. Crofton & Douglas's Respiratory Diseases. 5th ed. Vol. 1. Oxford: Blackwell Science; 2000. pp. 26–62. Ch. 2. [Google Scholar]
- 3.West JB. Respiratory Physiology-The Essentials. 9th ed. Baltimore: Lippincott Williams & Wilkins; 2012. Gas transport by the blood; pp. 77–94. Ch. 6. [Google Scholar]
- 4.Wagner PD, Powell FL, West JB. Ventilation, blood flow and gas exchange. In: Mason RJ, Broaddus VC, Martin TR, King TE Jr, Schraufnagel DE, Murray JF, et al., editors. Textbook of Respiratory Medicine. 5th ed. Vol. 1. Saunders Elsevier: Philadelphia; 2010. pp. 53–88. Ch. 4. [Google Scholar]


