Abstract
Hepatocellular carcinoma (HCC) is the most common primary liver cancer, which develops mostly in the setting of chronic liver disease. European Association for the Study of the Liver (EASL) and European Organization for Research and Treatment of Cancer (EORTC) prepared guidelines for screening, follow-up and diagnosis of HCC to facilitate decision making and optimize both diagnostic and therapeutic protocols.
The review briefly describes etiology, epidemiology and histopathology of HCC and presents EASL-EORTC guidelines for surveillance and diagnosis of HCC. Target population and screening algorithm is presented in the surveillance section. Ultrasound imaging of HCC and the role of contrast enhanced ultrasound are described as well as the value of laboratory tests in screening. Further, radiological features of HCC in multiphase CT and dynamic contrast enhanced MRI and diagnostic criteria are presented. Additionally, the advantages of advanced techniques in MRI such as diffusion weighed imaging and the use of hepatocyte-specific contrast agents are discussed.
Lastly, the EASL-EORTC guidelines are compared with the guidelines of the American Association for the Study of Liver Diseases and the Japan Society of Hepatology. Also LI-RADS and the Barcelona Clinic Liver Cancer classification are mentioned.
In the near future, due to the ongoing advances in imaging a revision of the guidelines may be expected.
Keywords: Cirrhosis, diagnostic algorithm, hepatocellular carcinoma, magnetic resonance imaging, multidetector computed tomography, ultrasound
1. Introduction
Liver cancer is the third most common cause of cancer-related death in the world [1] with 746.000 associated deaths in 2012 [2]. Among liver cancers, the hepatocellular carcinoma (HCC) is the most common primary liver cancer [1]. Therefore, HCC stays in the spotlight of many medical subspecialties.
1.1. Epidemiology
HCC is two to four times more prevalent in men [1], rarely occurring before the age of 40, with the peak incidence at approximately the sixth to seventh decade of life. According to the International Agency for Research on Cancer (IARC) it is the fifth most frequent malignant neoplasm in men and the ninth most frequent in women [2]. The majority of cases (83% in 2012) occur in East Asia and Mid-Africa, especially in developing areas [2]. In Europe HCC is most common in southern countries, while it is less frequently encountered in Scandinavia. Overall prognosis is poor with the average mortality to morbidity rate of 0,95.
1.2. Etiology & Risk Factors
Approximately 90% of cases of HCC develop in the setting of chronic liver disease (Fig. 1), most commonly related to hepatitis B and C virus infection, in circa 54% and 31% respectively. Hepatitis B virus (HBV) is associated with approximately 60% of HCC cases in developing countries, while only up to 20% in developed countries, where the majority of cases result in due course of chronic hepatitis C virus (HCV) infection [3]. Other risk factors include alcoholic cirrhosis, biliary cirrhosis, hepatic fibrosis and inherited metabolic diseases (such as hereditary hemochromatosis, Wilson disease, tyrosinemia, alpha1-antitrypsin deficiency, porphyria cutanea tarda and glycogen storage diseases) as well as non-alcoholic fatty liver disease, aromatic compounds toxic poisoning and exposure to aflatoxin [4]. Probability of developing HCC increases with duration of liver cirrhosis and 1/3 of patients with known cirrhosis will develop HCC in due life course [5]. Every year approximately 2% of patients suffering from HBV and 3-8% with HCV develop HCC [6]. Research conducted on large groups of patients with a long-term follow-up allowed to distinguish factors indicative of increased risk of HCC in patients with liver cirrhosis. In addition to age and gender predilection (male), presence of esophageal varices [7], low level of platelets, obesity and diabetes [6,8], increased pressure in the portal vein [9] and progression of liver fibrosis [10] are included. Smoking is considered an independent risk factor in development of HCC [8].
Fig. (1).
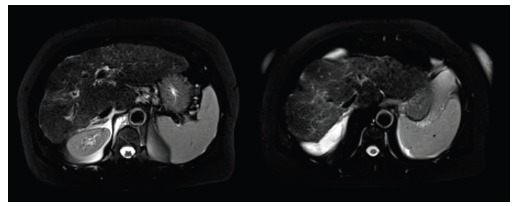
MRI, axial T2-weighted fat-suppressed images. Features of cirrhosis are visible: nodular surface, enlargement of caudal lobe, hyperintense bands within the liver as result of proliferation of fibrotic tissue, peritoneal effusion.
1.3. Histopathological Image of HCC
The most commonly encountered form of HCC is a solitary tumor larger than 20 mm in diameter, however HCC may also present as a multifocal lesion or a diffuse disease (12%) [11]. An early form of HCC, called small HCC, is also distinguished. It appears as a single focus equal or less than 20 mm in diameter and has a good prognosis, with over 90% of five year survival if treated with complete resection or liver transplant [11]. Tumor stroma is scarce and vascular spaces are not contained by proper connective tissue bindings, what explains tendency to extravasation and necrosis in a greater degree than in other malignant tumors of epithelial origin [12]. HCC is also characterized by a high degree of local invasiveness with potential to infiltrate portal vein branches and, less frequently, biliary tracts, to form abnormal arteriovenous connections and can present with tumor emboli within vessels, especially in the portal vein system. Infiltration of the portal vein and formation of tumor emboli even in early stages of the disease, facilitate intrahepatic metastasis [13]. Extensive damage to a large number of hepatocytes caused by a variety of toxic and viral factors is an independent risk factor of multifocal tumor growth [13].
Development of HCC in cirrhotic liver is a multiphase process - from a regenerative nodule (RN), though a low grade dysplastic nodule (LGDN, Fig. 2) and high grade dysplastic nodule (HGDN) progressing to HCC focus within a dysplastic nodule (image of the ‘nodule in nodule’, Fig. 3) and the early form of HCC. The last stage is a mature form of HCC (large HCC).
Fig. (2).
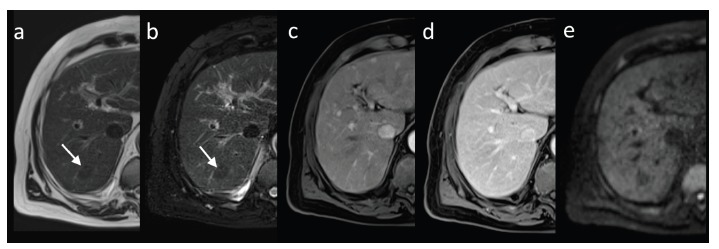
MRI, axial image of low grade dysplastic nodule in segment VII (arrow). Nodule is hypointense in T1-weighted (a) and T2-weighted fat-suppressed images (b), shows isointensity to the surrounding liver parenchyma in hepatic arterial phase (c) and in consecutive phase (d); no diffusion restriction in diffusion weighted imaging (b value of 800s/mm2, e) is seen.
Fig. (3).

MRI - nodule-in-nodule sign – an early stage of HCC. The lesion (arrow) is hyperintense in T2-weighted images in coronal plane without fat saturation (a) and in axial plane with fat saturation (b). The early HCC shows intense enhancement in hepatic arterial phase (c) with washout in equilibrium phase (d) and diffusion restriction in diffusion weighted imaging (b=800s/mm2, e).
Carcinogenesis coexists with angiogenesis, necessary to support the rapid growth of HCC and leading to formation of a rich network of defective arteries. As a result gradual predominance of arterial vascularization over portal venous is seen, clearly visible in HGDN and further forms of HCC. Typically enhancement corresponding to the extent of neoplastic vascularization is seen within 40 seconds after intravenous administration of contrast agent with subsequent washing out. Enhancement visible in the portal venous phase is characteristic of benign nodules associated with cirrhosis.
Approximately 10% of HCC develop in an unchanged liver parenchyma. These lesions are often single, usually significantly larger and detected in a more advanced stage [14, 15].
One of the histological variants of primary liver cancer not associated with chronic liver disease is fibrolamellar carcinoma (FLC, Fig. 4). FLC shows no gender predilection and develops predominantly in young adults (the average age of onset at 30 years old), most commonly in Western Europe and North America. FLC is accompanied by an increase in serum AFP levels [16] and has a good prognosis.
Fig. (4).
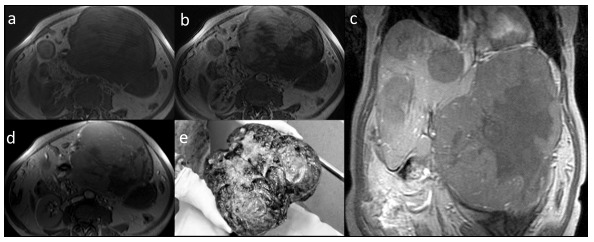
MRI, fibrolamellar carcinoma (FLC) in axial T1-weighted images pre-contrast (a), with heterogenic enhancement in hepatic arterial phase (b) and equilibrium phase (d). The mass in coronal plane presents no enhancement in hepatobiliary phase, other foci of FLC are visible (c). Post-operative image of the large mass (e).
2. Guidelines
Guidelines for diagnostic imaging and early detection of HCC, including issues of prophylaxis and screening, are a part of a strategy implemented to ensure effective treatment and reduced mortality in high risk patients. Though, not to be regarded as firmly established protocols of conduct, they constitute the diagnostic and therapeutic algorithm facilitating and optimizing decision making in everyday clinical practice. The following guidelines have been adapted after recommendations of the European Association for the Study of the Liver (EASL) and the European Organization for Research and Treatment of Cancer (EORTC) on the treatment of HCC published in 2012 [3].
2.1. Surveillance
2.1.1. Target Populations
According to the EASL-EORTC recommendations screening and structured follow-up are recommended in the following groups of patients: /1/ patients with cirrhosis - Child-Pugh A and B, /2/ patients with cirrhosis - Child-Pugh C and awaiting liver transplants, /3/ patients, who do not suffer from liver cirrhosis but are infected with HBV and/or family history of HCC, /4/ patients, who do not suffer from liver cirrhosis but present with chronic hepatitis C and advanced liver fibrosis.
Follow-up should be extended to patients receiving antiviral therapy, especially for chronic hepatitis B, and patients with chronic hepatitis C virus who have developed cirrhosis, irrespective of obtained permanent virologic response in the course of treatment [3].
2.1.2. Screening and Follow-up
The purpose of screening and both clinical and radiological follow-up of high-risk patients is to reduce mortality by early detection of HCC and implementation of effective therapy. The aim is to detect single HCC foci measuring less than 20 mm in diameter, characterized by a better prognosis and exhibiting less than 20% risk of hematogenous spread. In case of larger lesions the risk of hematogenous spread increases with the size of the focus to 30-60% in lesions of 20-50 mm and to 60-90% in foci larger than 50 mm, respectively [17]. Detection of cancer in the advanced stage significantly reduces or even excludes the possibility of effective therapy.
2.1.3. Imaging in HCC Screening
Ultrasonography (US) is most frequently the first imaging modality used in evaluation of parenchymal organs of the abdomen due to its relative low cost, wide availability and non-invasiveness.
Efficacy of detection of HCC in US varies widely and in cirrhotic patients presents with sensitivity of 33 - 96% [18] while specificity reaches over 90% [19]. Detection of small HCC foci in cirrhotic liver may present as a challenge, especially in the presence of regenerative nodules. Therefore, it is of the highest significance, that US should be performed by qualified and experienced personnel using optimal equipment, preferably in dedicated centers. In gray-scale US low-differentiated HCC foci measuring less than 30 mm present typically as hypoechoic lesions (Fig. 5a), some may show increased echogenicity due to inclusion of fatty tissue (Fig. 5b and c). Heterogeneous lesions may correspond to HCC with degenerative changes, while a hyperechoic focus within a larger hypoechoic mass is suggestive of development of HCC within a dysplastic nodule (tumor in tumor phenomenon) [20]. Large lesions often show tendency to impress on adjacent vessels and infiltrate portal vein and its branches, they may present with hypoechoic halo suggestive of expansive growth or blurred, poorly defined margins when infiltrating the surrounding parenchyma.
Fig. (5).

Different features of HCC in ultrasound examination. Small, typically hypoechoic lesion (a), larger lesions with mixed echogenicity (b and c).
Fibrolamellar carcinoma is usually a large, solitary focus within unchanged liver parenchyma, often showing central fibrous scar and calcifications.
In comparison to conventional gray-scale US contrast-enhanced ultrasonography (CEUS) provides higher diagnostic efficacy in differentiation of benign and malignant focal liver lesions (FLLs), often comparable to that achieved in magnetic resonance imaging (MRI). The main feature differentiating benign lesions from malignancies is their level of enhancement in the late phase of the study - benign lesions are usually hyper- or isoechoic to the surrounding liver parenchyma, while malignant lesions show hypoechogenicity (Fig. 6) [21]. Although the enhancement pattern of FLLs may be analyzed in CEUS in real time in consecutive arterial, portal venous, delayed and postvascular phases, similarly to computed tomography (CT) or MRI, recently, many authors discuss that different pharmacokinetic features of contrast agents used for CEUS limit the value of the examination. Sonographic contrast agents are blood pool agents, confined to the vascular space, while the majority of contrast agents used in routine CT and MRI are extracellular space agents [21]. Other limitations include the possibility of overlooking subdiaphragmatic lesions and lesions smaller than 3 mm, reduced detectability of lesions located deep in the liver parenchyma, especially in steatosis and misinterpretation of falciform ligament as a FLL [21].
Fig. (6).
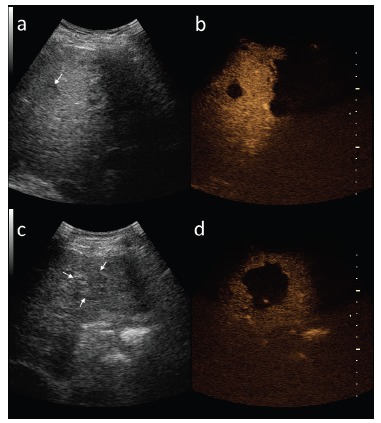
Two different HCC lesions (arrows) in gray-scale ultrasound (a,c) and in late phase of contrast-enhanced ultrasound (b,d).
2.1.4. Screening Algorithm
According to the EASL-EORTC recommendations the most effective screening tool in HCC is US. Evaluation of serum alpha-fetoprotein (AFP) levels allows detection of additional 6-8% of tumors, however the gain in detection frequency, does not balance the increase in number of false positive results and the subsequent rise of diagnostic costs [3]. Abdominal US should be performed every 6 months in high-risk patients [3]. In case of detection of a nodule smaller than 10 mm and during follow-up after resection or loco-regional treatment the interval between consecutive US examinations should be reduced to 4 months [3] (Figs. 7 and 8).
Fig. (7).
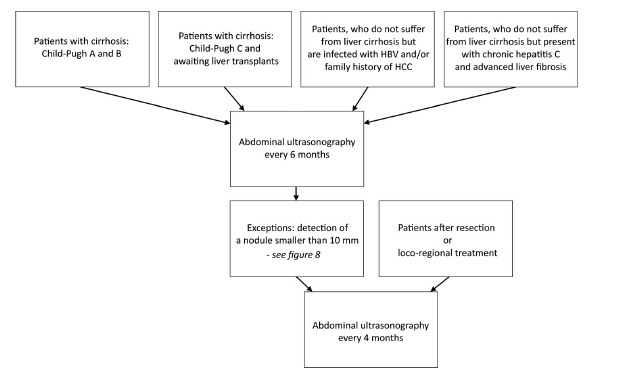
Screening algorithm in HCC in high risk patients according to EASL-EORTC.
Fig. (8).
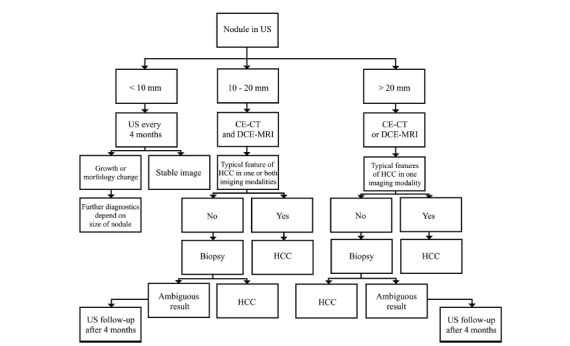
Diagnostic algorithm in nodules detected in US in high risk patients according to EASL-EORTC.
2.1.5. Laboratory Tests in HCC Screening
Serum AFP is the most widely used tumor biomarker in diagnosis of HCC, however its value is often considered insufficient. An increase of serum AFP levels in cirrhotic patients is non-specific for development of HCC - it is encountered only in 10 to 20% of tumors in the early stage and may be also seen in cases of advanced cirrhosis without HCC, exacerbation of HBV or HCV and in other neoplasms, such as cholangiocarcinoma, gastric cancer and germ cell tumors [22]. Therefore, AFP levels are mainly evaluated in follow-up after the treatment. Serum AFP value below 20 ng/mL is considered normal, the cut-off value for malignancy is established at the level 200 ng/mL (high specificity, sensitivity of 22%) [23]. Up to 40% of patients with early stage of HCC show normal AFP values [24].
CE-CT - contrast-enhanced computed tomography, DCE-MRI - dynamic contrast-enhanced magnetic resonance imaging, US - ultrasound.
AFP can be divided during electrophoresis into different isoforms. One of the isoforms, lectin-bound AFP (AFP-L3), is related to development of HCC. Using relative increase of AFP-L3 in percentage in relation to AFP level, improves sensitivity to 37%-60% and specificity to 85%-92% for detection of HCC [25]. Elevated fraction of AFP-L3 over 10% identifies patients with HCC. Moreover, patients with elevated APF serum level but with no HCC, have low fraction of AFP-L3 [26]. AFP-L3 is particularly useful when serum levels of AFP vary between 10 and 200 ng/mL [27].
Another HCC marker is protein induced by vitamin K absence-II (PIVKA-II), also known as des-gamma carboxy prothrombin (DCP). The protein is a product of abnormal carboxylation of prothrombin precursor. The efficacy of PIVKA-II depends on accepted cut-off value. For cut-off value of 40 mAU/mL sensitivity and specificity ranges from 28%-89% and 87%-96% accordingly [28]. For cut-off value of 125 mAU/mL sensitivity reaches 89% and specificity 95% for differentiating HCC from cirrhosis and chronic hepatitis [29]. It is noteworthy that increased PIVKA-II level occurs in patients with vitamin K deficiency and in patients treated with vitamin K antagonists (e.g. warfarin).
Other markers are also investigated, for example Golgi protein 73 (GP73) [30].
In meta-analysis by Hu et al., who included 40 studies into the analysis, the area under curve reached 0.748 for combination of APF and AFP-L3, 0.874 for AFP and PIVKA-II and 0.932 for APF and GP73. Areas under curve for the second and the third combination of markers were significantly higher than for single markers [28].
At the time, rather a combination of laboratory tests than a single marker, should be treated more as a guidance for further diagnostics, not as a stand-alone screening test. Assessment of serum AFP level for HCC screening is not recommended by EASL- EORTC guidelines.
2.2. Diagnosis of HCC
According to the EASL-EORTC recommendations diagnosis of HCC is based on results of a histopathological examination report or on non-invasive criteria [3].
Histopathological report should be constructed according to the International Consensus Group for Hepatocellular Neoplasia guidelines [31].
Non-invasive diagnostic criteria, which can be applied only in cirrhotic patients, have been first established in 2001 in Barcelona [32]. They allowed to diagnose HCC in a patient with known cirrhosis if a lesion of more than 20 mm in diameter showed typical, strong enhancement after intravenous contrast agent administration in hepatic arterial phase (HAP) in two out of four subsequent imaging modalities: multiphase CT, dynamic contrast-enhanced MRI (DCE-MRI), angiography and CEUS or in one imaging modality if the AFP serum levels exceeded 400 ng/mL. Non-invasive criteria were revised in 2005 in cooperation with American Association for the Study of Liver Diseases (AASLD) with introduction of a new radiological enhancement pattern characteristic of HCC, which includes a strong uptake of contrast agent in HAP and its subsequent wash-out in the portal venous phase (PVP) and equilibrium phase (EP) [33]. The latter results directly from previously mentioned neovascularization process within developing HCC lesions, with a predominance of arterial over portal venous blood supply. According to the altered recommendations diagnosis of HCC required confirmation of the typical enhancement pattern in one of two imaging modalities (multiphase CT or DCE-MRI) in nodules larger than 20 mm and in both imaging modalities in case of lesions measuring 10 to 20 mm; evaluation of serum AFP levels has been removed from the diagnostic algorithm [33].
2012 brought further revisions of the non-invasive criteria of diagnosis of HCC with exclusion of CEUS from diagnostic algorithm due to its different pharmacokinetic features in comparison to contrast agents administered in CT and MRI (see: Imaging in HCC screening) and a significant number of false-positive results observed in primary biliary cancer [3]. The 2012 recommendations confirmed the efficacy and maintained the other criteria for the diagnosis of HCC in imaging studies [3].
Non-invasive criteria in the diagnosis of HCC and subsequent revisions of recommendations are summarized in Tables 1 and 2, respectively. Today, HCC is the only tumor for which non-invasive diagnosis is accepted.
Table 1. Diagnostic criteria of HCC in examinations with intravenous administration of contrast agents. Non-invasive diagnostic criteria apply only to cirrhotic patients.
| Tumor 10 - 20 mm in diameter | Hypervascular lesion confirmed in multiphase CT or DCE-MRI: - Strong enhancement in hepatic arterial phase - Wash-out in portal venous and/or equilibrium phases |
| Tumor larger than 20 mm | Hypervascular lesion confirmed in multiphase CT or DCE-MRI. |
DCE-MRI – dynamic contrast-enhanced magnetic resonance imaging, CT – computed tomography.
Table 2. EASL-EORTC recommendations with further revisions of non-invasive diagnostic criteria of HCC.
| 2001 | Diagnosis of HCC larger than 20 mm on basis of strong enhancement after intravenous contrast agent administration in HAP in two out of four following imaging modalities: multiphase CT, DCE-MRI, angiography and CEUS or in one mentioned imaging modality if the AFP serum levels exceeded 400 ng/mL. |
| 2005 | • Introduction of a new radiological enhancement pattern of HCC - a strong uptake of contrast agent in HAP and its subsequent wash-out in PVP/EP, • Diagnosis of HCC measuring 10 to 20 mm required confirmation of the typical enhancement pattern in two imaging modalities (multiphase CT, DCE-MRI and CEUS), • Diagnosis of HCC larger than 20 mm - confirmation in one imaging modality, • Removal of evaluation of serum APF level from diagnostic algorithm. |
| 2012 | • Exclusion of CEUS from diagnostic algorithm, • Confirmation of the efficacy and maintenance the other criteria for the diagnosis of HCC in multiphase CT, DCE-MRI. |
AFP - alpha-fetoprotein, CEUS - contrast enhanced ultrasonography, CT - computed tomography, DCE-MRI - dynamic contrast-enhanced magnetic resoanace imaging, EP - equilibrium phase, HAP - hepatic arterial phase, HCC - hepatocellular carcinoma, PVP - portal venous phase.
2.2.1. Multiphase CT
Imaging of FLLs in CT requires the use of a multi-phase study protocol, including a phase prior to the intravascular administration of contrast agent (native phase) and phases obtained after intravascular administration of contrast medium - HAP, PVP and EP, obtained routinely 40, 60 and 180 seconds post contrast administration respectively in a multi-row CT unit (Fig. 9). EP may be also referred to as an early delay phase in comparison to the late delay phase, obtained after 10 to 15 minutes after administration of contrast medium, acquired if the imaging protocol is extended to detect lesions with a high content of fibrous tissue, such as e.g. cholangiocarcinomas. An early arterial phase, acquired 20 to 30 seconds after contrast agent administration may also be performed for CT angiography reconstructions.
Fig. (9).

Multiphase CT. Native examination (a), hepatic arterial phase with contrast agent in hepatic arteries and slight enhancement of portal vein (b), portal venous phase (c) and equilibrium phase (d).
Iodine contrast agents (CAs) eliminated mainly though kidneys and showing a half-life time of 1 to 2 hours, in case of normal renal function, are administered in CT in everyday practice. Routinely CAs are administered into the median cubital vein at a dose of 1 to 2.5 mL/kg body weight at the rate of 3-4 mL/sec. This is however, subject to change depending on the imaging protocol and available equipment.
The value of radiation attenuation coefficient of the liver is set between 50 to 60 Hounsfield Units (HU). Liver parenchyma uniformly absorbs radiation. In non-enhanced liver vessels present with lower density in comparison to surrounding parenchyma. Liver parenchyma consists of approximately 80% hepatocytes, 16% mononuclear phagocytes and 4% biliary epithelial cells. Proteins, fats, ferritin, lipofuscin and organelles are suspended within the hepatocyte cytoplasm. Glycogen, iron and fat determine the degree of radiation absorption. Generally, an increase of intracellular water content is observed within liver tumors, accompanied by reduction of iron and glycogen content, which leads to decrease in radiation attenuation coefficient and typically manifests as an area of low density in imaging prior to CAs administration (Fig. 10). However, small foci of HCC may also present as isodense and/or very rarely as hyperdense areas, similar to regenerative and dysplastic nodules due to their high content of copper or iron.
Fig. (10).
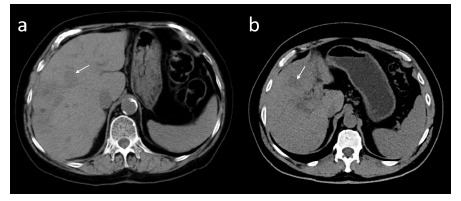
Two examples of hypodense HCC foci in non-enhanced CT.
As mentioned previously, HCCs enhance strongly in the HAP, depending on the size of the tumor and the presence of regressive changes homo- or heterogeneously. Large tumors will typically present with heterogeneous enhancement, often with so-called mosaic pattern as opposed to small, early forms of hepatocelullar carcinomas. While planning the examination, attention should be payed to the delay of the arterial phase of approximately 10 - 15 seconds to the enhancement of the aorta.
If tumor pseudo-capsule is present, it is more clearly visible in the PVP and EP than in HAP, with delayed enhancement in EP (Fig. 11). Tumors with pseudo-capsule show better prognosis.
Fig. (11).
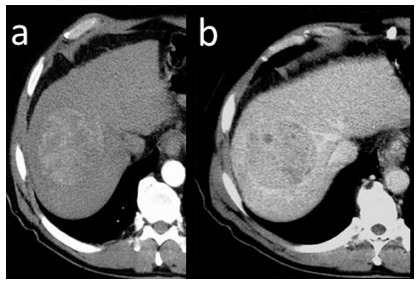
CT axial images. HCC in hepatic arterial phase (a) and equilibrium phase (b). Wash-out feature and enhancing tumor pseudo-capsule is visible in the latter.
Washing-out of the contrast agent in PVP (the phase of the strongest enhancement of the liver parenchyma) or/and EP is a sine qua non for diagnosing HCC with specificity of 95-96% [34]. As shown in (Fig. 12), the focus presenting with washing-out is of lower density that the surrounding liver parenchyma.
Fig. (12).

Schematic presentation of pattern of enhancement of HCC lesion with strong enhancement in HAP (bright, hyperdense lesion in comparison to surrounding liver parenchyma) and wash-out of contrast agent in subsequent PVP and EP (dark, hypodense lesion).
HAP - hepatic arterial phase, EP - equilibrium phase, PVP - portal venous phase.
About 20% of hepatocellular cancers are hypovascular and exhibit poorer enhancement than adjacent liver parenchyma in HAP, PVP and/or EP (Fig. 13) [35]. As those foci do not meet the non-invasive diagnostic criteria of HCC, a further confirmation by means of biopsy is required [34]. If, however, a biopsy cannot verify the diagnosis, a wait and close follow-up strategy with repeat imaging is recommended [36].
Fig. (13).

Atypical hypovascular HCC focus (arrow) in patient after right hemihepatectomy. The lesion shows no enhancement and is invisible in hepatic arterial phase in axial CT (a). Hypovascular HCC is hypodense in portal venous phase in axial CT (b) and hypointense in portal venous phase in axial fat-suppressed T1-weighted image (d). The lesion is hyperintense in axial T2-weighted image (c).
2.2.2. Magnetic Resonance Imaging
A standard MRI protocol consists of /1/ pre-contrast and dynamic post-contrast T1-weighted 3D gradient echo sequences with fat-suppression, /2/ multishot or single-shot fast spin-echo T2-weighted sequences with and without fat-suppression /3/ chemical shift imaging (in- and opposed-phase) and /4/ diffusion weighted imaging (DWI). Additional sequences like delayed post-contrast T1-weighted sequence may be included. MRI examination must cover the whole liver and multi-planar acquisition is preferred.
In conventional, pre-contrast MRI sequences the majority of large HCCs show decreased signal intensity in T1-weighted and increased signal intensity in T2-weighted images (Fig. 14). However, small lesions tend to remain isointense to the adjacent liver parenchyma in T1-weighted images. Focal or diffuse areas of high signal intensity may be observed in lesions containing fat, glycogen, copper, melanin and methemoglobin, as well as in those containing high concentration of protein or presenting with slow blood flow or thrombosis. Presence of intracellular fatty components may be easily confirmed in phase and out of phase sequences, while fat saturation sequences are used to detect extracellular fat. T1-weighted images depict hyperintense areas of bleeding (methemoglobin) and fat, both important features in differential diagnosis, present in HCCs and hepatic adenomas (more frequently). Decrease in signal intensity in T2-weighted images is seen in case of fibrous tissue, while areas of necrosis present especially within large foci cause an increase in signal intensity and lead to heterogenous enhancement. Copper deposits lead to a slight reduction in signal intensity, while iron deposits significantly decrease signal intensity in both T1- and T2-weighted images. Low signal intensity of regenerative nodules in T2-weighted images resulting from characteristic iron deposits, facilitate differential diagnosis with usually hyperintense HCC foci. Pseudocapsule is hypointense in T2-weighted images and shows delayed enhancement in EP, similarly to CT.
Fig. (14).

Small isointense HCC focus in T1-weighted axial image (a). Another HCC focus slightly hypointense in T1-weighted coronal fat-suppressed image (b). Same lesion in T2-weighted image is hyperintense (c). Regulative nodules (siderotic) in T2-weighted image (d) in comparison.
Signal intensity of proliferative lesions results from their histological and cytological features, dynamic examination after intravascular administration of contrast medium allows differentiation of lesions according to their vascularity. DCE-MRI shows a similar enhancement pattern in majority of HCCs as observed in multiphase CT with early strong enhancement in HAP and washing-out in the following phases (Fig. 15), however it is advantageous due to a higher contrast between lesions and adjacent liver parenchyma and lack of exposure to ionizing radiation.
Fig. (15).
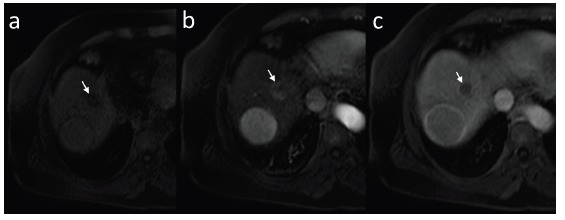
Small (arrow) and large HCC foci in T1-weighted fast-suppressed axial images: pre-contrast (a), in hepatic arterial phase (b) and equilibrium phase (c). Both lesions show enhancement in arterial phase and wash-out in equilibrium phase. Large lesion presents with enhancing pseudo-capsule in equilibrium phase.
Paramagnetic gadolinium chelates are the most commonly used contrast agents in MRI in everyday practice. They possess properties of extracellular space contrast media and therefore penetrate from intravascular space through the capillaries, into the extracellular, interstitial space, resulting in contrast enhancement of abdominal parenchymal organs, including the liver. The recommended dose of gadolinium chelates in liver imaging is 0.1 mmol/kg or 0.2 mL/kg at flow rate of 2-3 mL/sec. CAs are excreted in the mechanism of glomerular filtration; the plasma half-life is approximately 90 minutes and increases in patients with renal failure. Gadolinium chelates are generally considered safe in low doses applied clinically. Potential adverse reactions include transient headache, nausea and vomiting, as well as pain at the injection site.
In some cases of small lesions, however, the washing-out of the contrast agent may not be observed as clearly as in mature forms of HCCs. In such cases diagnosis of hypovascular HCCs and differentiation with arteriovenous shunts and FNH-like lesions may be facilitated by MRI with hepatocyte-specific contrast agents (HSCAs). Moreover, approximately 20% to 40% of lesions smaller than 20 mm in diameter do not show typical enhancement in HAP [3, 37]. In such cases DCE-MRI with HSCAs should be considered, as most of HCCs are hypointense in hepatobiliary phase (HBP). Administration of HSCAs increases the efficacy and diagnostic accuracy of MRI (Fig. 16). More and more commonly used in recent years HSCAs combine pharmacological features of extracellular space agents, allowing imaging in HAP, PVP and EP with delayed uptake by hepatocytes and excretion into biliary tracts resulting in obtaining an additional imaging phase, called the HBP. HSCAs cause an increase in signal intensity of biliary tracts and structures containing functioning hepatocytes in T1-weighted images. Currently, there are two commercially available gadolinium-based hepatocyte-specific contrast agents - gadoxetic acid (Gd-EOB-DTPA; under the trade name Primovist in the countries of the European Union and Eovist in United States of North America, Bayer, Germany) and gadobenate dimeglumine (Gd-BOPTA; MultiHance, Bracco, Italy). HBP is obtained after 10 to 20 min. post intravenous administration of Gd-EOB-DTPA and after approximately 60 minutes after administration of Gd-BOPTA. Lack of enhancement after HSCAs administration is suggestive of presence of non-functioning or degenerative hepatocytes or cells other than hepatocytes. The majority of HCCs show low signal intensity in comparison to the surrounding liver parenchyma in HBP (Fig. 17-19) [38] as confirmed in our studies [39], while lesions such as arteriovenous shunts and/or FNH-like tumors remain iso- or hyperintense. Less than 5% of well-differentiated HCCs, however, show uptake of HSCAs [40]. Multiple theories are being investigated in order to explain the uptake of Gd-EOB-DTPA in liver cells. Some authors claim that it may be related to the excessive expression of organic anion transporting polypeptide (OATP) [41], usually blocked in malignancies [42, 43]. Others suggest correlation between histological malignancy of the tumor [44] and the possibility of CAs uptake in well differentiated lesions.
Fig. (16).
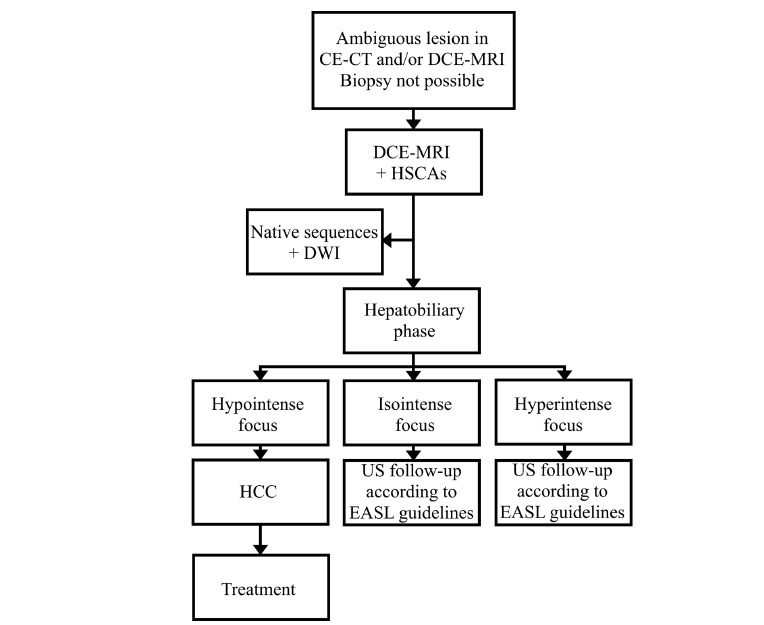
Diagnostic algorithm in ambiguous liver nodules in imaging and/or in case of contradictions to biopsy.
Fig. (17).
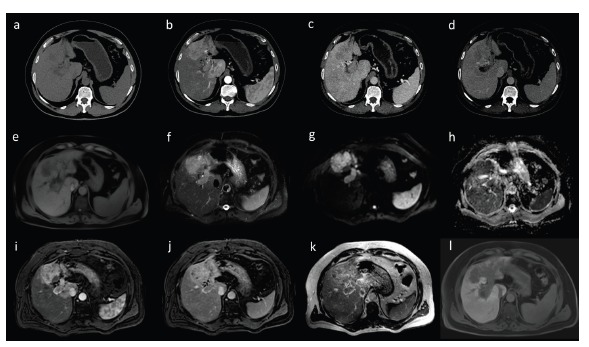
Diffused form of HCC with invasion of portal vein in CT (a-d) and MRI (e-l) in axial images. Strong enhancement is visible in hepatic arterial phase (b, i) with subsequent wash-out in portal venous (c, j) and equilibrium phase (d, k). Dynamic contrast-enhanced MRI was performed after administration of hepatocyte-specific contrast agent - HCC is typically hypointense in hepatobiliary phase (l). The lesion shows diffusion restriction with high signal in diffusion weighted imaging (g) and low signal in ADC map (h). T1-weighted (e) and T2-weighted images with fat saturation (f).
Fig. (19).
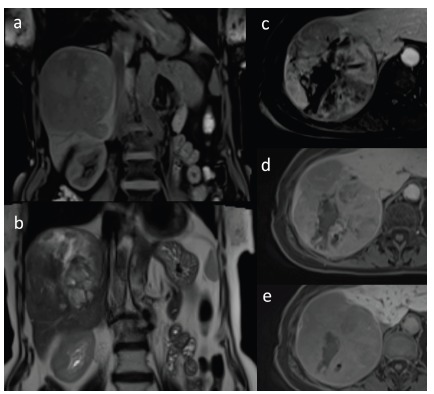
Large HCC with degenerative changes in coronal T1-weighted image with fat saturation (a) and in coronal T2-weighted image (b). Dynamic contrast-enhanced sequences in axial T1-weighted images with fat saturation after administration of hepatocyte-specific contrast agent in hepatic arterial phase (c), portal venous phase (d) and hepatobiliary phase (e). Heterogenous enhancement of the lesion is seen with areas of non-enhancing focal necrosis (c) with subsequent washing out of the contrast agent (d). Lesion shows low signal intensity in comparison to adjacent liver parenchyma in hepatobiliary phase (e).
CE-CT - contrast-enhanced computed tomography, DCE-MRI - dynamic contrast-enhanced magnetic resonance with intravenous, non-hepatocyte-specific contrast agent administration, DCE-MRI + HSCA - contrast-enhanced magnetic resonance imaging with hepatocyte-specific contrast agents, DWI - diffusion weighted imaging, US - ultrasound
When HBP is included in the MRI protocol, the examination may begin with chemical shift imaging and pre-contrast T1-weighted sequence with fat-suppression, followed by HSCA administration and dynamic post-contrast T1-weighted sequence, also with fat-suppression. Before HBP is acquired, T2-weighted imaging and DWI can be performed to save time and shorten MRI examination.
Conventional liver imaging protocols are more frequently extended with diffusion weighted sequences. DWI refers to the motion of molecules of water in intra- and extracellular spaces as well as in intravascular compartment. In reference to focal liver lesions it reflects their cellular density. DWI is used to optimize tissue characterization, including differentiation of benign lesions from malignancies, in follow-up of response to treatment and in detection of recurrence. In reference to DWI sequences, apparent diffusion coefficient (ADC) maps are calculated. ADC, expressed in mm2/s, is a measure of water molecules motion - when diffusion is unimpeded ADC is larger. Lesions suspected of malignancy present with diffusion restriction - an increasing signal intensity in DWI and low values of ADC (which corresponds to low signal intensity on ADC map) (Fig. 20). Introduction of additional imaging feature, describing signal intensity of a lesion, to standard diagnostic criteria of HCCs, increases the efficacy of MRI in patients with chronic liver diseases [45] and facilitates differentiation of HCCs from dysplastic nodules - the latter do not show diffusion restriction [46]. However, one must remain careful while interpreting DWI in patients with severe cirrhosis - advanced fibrosis may restrict diffusion throughout the liver parenchyma to a degree comparable with the HCC focus, thus not allowing its distinction.
Fig. (20).
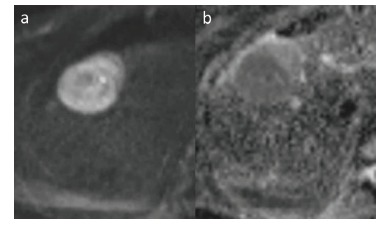
Large HCC with signs of diffusion restriction - increased signal intensity in DWI b=500 s/mm2 (a) confirmed with low signal intensity on ADC map (b).
Radiological features of arterioportal shunts (A-P shunts), RN, LGDN, HGDN and HCC in CT and MRI are further summarized in Table 3.
Table 3. Pattern of enhancement of nodules in hepatocarcinogenesis.
| Imaging feature | RN | LGDN | A-P shunts | HGDN | HCC |
|---|---|---|---|---|---|
| NE-CT | hyper | hyper | iso | hyper | hypo (iso, hyper) |
| T1W | iso to hyper | iso to hyper | iso | iso to hyper | hypo |
| T2W | hypo | iso to hyper | iso | iso | hyper |
| Enhancement in HAP | iso | iso | hyper | hyper | hyper |
| Wash-out | none | none | none | none | present +/- pseudocapsule |
| HBP | iso to hyper | iso to hyper | iso to hyper | iso | hypo |
| DWI | iso | iso | iso | iso | hyper |
A-P SHUNTS - arterio-portal shunts, DWI - diffusion weighted imaging, HAP - hepatic arterial phase, HBP - hepatobiliary phase, HCC - hepatocellular carcinoma, HGDN - high grade dysplastic nodule, LGDN - low grade dysplastic nodule, NE-CT - non-enhanced computed tomography, RN - regenerative nodule, T1W - T1-weighted image, T2W - T2-weighted image.
2.3. Staging
Diagnostic imaging plays an important role not only in detection of the disease but also in its staging, therefore influencing prognosis and treatment. In reference, the EASL-EORTC guidelines recommend The Barcelona-Clínic Liver Cancer Classification (BCLC), which are also included into the AASLD guidelines in management in HCC [23]. BCLC Classification focuses on prognostic variables associated with the tumor (number and size of lesions, presence of vessel infiltration and extrahepatic dissemination), liver function (Child-Pugh Score) and general health. Published first in 1999 and up-to-date frequently revised, it divides patients into 5 prognostic groups guiding optimal therapeutic approach.
3. AASLD and JSH guidelines
Diagnostic criteria and treatment guidelines recommended by AASLD [23] do not significantly differ from the EASL-EORTC guidelines [3]. The authors agree that US is the method of choice in screening for HCC in high risk patients and should be performed every 6 months. It is advised, however, to follow-up nodules smaller than 10 mm in diameter every 3 to 6 months in first two years with a subsequent increase of the interval up to 6 months in stable lesions. Nodules larger than 10 mm in diameter should be verified in either multiphase CT or DCE-MRI and in equivocal cases assessed with the second imaging modality and biopsy [23].
The Japan Society of Hepatology (JSH) guidelines differ from the EASL-EORTC and AASLD guidelines both in terms of screening and non-invasive diagnostic criteria of HCC [47]. Main differences concern the screening algorithm, which includes assessment of serum tumor markers and the use of CEUS with Sonazoid (Daiichi Pharmaceutical, Japan) as contrast agent, CT angiography and CT arterial portography in diagnostic imaging in reference centers. High risk patients are divided into two subgroups. The subgroup A (very high risk) consists of patients with chronic hepatitis B and C who developed cirrhosis, the subgroup B (high risk) includes patients with chronic hepatitis B and C and patients with cirrhosis of origin other than HBV and HCV related. In the subgroup A US follow-up every 3 to 4 months and multiphase CT or DCE-MRI (with or without HSCAs) every 6-12 months are recommended. In the subgroup B US examination every 6 months is advised. In both subgroups US screening is followed by assessment of tumor markers, inter alia serum AFP-L3 levels.
Diagnosis of HCC is based on three factors: background of chronic liver disease, tumor markers and imaging studies. In case of liver cirrhosis related to HBV and/or HCV infection, increase in serum tumor markers and presence of typical enhancement pattern in multiphase CT / DCE-MRI / CEUS diagnosis of HCC is certain. In the absence of those criteria, further investigation according to specific FLLs differential algorithms is recommended, separate for both hypo- and hypervascular lesions [47]. In ambiguous lesions biopsy remains the golden reference.
4. LI-RADS
LI-RADS was first introduced in March 2011 by the American College of Radiology to standardize CT and MRI liver examination reports in high risk patients. The current version from 2014 evaluates arterial enhancement, wash-out, presence of tumor pseudo-capsule and nodule growth to determine the degree of probability that assessed nodule is HCC. LI-RADS gives five major categories from ‘definitely benign’ to ‘definitely HCC’ and three additional categories. The additional categories stand for HCC with portal veins invasion, treated HCC and other probably malignant lesions but not HCC. LI-RADS also incorporates a number of ancillary features that may favor HCC or benign lesion, among which nodule intensity in HBP and DWI are mentioned [48].
Conclusion
Overall prognosis in HCC is poor, with a rising number of new cases diagnosed annually and high mortality rate. In 90% HCC develops in the setting of cirrhosis. Detection and differentiation of early forms of HCCs from dysplastic nodules in cirrhotic liver is still perceived as a challenge, especially in reference to the fact that HCC foci larger than 2 cm statistically carry a greater risk of treatment failure. Therefore, guidelines on screening and diagnostic algorithm of HCC including recommendations on treatment and follow-up are of the highest significance. Among patients included in screening by EASL-EORTC guidelines are these with cirrhosis and patients who do not suffer from cirrhosis but are infected with HBV and HCV. According to guidelines, screening and follow-up is based on US examinations whereas diagnosis of HCC in possible either by histopathological assessment or non-invasive by statement of typical pattern of enhancement in multiphase CT or DCE-MRI examination. Evaluation of HCC serum markers in not included in screening algorithm. For staging purposes BCLC system is applied.
However, EASL-EORTC guidelines do not incorporate in screening algorithm new blood markers of HCC, which show high efficacy in recent studies (e.g. GP73). Use of HSCAs and DWI sequence in MRI examination is not recommended even in case of ambiguous lesions in multiphase CT or DCE-MRI. These radiological tools could be very helpful in distinguishing HGDN and early HCC. Also CEUS is not included in second-line diagnosis. It is worth noticing, that all above mentioned diagnostic tools are implemented by JSH guidelines.
It has been over four years since the last EASL-EORTC guidelines update and due to ongoing advances and new evidences their revision may be expected in the near future.
Fig. (18).

Small HCC in dynamic contrast-enhanced MRI with administration of hepatocyte-specific contrast agent. Pre-contrast examination (a), hepatic arterial phase (slightly hyperintense, b), equilibrium phase (c) and hepatobiliary phase (d) in T1-weighted images in axial plane. In hepatobiliary phase HCC focus is hypointense.
ACKNOWLEDGEMENTS
Declared none.
CONFLICT OF INTEREST
The authors confirm that this article content has no conflict of interest.
References
- 1.WHO, International Agency for Research on Cancer GLOBOCAN 2012. Available from: http://www-dep.iarc.fr. [Accessed on: 2015 April 26]. 2012.
- 2.Ferlay J., Soerjomataram I., Ervik M., et al. GLOBOCAN 2012 v1.0, Cancer Incidence and Mortality Worldwide: IARC CancerBase No. 11. Lyon, France. IARC 2013. Available from: http://globocan.iarc.fr [Accessed 2015 April 26]. 2013.
- 3.EASL-EORTC clinical practice guidelines: management of hepatocellular carcinoma. Eur. J. Cancer. 2012;56(4):908–943. doi: 10.1016/j.jhep.2011.12.001. [DOI] [PubMed] [Google Scholar]
- 4.Herbst D.A., Reddy K.R. Risk factors for hepatocellular carcinoma. Clin. Liver Dis. 2012;1(6):180–182. doi: 10.1002/cld.111. [DOI] [PMC free article] [PubMed] [Google Scholar]
- 5.Sangiovanni A., Prati G.M., Fasani P., et al. The natural history of compensated cirrhosis due to hepatitis C virus: a 17-year cohort study of 214 patients. Hepatology. 2006;43(6):1303–1310. doi: 10.1002/hep.21176. [DOI] [PubMed] [Google Scholar]
- 6.Ioannou G.N., Splan M.F., Weiss N.S., McDonald G.B., Beretta L., Lee S.P. Incidence and predictors of hepatocellular carcinoma in patients with cirrhosis. Clin. Gastroenterol. Hepatol. 2007;5(8):938–945. doi: 10.1016/j.cgh.2007.02.039. [DOI] [PubMed] [Google Scholar]
- 7.Gomez E.V., Rodriguez Y.S., Bertot L.C., et al. The natural history of compensated HCV-related cirrhosis: a prospective long-term study. J. Hepatol. 2013;58(3):434–444. doi: 10.1016/j.jhep.2012.10.023. [DOI] [PubMed] [Google Scholar]
- 8.Marrero J.A., Fontana R.J., Fu S., Conjeevaram H.S., Su G.L., Lok A.S. Alcohol, tobacco and obesity are synergistic risk factors for hepatocellular carcinoma. J. Hepatol. 2005;42(2):218–224. doi: 10.1016/j.jhep.2004.10.005. [DOI] [PubMed] [Google Scholar]
- 9.Ripoll C., Groszmann R.J., Garcia-Tsao G., et al. Portal Hypertension Collaborative Group Hepatic venous pressure gradient predicts development of hepatocellular carcinoma independently of severity of cirrhosis. J. Hepatol. 2009;50(5):923–928. doi: 10.1016/j.jhep.2009.01.014. [DOI] [PMC free article] [PubMed] [Google Scholar]
- 10.Masuzaki R., Tateishi R., Yoshida H., et al. Prospective risk assessment for hepatocellular carcinoma development in patients with chronic hepatitis C by transient elastography. Hepatology. 2009;49(6):1954–1961. doi: 10.1002/hep.22870. [DOI] [PubMed] [Google Scholar]
- 11.Szurowska E., Nowicki T., Studniarek M. Diagnostyka obrazowa raka pierwotnego wątroby. Onkologia w Praktyce Klinicznej. 2011;7(2):73–83. [Google Scholar]
- 12.Honda H. Hepatocellular carcinoma: correlation of CT, angiographic and histopathologic findings. Radiology. 1993;189:857–862. doi: 10.1148/radiology.189.3.8234716. [DOI] [PubMed] [Google Scholar]
- 13.An S.K., Chung J.W., Kim T.K., et al. Intrahepatic metastasis in hepatocellular carcinoma through reversed hepatic venous flow. AJR Am. J. Roentgenol. 2000;175:1673–1675. doi: 10.2214/ajr.175.6.1751673. [DOI] [PubMed] [Google Scholar]
- 14.Hussain S.M., Zondervan P.E., IJzermans J.N., Schalm S.W., de Man R.A., Krestin G.P. Benign versus malignant hepatic nodules: MR imaging findings with pathologic correlation. Radiographics. 2002;22(5):1023–1036. doi: 10.1148/radiographics.22.5.g02se061023. [DOI] [PubMed] [Google Scholar]
- 15.Winston C.B., Schwartz L.H., Fong Y., Blumgart L.H., Panicek D.M. Hepatocellular carcinoma: MR imaging findings in cirrhotic livers and noncirrhotic livers. Radiology. 1999;210(1):75–79. doi: 10.1148/radiology.210.1.r99ja1975. [DOI] [PubMed] [Google Scholar]
- 16.Campos J.T., Sirlin C.B., Choi J.Y. Focal hepatic lesions in Gd-EOB-DTPA enhanced MRI: the atlas. Insights Imaging. 2012;3(5):451–474. doi: 10.1007/s13244-012-0179-7. [DOI] [PMC free article] [PubMed] [Google Scholar]
- 17.Roskams T. Anatomic pathology of hepatocellular carcinoma: impact on prognosis and response to therapy. Clin. Liver Dis. 2011;15(2):245–259. doi: 10.1016/j.cld.2011.03.004. [DOI] [PubMed] [Google Scholar]
- 18.Bennett G.L., Krinsky G.A., Abitbol R.J., Kim S.Y., Theise N.D., Teperman L.W. Sonographic detection of hepatocellular carcinoma and dysplastic nodules in cirrhosis: correlation of pretransplantation sonography and liver explant pathology in 200 patients. AJR Am. J. Roentgenol. 2002;179(1):75–80. doi: 10.2214/ajr.179.1.1790075. [DOI] [PubMed] [Google Scholar]
- 19.Bolondi L. Screening for hepatocellular carcinoma in cirrhosis. J. Hepatol. 2003;39(6):1076–1084. doi: 10.1016/s0168-8278(03)00349-0. [DOI] [PubMed] [Google Scholar]
- 20.Dodd G.D., III, Miller W.J., Baron R.L., Skolnick M.L., Campbell W.L. Detection of malignant tumors in end-stage cirrhotic livers: efficacy of sonography as a screening technique. AJR Am. J. Roentgenol. 1992;159(4):727–733. doi: 10.2214/ajr.159.4.1326883. [DOI] [PubMed] [Google Scholar]
- 21.Claudon M., Dietrich C.F., Choi B.I., et al. Guidelines and good clinical practice recommendations for Contrast Enhanced Ultrasound (CEUS) in the liver - update 2012: A WFUMB-EFSUMB initiative in cooperation with representatives of AFSUMB, AIUM, ASUM, FLAUS and ICUS. Ultrasound Med. Biol. 2013;39(2):187–210. doi: 10.1016/j.ultrasmedbio.2012.09.002. [DOI] [PubMed] [Google Scholar]
- 22.Wong R.J., Ahmed A., Gish R.G. Elevated alpha-fetoprotein: differential diagnosis-hepatocellular carcinoma and other disorders. Clin. Liver Dis. 2015;19(2):309–323. doi: 10.1016/j.cld.2015.01.005. [DOI] [PubMed] [Google Scholar]
- 23.Bruix J., Sherman M. American association for the study of liver diseases. Management of hepatocellular carcinoma: an update. Hepatology. 2011;53(3):1020–1022. doi: 10.1002/hep.24199. [DOI] [PMC free article] [PubMed] [Google Scholar]
- 24.Malek N.P., Schmidt S., Huber P., Manns M.P., Greten T.F. The diagnosis and treatment of hepatocellular carcinoma. Gastroenterology. 2014;111(7):101–106. doi: 10.3238/arztebl.2014.0101. [DOI] [PMC free article] [PubMed] [Google Scholar]
- 25.Rich N., Singal A.G. Hepatocellular carcinoma tumour markers: current role and expectations. Best Pract. Res. Clin. Gastroenterol. 2014;28(5):843–853. doi: 10.1016/j.bpg.2014.07.018. [DOI] [PubMed] [Google Scholar]
- 26.Simpson H.N., McGuire B.M. Screening and detection of hepatocellular carcinoma. Clin. Liver Dis. 2015;19(2):295–307. doi: 10.1016/j.cld.2015.01.004. [DOI] [PubMed] [Google Scholar]
- 27.Leerapun A., Suravarapu S.V., Bida J.P., et al. The utility of Lens culinaris agglutinin-reactive alpha-fetoprotein in the diagnosis of hepatocellular carcinoma: evaluation in a United States referral population. Clin. Gastroenterol. Hepatol. 2007;5(3):394–402. doi: 10.1016/j.cgh.2006.12.005. [DOI] [PMC free article] [PubMed] [Google Scholar]
- 28.Hu B., Tian X., Sun J., Meng X. Evaluation of Individual and Combined Applications of Serum Biomarkers for Diagnosis of Hepatocellular Carcinoma: A Meta-Analysis. Int. J. Mol. Sci. 2013;14(12):23559–23580. doi: 10.3390/ijms141223559. [DOI] [PMC free article] [PubMed] [Google Scholar]
- 29.Marrero J.A., Su G.L., Wei W., et al. Des-gamma carboxyprothrom-bin can differentiate hepatocellular carcinoma from nonmalignant chronic liver disease in American patients. Hepatology. 2003;37(5):1114–1121. doi: 10.1053/jhep.2003.50195. [DOI] [PubMed] [Google Scholar]
- 30.Malaguarnera G., Giordano M., Paladina I., Berretta M., Cappellani A., Malaguarnera M. Serum markers of hepatocellular carcinoma. Dig. Dis. Sci. 2010;55(10):2744–2755. doi: 10.1007/s10620-010-1184-7. [DOI] [PubMed] [Google Scholar]
- 31.International Consensus Group for Hepatocellular Neoplasia The International Consensus Group for Hepatocellular Neoplasia. Pathologic diagnosis of early hepatocellular carcinoma: a report of the international consensus group for hepatocellular neoplasia. Hepatology. 2009;49(2):658–664. doi: 10.1002/hep.22709. [DOI] [PubMed] [Google Scholar]
- 32.Bruix J., Sherman M., Llovet J.M., et al. Clinical management of hepatocellular carcinoma. Conclusions of the Barcelona-2000 EASL Conference. J. Hepatol. 2001;35:421–430. doi: 10.1016/s0168-8278(01)00130-1. [DOI] [PubMed] [Google Scholar]
- 33.Bruix J., Sherman M., Practice Guidelines Committee American Association for the Study of Liver Diseases. Management of hepatocellular carcinoma. Hepatology. 2005;42(5):1208–1236. doi: 10.1002/hep.20933. [DOI] [PubMed] [Google Scholar]
- 34.Luca A., Caruso S., Milazzo M., et al. Multidetector-row computed tomography (MDCT) for the diagnosis of hepatocellular carcinoma in cirrhotic candidates for liver transplantation: prevalence of radiological vascular patterns and histological correlation with liver explants. Eur. Radiol. 2010;20(4):898–907. doi: 10.1007/s00330-009-1622-0. [DOI] [PubMed] [Google Scholar]
- 35.Hanna R.F., Aguirre D.A., Kased N., Emery S.C., Peterson M.R., Sirlin C.B. Cirrhosis-associated hepatocellular nodules: correlation of histopathologic and MR imaging features. Radiographics. 2008;28:747–769. doi: 10.1148/rg.283055108. [DOI] [PubMed] [Google Scholar]
- 36.Rao P.N. Nodule in Liver: Investigations, Differential Diagnosis and Follow-up. J. Clin. Exp. Hepatol. 2014;4(Suppl. 3):57–62. doi: 10.1016/j.jceh.2014.06.010. [DOI] [PMC free article] [PubMed] [Google Scholar]
- 37.Bolondi L1 Characterization of small nodules in cirrhosis by assessment of vascularity: the problem of hypovascular hepatocellular carcinoma. Hepatology. 2005;42(1):27–34. doi: 10.1002/hep.20728. [DOI] [PubMed] [Google Scholar]
- 38.Kim S.H., Kim S.H., Lee J., et al. Gadoxetic acid-enhanced MRI versus triple-phase MDCT for the preoperative detection of hepatocellular carcinoma. AJR Am. J. Roentgenol. 2009;192(6):1675–1681. doi: 10.2214/AJR.08.1262. [DOI] [PubMed] [Google Scholar]
- 39.Szurowska E., Tomicka-Szymanska B., Zadrozny D., et al. Magnetic resonance imaging with new hepatocyte-selective contrast enhancement (gadoxetic acid) in the differential diagnosis of focal liver lesions: work in progress. Exp Clin Hepatol. 2008;4(2):75–82. [Google Scholar]
- 40.Kogita S., Imai Y., Okada M., et al. Gd-EOB-DTPAenhanced magnetic resonance images of hepatocellular carcinoma: correlation with histological grading and portal blood flow. Eur. Radiol. 2010;20:2405–2413. doi: 10.1007/s00330-010-1812-9. [DOI] [PubMed] [Google Scholar]
- 41.Reimer P., Rummeny E.J., Shamsi K., et al. Phase II clinical evaluation of Gd-EOB-DTPA: dose, safety aspects, and pulse sequence. Radiology. 1996;199:177–183. doi: 10.1148/radiology.199.1.8633143. [DOI] [PubMed] [Google Scholar]
- 42.Kitao A., Zen Y., Matsui O., et al. Hepatocellular carcinoma: signal intensity at gadoxetic acid–enhanced MR imaging - correlation with molecular transporters and histopathologic features. Radiology. 2010;256:817–826. doi: 10.1148/radiol.10092214. [DOI] [PubMed] [Google Scholar]
- 43.Narita M., Hatano E., Arizono S., et al. Expression of OATP1B3 determines uptake of Gd-EOBDTPA in hepatocellular carcinoma. J. Gastroenterol. 2009;44:793–798. doi: 10.1007/s00535-009-0056-4. [DOI] [PubMed] [Google Scholar]
- 44.Frericks B.B., Loddenkemper C., Huppertz A., et al. Qualitative and quantitative evaluation of hepatocellular carcinoma and cirrhotic liver enhancement using Gd-EOB-DTPA. AJR Am. J. Roentgenol. 2009;193:1053–1060. doi: 10.2214/AJR.08.1946. [DOI] [PubMed] [Google Scholar]
- 45.Piana G., Trinquart L., Meskine N., Barrau V., Beers B.V., Vilgrain V. New MR imaging criteria with a diffusion-weighted sequence for the diagnosis of hepatocellular carcinoma in chronic liver diseases. J. Hepatol. 2011;55(1):126–132. doi: 10.1016/j.jhep.2010.10.023. [DOI] [PubMed] [Google Scholar]
- 46.Xu P.J., Yan F.H., Wang J.H., Shan Y., Ji Y., Chen C.Z. Contribution of diffusion-weighted magnetic resonance imaging in the characterization of hepatocellular carcinomas and dysplastic nodules in cirrhotic liver. J. Comput. Assist. Tomogr. 2010;34(4):506–512. doi: 10.1097/RCT.0b013e3181da3671. [DOI] [PubMed] [Google Scholar]
- 47.Kudo M., Izumi N., Kokudo N., et al. Consensus-Based Clinical Practice Guidelines proposed by the Japan Society of Hepatology (JSH) 2010 updated version. Dig. Dis. 2011;29(3):339–364. doi: 10.1159/000327577. [DOI] [PubMed] [Google Scholar]
- 48.American College of Radiology (ACR) Liver Imaging Reporting and Data System (LI-RADS) 2014. Available from: http://www. acr.org/Quality-Safety/Resources/LIRADS. [Accessed on: 2015 April 26]. 2014.


