Abstract
Background
The aim of this study was to explore the relationship between physical performance and BMI (body mass index) of university students in China.
Material/Methods
We conducted a cross-sectional study evaluating the physical performance and BMI of university students. BMI was calculated based on height and weight. Overweight and obesity were defined by the Working Group on Obesity references in China.
Results
A total of 2313 participants (978 males and 1335 females) were recruited in our study. The mean value of the 50-meter dash and standing long jump in male students was higher than in female students (P<0.05). The overall prevalences of overweight (including obesity) and obesity for male students were 17.9% and 4.2%, respectively, and 5.1% and 0.5%, respectively, for female university students. BMI was weakly positively associated with the 50-meter dash score, but was negatively associated with the score for standing long jump and pull-ups.
Conclusions
Our study suggested that overweight and obesity are associated with physical performance of university students, especially in male students. University students should exercise more to improve physical health.
MeSH Keywords: Motor Activity; Obesity; Students, Medical
Background
The prevalence of underweight in university students is still high [1]. Overweight poses health risks to university students, such as high blood pressure [2], psychosocial stress [3], adverse cardiovascular outcomes [4], and forced vital capacity [5,6].
Some researcher found that BMI was a predictor of good physical function, with underweight was more of a limiting factor than overweight [7]. Another study by Leyk et al. [8] also revealed that body weight increases and fitness decreases in non-obese young adults in Germany.
In the current study, we aimed to explore whether a relationship exists between physical performance and BMI among university students.
Material and Methods
Participants
A school-based study was performed for university students who underwent physical fitness testing in 2012. A physical performance test was administered as part of an exercise class. Participants were 2313 subjects (978 male and 1335 female) aged 19–23 years. Written informed consent was obtained from all participants, and the study was approved by the local Ethics Committee.
Physical-fitness-test
All students performed the standing long jump 3 times, and the best result was recorded. We also recorded the time for the 50-meter dash for all students, as well as the number of pull-ups for male students and number of sit-ups for female students. Abdominal strength was assessed using a 60-second sit-up test.
Anthropometric measurements
Based on a previous study [5], we performed anthropometric measurements and defined overweight and obesity.
Statistical analysis
R was used for describing physical performance and BMI of university students. Analysis of variance was used for comparison of physical performance among different variables. The distribution of body type between male and female students was compared using the chi-square test. P values less than 0.05 were considered as statistically significant. A bar graph was draw for the physical performance among body types in university students.
Results
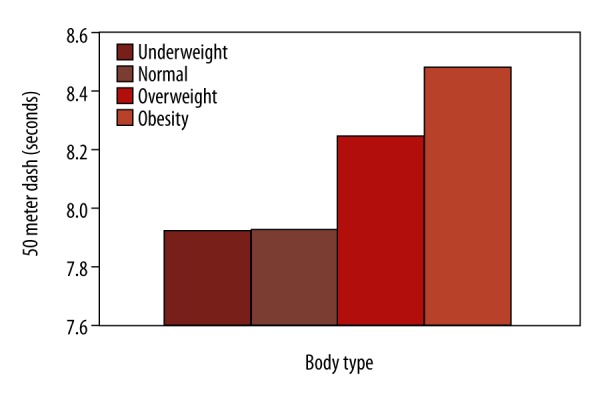
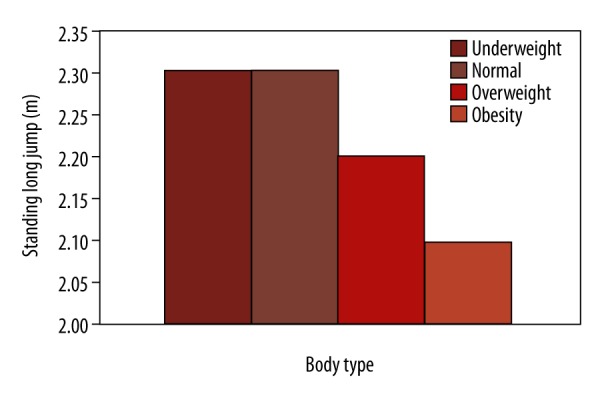
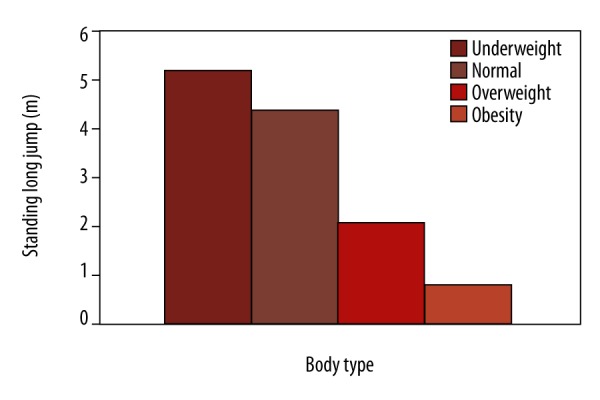
A total of 2313 participants (978 males and 1335 females) ages 19–23 years were enrolled in our study. The mainly characteristics of subjects are shown in Table 1. Table 2 shows a comparison of measurement values for physical performance between male and female students. The measurement value of 50-meter dash and standing long jump in male students was higher than in female students (P<0.05). Tables 3 and 4 show that there was no difference for measurement value of physical performance among different ages by sex. Tables 5 and 6 compare measurement values for physical performance among different body types by sex. A significant difference was found for physical performance among different body types in male students but not in female students (Figures 1–3). Table 7 shows the prevalence of underweight, overweight, and obesity of university students. The overall prevalences of underweight, overweight (including obesity), and obesity for male university students were 13.6%, 17.9%, and 4.2%, respectively; and for female university students they were 27.5%, 5.1%, and 0.5%, respectively. BMI was positively associated with the 50-meter dash score and negatively associated with the standing long jump and pull-up scores (Table 8).
Table 1.
Character of included subjects.
| Variable | Frequency | Percent | |
|---|---|---|---|
| Gender | Male | 978 | 42.30 |
| Female | 1335 | 57.70 | |
| Age (year) | 19 | 162 | 7.00 |
| 20 | 720 | 31.10 | |
| 21 | 845 | 36.50 | |
| 22 | 442 | 19.10 | |
| 23 | 144 | 6.20 | |
| Body type | Underweight | 505 | 21.80 |
| Normal | 1564 | 67.60 | |
| Overweight | 196 | 8.50 | |
| Obesity | 48 | 2.10 |
Table 2.
Comparison of measurement value for physical performance between male and female students.
| Variable | Male | Female | t | P | ||
|---|---|---|---|---|---|---|
| Mean | SD | Mean | SD | |||
| 50 meter dash (second) | 7.99 | 1.21 | 9.83 | 1.10 | 37.80 | 0.00 |
| Standing long jump (meter) | 2.28 | 0.21 | 1.68 | 0.17 | 75.80 | 0.00 |
Table 3.
Measurement value of physical performance among different age in male students.
| Variable | Mean | SD | Minimum | Maximum | |
|---|---|---|---|---|---|
| 50 meter dash (seconds) | 19 | 7.91 | 1.178 | 6.20 | 13.00 |
| 20 | 7.97 | 1.16 | 6.00 | 14.00 | |
| 21 | 7.96 | 1.12 | 6.20 | 13.40 | |
| 22 | 8.06 | 1.44 | 6.50 | 18.90 | |
| 23 | 8.15 | 1.31 | 6.50 | 14.00 | |
| Total | 7.99 | 1.21 | 6.00 | 18.90 | |
| Standing long jump (meter) | 19 | 2.26 | 0.22 | 1.72 | 2.80 |
| 20 | 2.28 | 0.21 | 1.60 | 2.82 | |
| 21 | 2.29 | 0.20 | 1.60 | 2.78 | |
| 22 | 2.28 | 0.22 | 1.20 | 2.70 | |
| 23 | 2.28 | 0.21 | 1.38 | 2.62 | |
| Total | 2.28 | 0.21 | 1.20 | 2.82 | |
| Pull-up | 19 | 4.02 | 3.89 | 0.00 | 24.00 |
| 20 | 3.47 | 3.32 | 0.00 | 20.00 | |
| 21 | 3.89 | 3.41 | 0.00 | 22.00 | |
| 22 | 4.81 | 4.59 | 0.00 | 45.00 | |
| 23 | 5.32 | 3.82 | 0.00 | 14.00 | |
| Total | 4.03 | 3.74 | 0.00 | 45.00 |
Table 4.
Measurement value of physical performance among different age in female students.
| Variable | Mean | SD | Minimum | Maximum | |
|---|---|---|---|---|---|
| 50 meter dash (seconds) | 19 | 9.81 | 1.04 | 7.90 | 14.30 |
| 20 | 9.87 | 1.16 | 6.20 | 14.20 | |
| 21 | 9.78 | 1.07 | 7.10 | 15.00 | |
| 22 | 9.84 | 1.08 | 7.70 | 14.30 | |
| 23 | 9.87 | 1.21 | 8.30 | 15.00 | |
| Total | 9.83 | 1.10 | 6.20 | 15.00 | |
| Standing long jump (meter) | 19 | 1.63 | 0.17 | 1.10 | 2.05 |
| 20 | 1.68 | 0.17 | 1.03 | 2.52 | |
| 21 | 1.68 | 0.18 | 0.95 | 2.46 | |
| 22 | 1.69 | 0.16 | 1.00 | 2.18 | |
| 23 | 1.70 | 0.14 | 1.35 | 1.98 | |
| Total | 1.68 | 0.17 | 0.95 | 2.52 | |
| Sit-ups | 19 | 26.52 | 7.01 | 0.00 | 40.00 |
| 20 | 26.82 | 7.31 | 0.00 | 48.00 | |
| 21 | 27.10 | 7.27 | 0.00 | 50.00 | |
| 22 | 26.45 | 6.48 | 6.00 | 44.00 | |
| 23 | 24.94 | 7.82 | 0.00 | 37.00 | |
| Total | 26.72 | 7.16 | 0.00 | 50.00 |
Table 5.
Comparison measurement value of physical performance among different body types in male students.
| Variable | Mean | SD | Minimum | Maximum | |
|---|---|---|---|---|---|
| 50 meter dash (seconds) | Underweight | 7.92 | 1.00 | 6.20 | 12.00 |
| Normal | 7.93 | 1.26 | 6.00 | 18.90 | |
| Overweight | 8.24 | 1.22 | 6.50 | 14.00 | |
| Obesity | 8.48 | 0.89 | 7.20 | 11.30 | |
| Total | 7.99 | 1.21 | 6.00 | 18.90 | |
| Standing long jump (meter) | Underweight | 2.30 | 0.19 | 1.82 | 2.82 |
| Normal | 2.30 | 0.20 | 1.20 | 2.80 | |
| Overweight | 2.20 | 0.21 | 1.60 | 2.74 | |
| Obesity | 2.07 | 0.24 | 1.38 | 2.48 | |
| Total | 2.28 | 0.21 | 1.20 | 2.82 | |
| Pull-ups | Underweight | 5.20 | 3.97 | 0.00 | 24.00 |
| Normal | 4.39 | 3.77 | 0.00 | 45.00 | |
| Overweight | 2.07 | 2.28 | 0.00 | 10.00 | |
| Obesity | 0.76 | 1.68 | 0.00 | 8.00 | |
| Total | 4.03 | 3.73 | 0.00 | 45.00 |
Table 6.
Comparison measurement value of physical performance among different body type in female students.
| Variable | Mean | SD | Minimum | Maximum | |
|---|---|---|---|---|---|
| 50 meter dash (seconds) | Underweight | 9.84 | 1.12 | 7.10 | 15.00 |
| Normal | 9.81 | 1.11 | 6.20 | 15.00 | |
| Overweight | 10.02 | 1.00 | 8.30 | 14.00 | |
| Obesity | 9.73 | 0.72 | 8.70 | 10.60 | |
| Total | 9.83 | 1.10 | 6.20 | 15.00 | |
| Standing long jump (meter) | Underweight | 1.70 | 0.17 | 1.00 | 2.12 |
| Normal | 1.68 | 0.17 | 0.95 | 2.52 | |
| Overweight | 1.62 | 0.17 | 1.20 | 1.97 | |
| Obesity | 1.65 | 0.25 | 1.10 | 1.84 | |
| Total | 1.68 | 0.17 | 0.95 | 2.52 | |
| Sit-ups | Underweight | 26.48 | 7.16 | 0.00 | 45.00 |
| Normal | 26.98 | 7.12 | 0.00 | 50.00 | |
| Overweight | 24.37 | 6.75 | 0.00 | 36.00 | |
| Obesity | 26.86 | 12.71 | 0.00 | 38.00 | |
| Total | 26.72 | 7.16 | 0.00 | 50.00 |
Figure 1.

Comparison of measurement values for 50-meter dash among students with different body types.
Figure 2.

Comparison of measurement values of standing long jump for male students with different body types.
Figure 3.

Comparison of measurement values of pull-ups for male students with different body types.
Table 7.
Proportion of body type by gender.
| Body type | Male | Female | Chi-square | P | ||
|---|---|---|---|---|---|---|
| Frequency | Percent | Frequency | Percent | |||
| Underweight | 133 | 13.60 | 372 | 27.90 | ||
| Normal | 670 | 68.50 | 894 | 67.00 | 144.06 | 0.00 |
| Overweight | 134 | 13.70 | 62 | 4.60 | ||
| Obesity | 41 | 4.20 | 7 | 0.50 | ||
Table 8.
Correlation of physical performance and BMI.
| Physical performance item | BMI | ||
|---|---|---|---|
| r | P | ||
| Male | 50 meter dash (seconds) | 0.09 | 0.00 |
| Standing long jump (meter) | −027 | 0.00 | |
| Pull-ups | −0.33 | 0.00 | |
| Female | 50 meter dash (seconds) | 0.00 | 0.97 |
| Standing long jump (meter) | −0.03 | 0.30 | |
| Sit-up | −0.01 | 0.78 | |
Discussions
The present study shows that the higher overall prevalence of underweight, overweight (including obesity), and obesity of university students still exists. BMI was weakly positively associated with the 50-meter dash score, but was negatively associated with the standing long jump and pull-up scores.
We also found that the measurement value of 50-meter dash and standing long jump in male students was higher than in female students (P<0.05). Subgroup analysis found significant differences for measurement value of physical performance among different body types in male students but not in female students. The possible reason may be that the relationship between physical performance and BMI can vary by sex. Although some researcher found males had a worse physical fitness than females, comparison between males and females is difficult due to innate physiological differences. Although students of medicine and related disciplines are aware of the importance of proper diet and adequate levels of PA in health, they did not translate theory into practice [9].
There are also some shortcomings in the present study. We did not control for possible confounding factor such as diet and behavior. Exclusion of individuals who were unable to complete the test may have led to bias. School-based studies cannot confirm a causal link between physical performance and BMI. Measurement of physical performance, height, and weight is easy and safe, and is also widely used worldwide.
Conclusions
Our study suggests that overweight and obesity have an influence on physical performance of university students, especially in male students. University students should perform adequate exercise to improve physical health.
Footnotes
Conflict of interest
None declared.
Source of support: This study was supported by the Humanities and Social Science Research Youth Fund project of the Ministry of Education (No. 15YJC 890050)
References
- 1.Zhang YX, Wang SR, Zhao JS, Chu ZH. Prevalence of overweight and central obesity and their relationship with blood pressure among college students in Shandong, China. Blood Press Monit. 2016;21(4):251–54. doi: 10.1097/MBP.0000000000000189. [DOI] [PubMed] [Google Scholar]
- 2.Zhang YX, Zhao JS, Chu ZH. Children and adolescents with low body mass index but large waist circumference remain high risk of elevated blood pressure. Int J Cardiol. 2016;215:23–25. doi: 10.1016/j.ijcard.2016.04.040. [DOI] [PubMed] [Google Scholar]
- 3.Yamamoto K, Okazaki A, Ohmori S. The relationship between psychosocial stress, age, BMI, CRP, lifestyle, and the metabolic syndrome in apparently healthy subjects. J Physiol Anthropol. 2011;30:15–22. doi: 10.2114/jpa2.30.15. [DOI] [PubMed] [Google Scholar]
- 4.Wirtz PH, Ehlert U, Emini L, Suter T. Higher body mass index (BMI) is associated with reduced glucocorticoid inhibition of inflammatory cytokine production following acute psychosocial stress in men. Psychoneuroendocrinology. 2008;33:1102–10. doi: 10.1016/j.psyneuen.2008.05.002. [DOI] [PubMed] [Google Scholar]
- 5.Sun X, Chen X. The relationship between obesity and forced vital capacity among university students. Nutr Hosp. 2015;31:2202–4. doi: 10.3305/nh.2015.31.5.8650. [DOI] [PubMed] [Google Scholar]
- 6.Fukahori S, Matsuse H, Takamura N, et al. Body mass index correlated with forced expiratory volume in 1 second/forced vital capacity in a population with a relatively low prevalence of obesity. Chin Med J (Engl) 2010;123:2792–96. [PubMed] [Google Scholar]
- 7.Ferreira RS, da Silva Coqueiro R, Barbosa AR, et al. Relationship between BMI and physical performance among older adults. Geriatr Nurs. 2013;34:465–68. doi: 10.1016/j.gerinurse.2013.07.013. [DOI] [PubMed] [Google Scholar]
- 8.Leyk D, Rohde U, Gorges W, et al. Physical performance, body weight and BMI of young adults in Germany 2000–2004: Results of the physical-fitness-test study. Int J Sports Med. 2006;27:642–47. doi: 10.1055/s-2005-872907. [DOI] [PubMed] [Google Scholar]
- 9.Dayi A, Acikgoz A, Guvendi G, et al. Determination of factors affecting physical activity status of university students on a health sciences campus. Med Sci Monit. 2017;23:325–34. doi: 10.12659/MSM.899816. [DOI] [PMC free article] [PubMed] [Google Scholar]


