

Abstract
Physical activity is known as an effective strategy for prevention and treatment of Type 2 Diabetes. The aim of this work was to compare the effects of a traditional Moderate Intensity Continuous Training (MICT) with a High Intensity Interval Training (HIIT) on glucose metabolism and mitochondrial function in diabetic mice. Diabetic db/db male mice (N = 25) aged 6 weeks were subdivided into MICT, HIIT or control (CON) group. Animals in the training groups ran on a treadmill 5 days/week during 10 weeks. MICT group ran for 80 min (0° slope) at 50–60% of maximal speed (Vmax) reached during an incremental test. HIIT group ran thirteen times 4 minutes (20° slope) at 85–90% of Vmax separated by 2-min-rest periods. HIIT lowered fasting glycaemia and HbA1c compared with CON group (p < 0.05). In all mitochondrial function markers assessed, no differences were noted between the three groups except for total amount of electron transport chain proteins, slightly increased in the HIIT group vs CON. Western blot analysis revealed a significant increase of muscle Glut4 content (about 2 fold) and higher insulin-stimulated Akt phosphorylation ratios in HIIT group. HIIT seems to improve glucose metabolism more efficiently than MICT in diabetic mice by mechanisms independent of mitochondrial adaptations.
Introduction
Overall, physical activity appears as an effective strategy in both prevention and treatment of Type 2 Diabetes (T2D)1. Numerous studies have shown improved insulin sensitivity, glucose tolerance and long term glucose control following exercise training interventions2–4, and current guidelines from the major international scientific organizations regarding prescriptions of aerobic training in T2D now recommend 150 min of moderate to vigorous intensity exercise weekly5. Nevertheless, long-term adherence to physical activity in individuals with T2D is problematic6. Moreover, some studies have reported resistance to the beneficial effects of exercise in some individuals7. Therefore, identification of physical activity modalities displaying higher adherence and/or efficiency is a major challenge to improve health benefits in individuals with T2D.
It has been demonstrated that high-intensity interval training (HIIT) can improve patient adherence to physical activity8, 9, and numerous recent studies have also shown improvements in glycaemic control following HIIT10–19. The effects of HIIT on blood glucose could be partly mediated by improved skeletal muscle mitochondrial function, as it has been suggested by some authors20. HIIT seems indeed to be a strong activator of mitochondrial biogenesis and this effect could be mediated by stimulation of PGC1-α expression21–24. Mitochondrial impairment has been linked to insulin resistance25, and consequently, improvement of mitochondrial function may restore skeletal muscle insulin signalling26. To date, no study has compared the effects of HIIT vs. the traditional moderate-intensity continuous training (MICT) on skeletal muscle mitochondrial adaptations in a context of T2D.
Consequently, the aim of this work was to compare the effects of 10 weeks of HIIT and MICT on glycaemic profile, skeletal muscle insulin signalling and mitochondrial function in diabetic mice. We hypothesised that HIIT would lead to greater benefits on glycaemic control due to superior mitochondrial function improvements.
Results
Body composition and indirect calorimetry measurements
No significant effects of training were noted on body weight or fat and lean mass compared with CON (Table 1).
Table 1.
Mice characteristics before and after training.
| CON | MICT | HIIT | p (ANOVA) | |
|---|---|---|---|---|
| N= | 9 | 8 | 8 | |
| Body mass week 10 (g) | 39.89 ± 0.79 | 39.04 ± 1.43 | 35.19 ± 3.19 | 0.232 |
| Fat mass week 1 (% b.w.) | 47.46 ± 0.76 | 46.48 ± 0.74 | 48.96 ± 0.50 | 0.060 |
| Fat mass week 10 (% b.w.) | 52.96 ± 0.78 | 53.11 ± 0.75 | 48.14 ± 4.31 | 0.920 |
| Lean mass week 1 (% b.w.) | 49.66 ± 0.74 | 50.81 ± 0.97 | 48.67 ± 0.54 | 0.250 |
| Lean mass week 10 (% b.w.) | 44.91 ± 0.62 | 44.95 ± 0.66 | 50.27 ± 4.18 | 0.710 |
| Liver mass (g) | 1.70 ± 0.09 | 1.68 ± 0.07 | 1.48 ± 0.07 | 0.093 |
| Liver mass (% b.w.) | 4.27 ± 0.19 | 4.35 ± 0.25 | 4.54 ± 0.06 | 0.875 |
| Gastroc mass (mg) | 51.75 ± 2.80 | 51.50 ± 3.58 | 49.87 ± 4.28 | 0.920 |
| Gastroc mass (% b.w.) | 0.13 ± 0.01 | 0.13 ± 0.01 | 0.15 ± 0.01 | 0.372 |
| Liver TG (nmol/mg) | 47.86 ± 1.68 | 47.65 ± 5.34 | 36.31 ± 4.93 | 0.118 |
Glycaemia and response to starch and insulin tolerance tests
After 10 weeks of training, fasting plasma glucose was significantly lower in HIIT group (18.0 ± 3.0 mmol.l−1) than in MICT group (26.0 ± 1.5 mmol.l−1, p < 0.05) and CON group (30.0 ± 1.5 mmol.l−1, p < 0.01) (Fig. 1a). In accordance with this result, HbA1c level was also significantly reduced in HIIT group (6.0 ± 0.4%) compared with CON group (7.5 ± 0.3%, p < 0.05) (Fig. 1b). Fasting serum insulin levels were not different among the groups (Fig. 1c). Repeated measures ANOVA of ITT (Fig. 1d) and OSTT (Fig. 1e) revealed significant differences between groups at several time points. However, since AUCnet (baseline-corrected) did not differ between groups (not shown), it is concluded that these differences merely reflect differences in fasting glucose levels.
Figure 1.
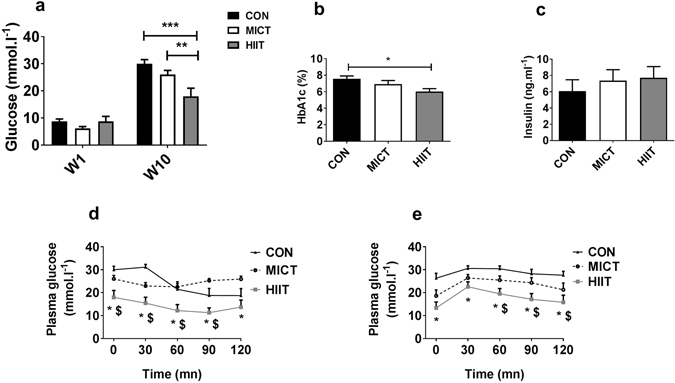
Effects of 10 weeks of MICT or HIIT on fasting blood glucose (a), glycosylated haemoglobin (b), fasting serum insulin (c) and blood glucose response to ITT (d,f) and OSTT (e,g). Data are expressed as means ± SEM. *p < 0.05; **p < 0.01; *Significantly different from CON; $Significantly different from MICT.
Muscle oxidative metabolism
In gastrocnemius, western blot analysis of OXPHOS ETC revealed a modest but significant global increase of the total amount of ETC proteins for HIIT group vs MICT and CON groups (p < 0.0001, Fig. 2b). AMPK is known as an important mediator of mitochondrial adaptations to exercise training, mainly through regulation of PGC1-α27. We found here that p-AMPK Thr172/AMPK ratio was unaffected by exercise (Fig. 2c). OXPHOS ETC, AMPK and p-AMPK full-length blots are presented in Supplementary Figure S1. In accordance, no effects of exercise training were seen on mRNA levels of PGC1-α, or other known regulators of mitochondrial biogenesis (Tfam, PPAR-α, PPAR-γ, NRF-1; Fig. 2e). Similarly, protein levels of mitofusin-2 (MFN2), a marker of mitochondrial fusion that has been shown to be repressed in diabetic state and increased following exercise28, were not modified by MICT or HIIT protocols (Fig. 2d). MFN2 full-length blots are presented in Supplementary Figure S1. In line with these results regarding mRNA and protein levels of known regulators of mitochondrial function, we did not find any modification in CS and β-HAD activities caused by exercise training (Fig. 3c and d). We also measured leak state (V0) and maximal respiration (Vmax) of gastrocnemius permeabilised fibres during a SUIT protocol corrected for ROX and instrumental background. No differences were seen between groups regarding maximum steady state O2 flux after sequential addition of palmitoylcarnitine and malate (V0 PalC-M), ADP (Vmax PalC-M), pyruvate (Vmax PalC-PM), succinate (Vmax PalC-PMS) and CCCP (ETS) (Fig. 3b).
Figure 2.
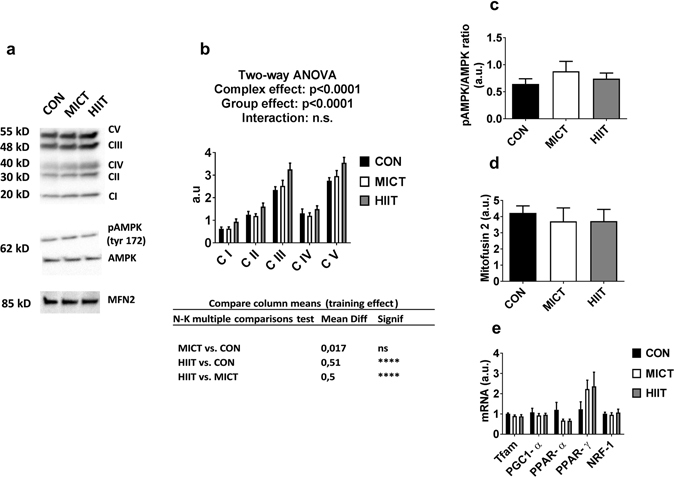
(a) Western blot representative images. The blots were cropped and full length blots are presented in Supplementary Figure S1. (b) ETC protein content assessed by western blot. (c) p-AMPKα Thr172/total-AMPK ratio. (d) Mitofusin levels assessed by western blot. (e) mRNA expression of mitochondrial biogenesis marker genes. Data are expressed as means ± SEM. ****p < 0.0001.
Figure 3.
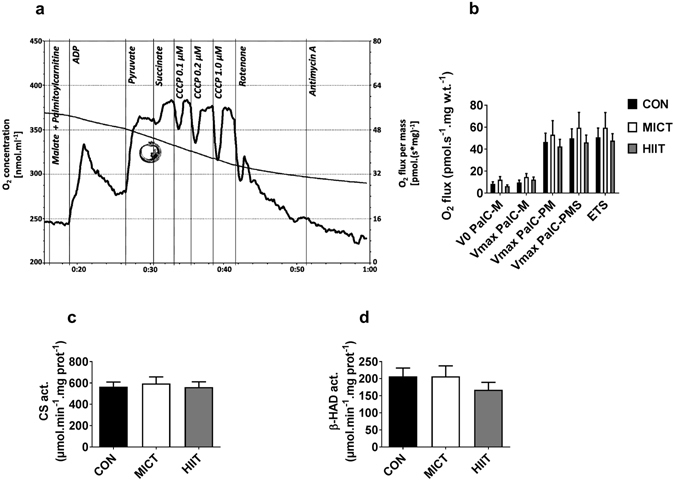
Oxygen concentration and mass-specific oxygen flux as a function of time were recorded in a SUIT protocol with permeablised gastrocnemius. 0.02 mM palmitoyl-carnitine (Pal-C) and 2 mM malate were added in the chambers before the fibres were added. (ADP: 2.5 mM adenosine diphosphate; P: 5 mM pyruvate; S: 10 mM succinate; U: Carbonyl cyanide m-chloro phenyl hydrazine (CCCP); Rot: 0.5 µM; AmA: 2.5 µM Antimycin A). (a) Representative measurement of mitochondrial respiration. (b) Effects of MICT and HITT on mitochondrial respiration. (c) Citrate synthase and (d) β-hydroxyacyl-CoA dehydrogenase activities. Data are expressed as means ± SEM.
Insulin signalling and Glut4 levels in skeletal muscle
Ex vivo basal and insulin-stimulated phosphorylation of Akt on Ser473 and Thr308 were investigated in paired soleus muscles incubated in presence or absence of 12 nM insulin. ANOVA showed a significant effect of exercise training (p < 0.05), and a significant interaction (exercise*insulin, p < 0.05). Post-hoc analysis revealed a higher insulin-stimulated Akt phosphorylation state in HIIT compared with MICT (p < 0.05) and CON (p < 0.05) (Fig. 4a). Glut4 content was significantly higher in HIIT group when compared with CON in gastrocnemius (about 2.5 fold, p < 0.01) and soleus (about 2 fold, p < 0.05) (Fig. 4b and c). Soleus Glut4 content was also increased in HIIT compared with MICT group (Fig. 4c, p < 0.05). All full-length blots are presented in Supplementary Figure S2.
Figure 4.
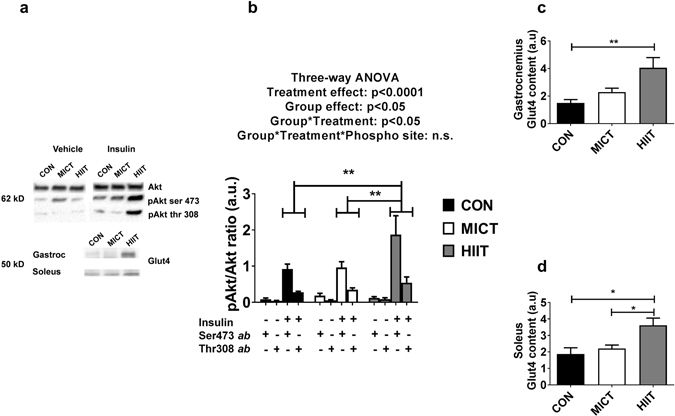
(a) Western Blot representative images. The blots were cropped and full length blots are presented in Supplementary Figure S2. (b) In soleus, phosphorylation ratios of insulin-stimulated Akt ser473/total-Akt and Akt thr 308/total-Akt. Gastrocnemius (c) and soleus (d) Glut4 content assessed by western blot. Data are expressed as means ± SEM. *p < 0.05; **p < 0.01.
Discussion
The results of the present study lead to confirm the hypothesis that HIIT improves glucose metabolism in a superior manner than MICT. We did not observe major changes in the mitochondria in any of the trained groups, suggesting that mitochondrial adaptations were not involved in such effect. Skeletal muscle insulin signalling and Glut4 content were only improved in the HIIT group, suggesting that skeletal muscle insulin sensitivity would be more altered by the effects of HIIT than by those of MICT. This could account for the better improvement of glucose homeostasis following HIIT intervention.
We chose in this work to compare the effects of two exercise training modalities in db/db mice. These animals quickly exhibit massive obesity and develop diabetes because of a mutation in the leptin receptor gene29. In fact, there is no “perfect” model to study T2D. This pathology is very complex, because of the multiplicity of its genetic and environmental determinants30. Therefore, although this db/db monogenic model of diabetes is naturally not representative of all forms of the disease, this animal model is among the most often utilised and widely accepted for treatment testing in diabetes research31. Leptin resistance is a common feature of obesity-related T2D32, and db/db mice represent an interesting model sharing most of metabolic abnormalities observed in human subjects31. Moreover, it has already been demonstrated that mitochondrial adaptations to exercise may be inhibited in the absence of leptin33. In this context, one could hypothesize that mitochondrial adaptations to exercise in the skeletal muscle might be difficult to obtain in db/db mice. Similarly, it has been shown that diabetic patients qualified of “exercise resistant” (e.g. failing to improve HbA1c in response to an exercise training program) display a concomitant incapacity to stimulate mitochondrial biogenesis7, 34. The db/db mouse therefore appears as a good model to study the efficiency of exercise training in a “difficult” context, well representative of “exercise resistant” diabetic patients. However, it would still be interesting to reproduce this protocol in different T2D models without monogenic cause.
We observed lower fasting glycaemia confirmed by lower HbA1c in HIIT group despite the absence of effect on body composition, whereas no improvements were noted in MICT group. To our knowledge, this study was the first to compare HIIT vs MICT in a context of T2D. An overview of the present literature testifies to the difficulty to obtain beneficial changes induced by physical activity in db/db mice. Two research teams have tested HIIT in this model with a similar protocol. Ostler et al. showed modest improvements in glucose tolerance and basal Akt Ser473 phosphorylation35. Stølen et al. noted an improvement in lipid profile36. However, none of these teams showed lower fasting glucose. Among authors having tested more traditional continuous endurance exercise on db/db mice, Lee et al. showed improvements on insulin tolerance37, 38 with no changes on fasting glucose, using a comparable MICT protocol as ours. Other studies on this model have failed to improve glycaemic control with such a protocol39–41. Therefore, our study confirms that exercise-training adaptations regarding glucose homeostasis are difficult to obtain in db/db mice, reinforcing the idea that these animals could be used as an “exercise resistance” model. Interestingly, positive effects of HIIT on glucose homeostasis were found in this context. These results strengthen the interest to study the effects of HIIT in diabetic context and highlight this exercise modality as a candidate to overpass the exercise-resistant state.
Few changes occurred following 10 weeks of HIIT in skeletal muscle mitochondrial parameters. We solely noted an increase in the total amount of ETC proteins, with no incidence on functional oxidative capacity assessed through ex vivo permeabilised fibres respiration. Accordingly, CS and β-HAD activities, like mRNA expression of genes related to mitochondrial biogenesis, were also left unaffected by HIIT or MICT. In wild-type mice, chronic exercise is a well-known activator of AMPK, which in turn triggers mitochondrial biogenic response through PGC1-α induction33. This mechanism has also been confirmed in humans42. These new data show that this mutant model of T2D mice did not respond to stimulatory effects of chronic exercise in any of these parameters, suggesting that some step of the signalling pathway might be defective. As it has already been suggested in experiments using ob/ob mice, intact leptin signalling might be necessary for exercise-induced adaptation through AMPK and PGC1-α in muscle33, 35, this could therefore explain the nearly absence of mitochondrial adaptation consecutive to exercise training in this work. These results obtained with db/db mice are also consistent with some observations made in humans. Indeed, it has also been demonstrated that the chronic exercise-induced rise in PGC1-α and Mfn2 is sometimes abolished in young type 2 diabetic subjects43. It is important to specify that all the experiments performed on skeletal muscle in the present study have been realised in tissues harvested 72 h after the last exercise session, to avoid the potential confounding effects of acute exercise44. Therefore, we cannot rule out the possibility that transient elevation of AMPK activation and PGC1-α induction may have occurred following each training session. Such effect could explain the slight increase in the amount of ETC proteins following HIIT. Nevertheless, the fact that mitochondrial respiration measurements did not exhibit any improvement in the trained groups rather indicates minor or absent functional adaptations of mitochondria following chronic exercise. Overall, these results do not argue the involvement of mitochondrial adaptations in the beneficial effects of HIIT on glycaemic control.
Although it is believed that mitochondrial adaptations may mediate part of the beneficial effects of physical activity in the case of T2D20, the present study suggests that non-mitochondrial-dependent mechanisms could also be involved to explain the improvements in glycaemic control after HIIT intervention. We found a significant increase for insulin-stimulated Akt phosphorylation at Ser473 and Thr308 in HIIT group vs CON. Interestingly, decreased Akt phosphorylation at one or the other of those sites is a hallmark of skeletal muscle insulin signalling defect in T2D45, 46. Therefore, an improvement in this parameter might reflect lower insulin resistance and might partly explain the positive effects of HIIT on fasting blood glucose concentration. Moreover, Glut4 content in soleus and gastrocnemius was significantly increased in HIIT group vs. CON and interestingly, Glut4 seems to be largely involved in whole body glucose homeostasis. Several studies using muscle-specific Glut4 KO mice have shown that Glut4 disruption can lead to hyperglycaemia47 or impaired glucose tolerance in high fat or chow-fed mice48, 49. Likewise, studies dealing with the effect of a single exercise session on Glut4-deficient mice, all converge upon the conclusion that Glut4 is the major factor responsible for exercise-induced glucose uptake50–52. Reciprocally, overexpression of Glut4 in both lean and diabetic db/db mice improved both fasted and fed glycaemia, insulin action, and enhanced disposal of an oral glucose challenge53–56. Interestingly, during acute exercise, mice overexpressing Glut4 seem to preferably utilise carbohydrates over lipids as a fuel source, so that there is no change in overall energy expenditure57. However this statement was challenged by a more recent study using 2-Deoxy-[3H]glucose, which showed no differences between wild type and transgenic mice in muscle glucose uptake during exercise58, suggesting that a normal Glut4 content is sufficient for increased glucose uptake in the muscle, during exercise. In another study, Ikemoto et al. demonstrated that chronic exercise resulted in increased Glut4 protein expression in both control and transgenic mice overexpressing Glut4. The authors showed a concomitant and cumulative improvement in glycaemic control associated with the enhanced Glut4 content, whether be from transgenic manipulation, physical training or both59. Therefore, in the present study, the increase in muscle Glut4 content induced by HIIT is therefore likely to be partly responsible for the improved ability for muscle to uptake blood glucose.
The explanation of the higher benefits of HIIT over MICT regarding improvement of insulin signalling and Glut4 content in skeletal muscle remains unknown. A recent study in healthy and obese mice has evaluated the impact of exercise intensity on the physiological adaptations to exercise training program60. This study showed that higher exercise intensity allowed better improvement of skeletal muscle Glut4 content and glycaemic control in obese animals. Furthermore, some signalling pathways seem particularly sensitive to exercise intensity. For example, Egan et al. have shown in human skeletal muscle that phosphorylation of HDAC, a well-known activator of Glut4 transcription61, was increased following a single bout of exercise at 80% of VO2peak but not after a single bout of exercise at 40% of VO2peak62. Further studies are needed to better understand the molecular mechanisms leading to higher benefits of HIIT over MICT regarding Glut4 and insulin signalling adaptations in db/db mice. Finally, it bears mentioning that exercise is an important stimulus for ATP turnover. In this study, although the duration of the exercise sessions was the same for MICT and HIIT, we were not technically able to assess energy expenditure during training. Thus, we cannot exclude that the higher energy output leading to higher ATP turnover during HIIT may also be a participating factor in the reduced fasting glucose in this group.
In summary, we showed that HIIT allowed a better improvement in glycaemic control than MICT in db/db mice. This effect was not associated with mitochondrial adaptations in the skeletal muscle. HIIT was the only exercise modality to improve skeletal muscle insulin signalling and Glut4 content. Overall, these experiments reinforce the interest of HIIT interventions in diabetic patients. In addition to the claim of better adherence for patients to this modality, HIIT may also exhibit higher beneficial effects on metabolic adaptations. Further studies are needed to confirm these effects and to elucidate the explanatory physiological mechanisms.
Methods
Animals
All methods were carried out in accordance with the guide for the care and use of laboratory animals, Eighth edition (2011). All procedures were approved by local ethic committee (CE2A-02, Auvergne, France). Male db/db (BKS(D)-Leprdb/JOrlRj) aged 5 weeks were obtained from Janvier (JANVIER LABS, France), housed in individual cages with normal 12-h: 12-h light/dark cycles and fed a standard diet (A03 enriched with 3% corn oil, Safe, France). After 1 week of acclimatization, 30 mice out of 46 were selected for the study after a running test and the best runners were randomly divided into control group (CON), MICT and HIIT. After 10 weeks of training, animals were fasted overnight and killed by cervical dislocation before tissues were harvested.
Exercise performance test
The protocol was based on previous published works35, 37, 63 with the following adaptations: The mice from MICT group were placed on the treadmill and warmed up during 5 min at a speed of 6 m/min. Speed was then increased by steps of 2 m/min every 2 min until the mice was unable or unwilling to carry on despite mild stimulation with a wooden cane. Mice in the HIIT group performed an uphill performance test based on a similar protocol on a treadmill set on a 20° incline. Performance tests were carried out at the beginning and after 5 weeks of training in order to re-adjust training intensity.
Exercise training
Chronic exercise protocols were adapted from previous works35–37, with the following modifications: mice in the MICT group ran for 80 min at an intensity of 50–60% (0% slope) of the maximum speed reached during the last exercise performance test. Mice in the HIIT group performed a high intensity interval uphill training which consisted of 13 series alternating between 4 minutes at an intensity corresponding to 85–90% (20° slope) of the maximum speed reached during the last uphill performance test and 2 minutes of rest. To allow for animal acclimatization, exercise intensity was gradually increased over the first 3 weeks at level (0°) or 20° incline in order to reach the objectives described above. Mice assigned to both exercise groups were exposed to 10 weeks of training consisting of treadmill running 5 days per week.
Body composition
Lean mass and fat mass were assessed with an EchoMRI 3-in-1 instrument (Echo Medical Systems, Houston, TX) at the beginning and at the end of the training protocol.
In vivo Oral Starch Tolerance Test (OSTT) and Insulin Tolerance Test (ITT)
OSTT and ITT were performed in vivo at the end of the 10-week training period. Blood glucose was monitored in overnight fasted mice for two hours following an intraperitoneal injection of human insulin (ITT) or an oral gavage of corn starch solution (OSTT). Blood glucose was measured using Accu-Chek Performa (Roche, USA). For ITT, Neutral Protamine Hagedorn Insulin (human NPH insulin) was diluted down to 0.2 U/ml and administered intraperitoneally (2 U/kg BW). For OSTT, the mice were submitted to an oral gavage of 3 g/kg BW of corn starch solution. Blood glucose was measured 30 min, 60 min, 90 min and 120 min after the intervention.
Whole blood and serum parameters
Whole blood was harvested right after the death of the mice and a small portion was collected in an EDTA-treated tube and put on ice until analysis. The rest of the blood was collected in a dry tube and allowed to clot at room temperature for 45 min before being centrifuged for 10 min at 2000 g. Serum was collected and frozen at −80 °C until analysis. Serum insulin level was estimated using mouse ultrasensitive insulin ELISA kit provided by Alpco (Alpco Diagnostics, USA). Whole blood HbA1c level was assessed by enzymatic assay kit provided by Chrystal Chem (USA).
Muscle incubation
Intact Soleus muscles from both legs were dissected and incubated for 30 min in Krebs–Henselheit bicarbonate buffer (NaCl 120 mM, KCl 4.8 mM, NaHCO3 25 mM, KH2PO4 1.2 mM and MgSO4 1.2 mM, pH 7.4), supplemented with 5 mM Hepes, 5 mM glucose and 0.1% BSA64. Gas phase in the medium was maintained at 95% O2–5% CO2. After 30 min of pre-incubation, muscles were transferred into a fresh medium of identical composition in absence or presence of 12 nM insulin and further incubated for 30 min. Samples were then immediately frozen into liquid nitrogen and stored at −80 °C.
Mitochondrial enzymes activities
25 mg of frozen tissue was extracted with a potter in 20 volumes of buffer (KCl 175 mM, EDTA 2 mM, and Triton 100 × 0.1%, pH: 7.4), submitted to 3 freeze-thaw cycles and diluted 5 times in the same buffer. Citrate Synthase (CS) and β-Hydroxyacyl-CoA (β-HAD) activities were then determined according to the methods described by Stephenson et al.65.
High resolution respirometry (HRR)
HRR was performed in an Oxygraph-2k (Oroboros, Austria) according to the recommendations of previous authors66. Briefly, a small amount of gastrocnemius muscle was excised and mechanically separated over ice for a standardised period of 4 min before being chemically permeabilised for 30 min in ice-cold BIOPS added with 50 µg/ml saponin. Tissues were washed with respiration medium (MiR05) before 1 to 3 mg of wet tissue was transferred in a chamber containing 2 ml MiR05 + 20 mM creatine monohydrate. Individual chambers were oxygenated to 450 nmol.ml−1 with pure O2 and calibrated before muscles fibres were added.
Substrate uncoupler inhibitor titration (SUIT) protocol
Palmitoyl-carnitine (0.02 mM) and malate (2 mM) were added to the chambers and the oxygen signal was allowed to stabilise for 5 to 10 min. Gastrocnemius fibres were added and leak state was recorded. ADP (2.5 mM) along with MgCl2 (1.5 mM) was then added into the chambers for fatty-acid stimulated OXPHOS measurement. The rest of SUIT protocol consisted of the sequential recording of plateau O2 consumption for complex I (addition of pyruvate 5 mM), complex I + II (addition of succinate 10 mM), complex II (addition of 0.5 µM rotenone), uncoupled complex II (addition of steps of 0.05 µM Carbonyl cyanide m-chloro phenyl hydrazine (CCCP) until maximal O2 consumption is reached). Residual oxygen consumption (ROX) was then evaluated after the addition of 2.5 µM antimycin. Temperature was maintained at +37 °C and the medium was reoxygenated whenever the O2 level dropped under 250 µM66. Mass-specific O2 flux was determined using DatLab V.6 (Oroboros, Autria) from steady-state O2 flux normalised to tissue wet weight and adjusted for instrumental background.
Blotting
50 mg of frozen tissue was added to 20 volumes of NP-40 buffer (Tris HCl 50 mM, NaCl 150 mM, NaF 1 mM, Na3VO4 1 mM, Nonidet P-40 1%, Sodium deoxycholate 0.25%, pH: 7.4) supplemented with freshly added protease inhibitor cocktail (P8340, Sigma Aldrich) and phosphatase inhibitor tablets (#88667 Thermo Fisher Scientific, USA). The tissues were homogenised on ice using a glass potter before samples were centrifuged at 14000 g for 10 min (+4 °C) and the supernatant was collected. The protein content of the supernatant was determined using a commercial DC protein assay (Bio-Rad, USA) and all samples were subsequently diluted to a standard concentration and diluted with 2X Laemmli buffer.
Blotting was performed as described by Ennequin et al.67, with the following specificities: membranes were incubated overnight at 4 °C with primary antibodies against AMPKα (D63G4), p-AMPKα Thr172 (40H9), Akt (pan C67E7), p-Akt thr308 (C31E5E), p-Akt ser473 (D9E), all at concentration of 1:1000, purchased from Cell Signaling (USA), Glut4 (IF8) at concentration of 1/200 purchased from Santa Cruz Biotechnology (USA), MFN-2 (NIAR164) at concentration of 1:2000 and OXPHOS Electron Transfer Chain proteins (ETC) at concentration of 1:1000 purchased from Abcam (USA). After incubation, the membranes were washed with TTBS and exposed to appropriate dilutions of anti-species horseradish peroxidase-conjugated secondary antibodies for 1 h at room temperature. Membranes were then washed 3 times in TTBS before being exposed to an enhanced chemiluminescent solution (Clarity Western ECL; Bio-Rad, USA) for 1 min. Membranes where exposed using a Bio-Rad ChemiDoc system, and band densities were determined using image-analysis software (Image Lab V5.0, Bio-Rad, USA). Stain Free® (Bio-Rad, USA) blot image was used as total protein loading control and data was normalised accordingly68.
Quantitative Real-Time PCR
Total RNA was extracted from gastrocnemius tissue using TRIzol® (Invitrogen, Life Technologies). cDNA was synthesised from 2 μg RNA with the High Capacity cDNA transcription kit (Applied Biosystems, Life Technologies). PCR amplification was carried out using the CFX Bio-Rad system with Taqman probes sets (Applied Biosystems, Massachusetts, USA) and the ΔΔCt method was used to quantify mRNA levels. Gene expression was normalised using Gapdh as a housekeeping gene. Data are represented using the Rq which is normalised to the control group or Rq = 2 − ΔΔCt [ΔCt = Ct (target)-Ct (Gapdh); ΔΔCt = ΔCt (sample)-ΔCt (control)].
Statistical analysis
Results are shown as the mean ± SEM. Normality was verified using Kolmogorov-Smirnov’s test. Homogeneity of variance was assessed using Bartlett F test. When both conditions of normality and homogeneity of variance were respected, one-way, two-way, three-way or repeated measures ANOVA were run and a Student-Newman-Keuls post-hoc test was applied when ANOVA reached significance level (p < 0.05). When normality was not respected, a Krustal-Wallis test was run instead of ANOVA. When homogeneity of variance was not respected, ANOVA was run with the Greenhouse-Geisser correction.
Electronic supplementary material
Acknowledgements
The authors wish to thank Mr Mehdi Djelloul-Mazouz and Mr Philippe Denis from INRA Unité de Nutrition Humaine (UNH, UMR 1019), CRNH Auvergne (France) for the care and the attention to the animals. We also thank Mrs Monique Etienne from AME2P Lab (Clermont-Ferrand, France) and Mrs Anne-Sophie Galvardon for their excellent assistance during the experiments.
Author Contributions
V.C. and P.S. designed the research. V.C., L.C., D.D., C.M. and G.D. performed the experiments. Y.F.O. and S.P. provided reagents and technical support. V.C., N.B., Y.F.O. and P.S. analysed the data and wrote the manuscript. All authors revised the manuscript.
Competing Interests
The authors declare that they have no competing interests.
Footnotes
Electronic supplementary material
Supplementary information accompanies this paper at doi:10.1038/s41598-017-00276-8
Publisher's note: Springer Nature remains neutral with regard to jurisdictional claims in published maps and institutional affiliations.
References
- 1.Sanz C, Gautier JF, Hanaire H. Physical exercise for the prevention and treatment of type 2 diabetes. Diabetes Metab. 2010;36:346–351. doi: 10.1016/j.diabet.2010.06.001. [DOI] [PubMed] [Google Scholar]
- 2.Avery L, Flynn D, van Wersch A, Sniehotta FF, Trenell MI. Changing physical activity behavior in type 2 diabetes: a systematic review and meta-analysis of behavioral interventions. Diabetes Care. 2012;35:2681–2689. doi: 10.2337/dc11-2452. [DOI] [PMC free article] [PubMed] [Google Scholar]
- 3.Umpierre D, Ribeiro PA, Schaan BD, Ribeiro JP. Volume of supervised exercise training impacts glycaemic control in patients with type 2 diabetes: a systematic review with meta-regression analysis. Diabetologia. 2013;56:242–251. doi: 10.1007/s00125-012-2774-z. [DOI] [PubMed] [Google Scholar]
- 4.Roberts CK, Little JP, Thyfault JP. Modification of insulin sensitivity and glycemic control by activity and exercise. Med Sci Sports Exerc. 2013;45:1868–1877. doi: 10.1249/MSS.0b013e318295cdbb. [DOI] [PubMed] [Google Scholar]
- 5.American Diabetes Association. Physical Activity/Exercise and Diabetes. Diabetes Care27, s58–s62 (2004).
- 6.Chen Y, Sloan FA, Yashkin AP. Adherence to diabetes guidelines for screening, physical activity and medication and onset of complications and death. J Diabetes Complications. 2015;29:1228–1233. doi: 10.1016/j.jdiacomp.2015.07.005. [DOI] [PMC free article] [PubMed] [Google Scholar]
- 7.Stephens NA, Sparks LM. Resistance to the beneficial effects of exercise in type 2 diabetes: are some individuals programmed to fail? J Clin Endocrinol Metab. 2015;100:43–52. doi: 10.1210/jc.2014-2545. [DOI] [PubMed] [Google Scholar]
- 8.Kong Z, et al. Comparison of High-Intensity Interval Training and Moderate-to-Vigorous Continuous Training for Cardiometabolic Health and Exercise Enjoyment in Obese Young Women: A Randomized Controlled Trial. PLoS One. 2016;11:e0158589. doi: 10.1371/journal.pone.0158589. [DOI] [PMC free article] [PubMed] [Google Scholar]
- 9.Jung ME, Bourne JE, Beauchamp MR, Robinson E, Little JP. High-intensity interval training as an efficacious alternative to moderate-intensity continuous training for adults with prediabetes. J Diabetes Res. 2015;2015:191595. doi: 10.1155/2015/191595. [DOI] [PMC free article] [PubMed] [Google Scholar]
- 10.Francois ME, Little JP. Effectiveness and safety of high-intensity interval training in patients with type 2 diabetes. Diabetes Spectr. 2015;28:39–44. doi: 10.2337/diaspect.28.1.39. [DOI] [PMC free article] [PubMed] [Google Scholar]
- 11.Cassidy S, et al. High intensity intermittent exercise improves cardiac structure and function and reduces liver fat in patients with type 2 diabetes: a randomised controlled trial. Diabetologia. 2016;59:56–66. doi: 10.1007/s00125-015-3741-2. [DOI] [PMC free article] [PubMed] [Google Scholar]
- 12.Denou E, Marcinko K, Surette MG, Steinberg GR, Schertzer JD. High-intensity exercise training increases the diversity and metabolic capacity of the mouse distal gut microbiota during diet-induced obesity. Am J Physiol Endocrinol Metab. 2016;310:E982–993. doi: 10.1152/ajpendo.00537.2015. [DOI] [PMC free article] [PubMed] [Google Scholar]
- 13.Marcinko K, et al. High intensity interval training improves liver and adipose tissue insulin sensitivity. Mol Metab. 2015;4:903–915. doi: 10.1016/j.molmet.2015.09.006. [DOI] [PMC free article] [PubMed] [Google Scholar]
- 14.Madsen SM, Thorup AC, Overgaard K, Jeppesen PB. High Intensity Interval Training Improves Glycaemic Control and Pancreatic beta Cell Function of Type 2 Diabetes Patients. PLoS One. 2015;10:e0133286. doi: 10.1371/journal.pone.0133286. [DOI] [PMC free article] [PubMed] [Google Scholar]
- 15.Fex A, Leduc-Gaudet JP, Filion ME, Karelis AD, Aubertin-Leheudre M. Effect of Elliptical High Intensity Interval Training on Metabolic Risk Factor in Pre- and Type 2 Diabetes Patients: A Pilot Study. J Phys Act Health. 2015;12:942–946. doi: 10.1123/jpah.2014-0123. [DOI] [PubMed] [Google Scholar]
- 16.Shaban N, Kenno KA, Milne KJ. The effects of a 2 week modified high intensity interval training program on the homeostatic model of insulin resistance (HOMA-IR) in adults with type 2 diabetes. J Sports Med Phys Fitness. 2014;54:203–209. [PubMed] [Google Scholar]
- 17.Gillen JB, et al. Acute high-intensity interval exercise reduces the postprandial glucose response and prevalence of hyperglycaemia in patients with type 2 diabetes. Diabetes Obes Metab. 2012;14:575–577. doi: 10.1111/j.1463-1326.2012.01564.x. [DOI] [PubMed] [Google Scholar]
- 18.Trapp EG, Chisholm DJ, Freund J, Boutcher SH. The effects of high-intensity intermittent exercise training on fat loss and fasting insulin levels of young women. Int J Obes (Lond) 2008;32:684–691. doi: 10.1038/sj.ijo.0803781. [DOI] [PubMed] [Google Scholar]
- 19.Steckling, F. M. et al. High Intensity Interval Training Reduces the Levels of Serum Inflammatory Cytokine on Women with Metabolic Syndrome. Exp Clin Endocrinol Diabetes (2016). [DOI] [PubMed]
- 20.Little JP, et al. Low-volume high-intensity interval training reduces hyperglycemia and increases muscle mitochondrial capacity in patients with type 2 diabetes. J Appl Physiol (1985) 2011;111:1554–1560. doi: 10.1152/japplphysiol.00921.2011. [DOI] [PubMed] [Google Scholar]
- 21.Cochran AJ, et al. Intermittent and continuous high-intensity exercise training induce similar acute but different chronic muscle adaptations. Exp Physiol. 2014;99:782–791. doi: 10.1113/expphysiol.2013.077453. [DOI] [PubMed] [Google Scholar]
- 22.Gibala MJ, Little JP, Macdonald MJ, Hawley JA. Physiological adaptations to low-volume, high-intensity interval training in health and disease. J Physiol. 2012;590:1077–1084. doi: 10.1113/jphysiol.2011.224725. [DOI] [PMC free article] [PubMed] [Google Scholar]
- 23.Little JP, Safdar A, Bishop D, Tarnopolsky MA, Gibala MJ. An acute bout of high-intensity interval training increases the nuclear abundance of PGC-1alpha and activates mitochondrial biogenesis in human skeletal muscle. Am J Physiol Regul Integr Comp Physiol. 2011;300:R1303–1310. doi: 10.1152/ajpregu.00538.2010. [DOI] [PubMed] [Google Scholar]
- 24.Hoshino D, Yoshida Y, Kitaoka Y, Hatta H, Bonen A. High-intensity interval training increases intrinsic rates of mitochondrial fatty acid oxidation in rat red and white skeletal muscle. Appl Physiol Nutr Metab. 2013;38:326–333. doi: 10.1139/apnm-2012-0257. [DOI] [PubMed] [Google Scholar]
- 25.Szendroedi J, Phielix E, Roden M. The role of mitochondria in insulin resistance and type 2 diabetes mellitus. Nat Rev Endocrinol. 2011;8:92–103. doi: 10.1038/nrendo.2011.138. [DOI] [PubMed] [Google Scholar]
- 26.Hesselink MK, Schrauwen-Hinderling V, Schrauwen P. Skeletal muscle mitochondria as a target to prevent or treat type 2 diabetes mellitus. Nat Rev Endocrinol. 2016;12:633–645. doi: 10.1038/nrendo.2016.104. [DOI] [PubMed] [Google Scholar]
- 27.Marcinko K, Steinberg GR. The role of AMPK in controlling metabolism and mitochondrial biogenesis during exercise. Exp Physiol. 2014;99:1581–1585. doi: 10.1113/expphysiol.2014.082255. [DOI] [PubMed] [Google Scholar]
- 28.Zorzano A. Regulation of mitofusin-2 expression in skeletal muscle. Appl Physiol Nutr Metab. 2009;34:433–439. doi: 10.1139/H09-049. [DOI] [PubMed] [Google Scholar]
- 29.Boquist L, Hellman B, Lernmark A, Taljedal IB. Influence of the mutation “diabetes” on insulin release and islet morphology in mice of different genetic backgrounds. J Cell Biol. 1974;62:77–89. doi: 10.1083/jcb.62.1.77. [DOI] [PMC free article] [PubMed] [Google Scholar]
- 30.Jin W, Patti ME. Genetic determinants and molecular pathways in the pathogenesis of Type 2 diabetes. Clin Sci (Lond) 2009;116:99–111. doi: 10.1042/CS20080090. [DOI] [PubMed] [Google Scholar]
- 31.Leiter EH. Selecting the “right” mouse model for metabolic syndrome and type 2 diabetes research. Methods Mol Biol. 2009;560:1–17. doi: 10.1007/978-1-59745-448-3_1. [DOI] [PubMed] [Google Scholar]
- 32.Ceddia RB, Koistinen HA, Zierath JR, Sweeney G. Analysis of paradoxical observations on the association between leptin and insulin resistance. FASEB J. 2002;16:1163–1176. doi: 10.1096/fj.02-0158rev. [DOI] [PubMed] [Google Scholar]
- 33.Li L, et al. Mitochondrial biogenesis and peroxisome proliferator-activated receptor-gamma coactivator-1alpha (PGC-1alpha) deacetylation by physical activity: intact adipocytokine signaling is required. Diabetes. 2011;60:157–167. doi: 10.2337/db10-0331. [DOI] [PMC free article] [PubMed] [Google Scholar]
- 34.Stephens NA, et al. A transcriptional signature of “exercise resistance” in skeletal muscle of individuals with type 2 diabetes mellitus. Metabolism. 2015;64:999–1004. doi: 10.1016/j.metabol.2015.06.008. [DOI] [PMC free article] [PubMed] [Google Scholar]
- 35.Ostler JE, et al. Effects of insulin resistance on skeletal muscle growth and exercise capacity in type 2 diabetic mouse models. Am J Physiol Endocrinol Metab. 2014;306:E592–605. doi: 10.1152/ajpendo.00277.2013. [DOI] [PMC free article] [PubMed] [Google Scholar]
- 36.Stolen TO, et al. Interval training normalizes cardiomyocyte function, diastolic Ca2+ control, and SR Ca2+ release synchronicity in a mouse model of diabetic cardiomyopathy. Circ Res. 2009;105:527–536. doi: 10.1161/CIRCRESAHA.109.199810. [DOI] [PubMed] [Google Scholar]
- 37.Lee S, Park Y, Dellsperger KC, Zhang C. Exercise training improves endothelial function via adiponectin-dependent and independent pathways in type 2 diabetic mice. Am J Physiol Heart Circ Physiol. 2011;301:H306–314. doi: 10.1152/ajpheart.01306.2010. [DOI] [PMC free article] [PubMed] [Google Scholar]
- 38.Lee S, Park Y, Zhang C. Exercise Training Prevents Coronary Endothelial Dysfunction in Type 2 Diabetic Mice. Am J Biomed Sci. 2011;3:241–252. doi: 10.5099/aj110400241. [DOI] [PMC free article] [PubMed] [Google Scholar]
- 39.Trask AJ, Delbin MA, Katz PS, Zanesco A, Lucchesi PA. Differential coronary resistance microvessel remodeling between type 1 and type 2 diabetic mice: impact of exercise training. Vascul Pharmacol. 2012;57:187–193. doi: 10.1016/j.vph.2012.07.007. [DOI] [PMC free article] [PubMed] [Google Scholar]
- 40.Broderick TL, Parrott CR, Wang D, Jankowski M, Gutkowska J. Expression of cardiac GATA4 and downstream genes after exercise training in the db/db mouse. Pathophysiology. 2012;19:193–203. doi: 10.1016/j.pathophys.2012.06.001. [DOI] [PubMed] [Google Scholar]
- 41.Sennott J, Morrissey J, Standley PR, Broderick TL. Treadmill exercise training fails to reverse defects in glucose, insulin and muscle GLUT4 content in the db/db mouse model of diabetes. Pathophysiology. 2008;15:173–179. doi: 10.1016/j.pathophys.2008.06.001. [DOI] [PubMed] [Google Scholar]
- 42.Lee-Young RS, Canny BJ, Myers DE, McConell GK. AMPK activation is fiber type specific in human skeletal muscle: effects of exercise and short-term exercise training. J Appl Physiol (1985) 2009;107:283–289. doi: 10.1152/japplphysiol.91208.2008. [DOI] [PubMed] [Google Scholar]
- 43.Hernandez-Alvarez MI, et al. Subjects with early-onset type 2 diabetes show defective activation of the skeletal muscle PGC-1{alpha}/Mitofusin-2 regulatory pathway in response to physical activity. Diabetes Care. 2010;33:645–651. doi: 10.2337/dc09-1305. [DOI] [PMC free article] [PubMed] [Google Scholar]
- 44.Siu PM, Donley DA, Bryner RW, Alway SE. Citrate synthase expression and enzyme activity after endurance training in cardiac and skeletal muscles. Journal of Applied Physiology. 2003;94:555–560. doi: 10.1152/japplphysiol.00821.2002. [DOI] [PubMed] [Google Scholar]
- 45.Karlsson HKR, et al. Insulin-Stimulated Phosphorylation of the Akt Substrate AS160 Is Impaired in Skeletal Muscle of Type 2 Diabetic Subjects. Diabetes. 2005;54:1692–1697. doi: 10.2337/diabetes.54.6.1692. [DOI] [PubMed] [Google Scholar]
- 46.Morino K, et al. Reduced mitochondrial density and increased IRS-1 serine phosphorylation in muscle of insulin-resistant offspring of type 2 diabetic parents. J Clin Invest. 2005;115:3587–3593. doi: 10.1172/JCI25151. [DOI] [PMC free article] [PubMed] [Google Scholar]
- 47.Zisman A, et al. Targeted disruption of the glucose transporter 4 selectively in muscle causes insulin resistance and glucose intolerance. Nat Med. 2000;6:924–928. doi: 10.1038/78693. [DOI] [PubMed] [Google Scholar]
- 48.Kim JK, et al. Glucose toxicity and the development of diabetes in mice with muscle-specific inactivation of GLUT4. J Clin Invest. 2001;108:153–160. doi: 10.1172/JCI10294. [DOI] [PMC free article] [PubMed] [Google Scholar]
- 49.Fam BC, et al. Normal muscle glucose uptake in mice deficient in muscle GLUT4. J Endocrinol. 2012;214:313–327. doi: 10.1530/JOE-12-0032. [DOI] [PubMed] [Google Scholar]
- 50.Howlett KF, Andrikopoulos S, Proietto J, Hargreaves M. Exercise-induced muscle glucose uptake in mice with graded, muscle-specific GLUT-4 deletion. Physiol Rep. 2013;1:e00065. doi: 10.1002/phy2.65. [DOI] [PMC free article] [PubMed] [Google Scholar]
- 51.Zierath JR, et al. Restoration of hypoxia-stimulated glucose uptake in GLUT4-deficient muscles by muscle-specific GLUT4 transgenic complementation. J Biol Chem. 1998;273:20910–20915. doi: 10.1074/jbc.273.33.20910. [DOI] [PubMed] [Google Scholar]
- 52.Ryder JW, et al. Postexercise glucose uptake and glycogen synthesis in skeletal muscle from GLUT4-deficient mice. The FASEB Journal. 1999;13:2246–2256. doi: 10.1096/fasebj.13.15.2246. [DOI] [PubMed] [Google Scholar]
- 53.Gibbs EM, et al. Glycemic improvement in diabetic db/db mice by overexpression of the human insulin-regulatable glucose transporter (GLUT4) Journal of Clinical Investigation. 1995;95:1512–1518. doi: 10.1172/JCI117823. [DOI] [PMC free article] [PubMed] [Google Scholar]
- 54.Brozinick JT, et al. GLUT4 Overexpression in db/db Mice Dose-Dependently Ameliorates Diabetes But Is Not a Lifelong Cure. Diabetes. 2001;50:593–600. doi: 10.2337/diabetes.50.3.593. [DOI] [PubMed] [Google Scholar]
- 55.Leturque A, Loizeau M, Vaulont S, Salminen M, Girard J. Improvement of insulin action in diabetic transgenic mice selectively overexpressing GLUT4 in skeletal muscle. Diabetes. 1996;45:23–27. doi: 10.2337/diab.45.1.23. [DOI] [PubMed] [Google Scholar]
- 56.Ren JM, et al. Overexpression of Glut4 protein in muscle increases basal and insulin-stimulated whole body glucose disposal in conscious mice. J Clin Invest. 1995;95:429–432. doi: 10.1172/JCI117673. [DOI] [PMC free article] [PubMed] [Google Scholar]
- 57.Bao S, Garvey WT. Exercise in transgenic mice overexpressing GLUT4 glucose transporters: effects on substrate metabolism and glycogen regulation. Metabolism. 1997;46:1349–1357. doi: 10.1016/S0026-0495(97)90243-2. [DOI] [PubMed] [Google Scholar]
- 58.Fueger PT, Bracy DP, Malabanan CM, Pencek RR, Wasserman DH. Distributed control of glucose uptake by working muscles of conscious mice: roles of transport and phosphorylation. Am J Physiol Endocrinol Metab. 2004;286:E77–84. doi: 10.1152/ajpendo.00309.2003. [DOI] [PubMed] [Google Scholar]
- 59.Ikemoto S, Thompson KS, Itakura H, Lane MD, Ezaki O. Expression of an insulin-responsive glucose transporter (GLUT4) minigene in transgenic mice: effect of exercise and role in glucose homeostasis. Proc Natl Acad Sci USA. 1995;92:865–869. doi: 10.1073/pnas.92.3.865. [DOI] [PMC free article] [PubMed] [Google Scholar]
- 60.Cunha VN, et al. Role of exercise intensity on GLUT4 content, aerobic fitness and fasting plasma glucose in type 2 diabetic mice. Cell Biochemistry and Function. 2015;33:435–442. doi: 10.1002/cbf.3128. [DOI] [PubMed] [Google Scholar]
- 61.McGee SL, Hargreaves M. Histone modifications and exercise adaptations. J Appl Physiol (1985) 2011;110:258–263. doi: 10.1152/japplphysiol.00979.2010. [DOI] [PubMed] [Google Scholar]
- 62.Egan B, et al. Exercise intensity-dependent regulation of peroxisome proliferator-activated receptor coactivator-1 mRNA abundance is associated with differential activation of upstream signalling kinases in human skeletal muscle. J Physiol. 2010;588:1779–1790. doi: 10.1113/jphysiol.2010.188011. [DOI] [PMC free article] [PubMed] [Google Scholar]
- 63.Kemi OJ, Loennechen JP, Wisloff U, Ellingsen O. Intensity-controlled treadmill running in mice: cardiac and skeletal muscle hypertrophy. J Appl Physiol (1985) 2002;93:1301–1309. doi: 10.1152/japplphysiol.00231.2002. [DOI] [PubMed] [Google Scholar]
- 64.Dardevet D, Sornet C, Balage M, Grizard J. Stimulation of in vitro rat muscle protein synthesis by leucine decreases with age. J Nutr. 2000;130:2630–2635. doi: 10.1093/jn/130.11.2630. [DOI] [PubMed] [Google Scholar]
- 65.Stephenson EJ, et al. Skeletal muscle respiratory capacity is enhanced in rats consuming an obesogenic Western diet. Am J Physiol Endocrinol Metab. 2012;302:E1541–1549. doi: 10.1152/ajpendo.00590.2011. [DOI] [PubMed] [Google Scholar]
- 66.Pesta D, Gnaiger E. High-resolution respirometry: OXPHOS protocols for human cells and permeabilized fibers from small biopsies of human muscle. Methods Mol Biol. 2012;810:25–58. doi: 10.1007/978-1-61779-382-0_3. [DOI] [PubMed] [Google Scholar]
- 67.Ennequin G, et al. Exercise training and return to a well-balanced diet activate the neuregulin 1/ErbB pathway in skeletal muscle of obese rats. J Physiol. 2015;593:2665–2677. doi: 10.1113/JP270026. [DOI] [PMC free article] [PubMed] [Google Scholar]
- 68.Gilda JE, Gomes AV. Western blotting using in-gel protein labeling as a normalization control: stain-free technology. Methods Mol Biol. 2015;1295:381–391. doi: 10.1007/978-1-4939-2550-6_27. [DOI] [PubMed] [Google Scholar]
Associated Data
This section collects any data citations, data availability statements, or supplementary materials included in this article.