

Abstract
Diabetic retinopathy (DR) is a common microvascular complication of diabetes mellitus (DM). The associations of alcohol intake with DR risk have demonstrated contradictory results. Relevant studies were identified by searching electronic databases (Medline, EMBASE and Web of Science) until May 2016. We identified a total of 12,875 DR cases among 37,285 participants in 15 observational studies. The pooled estimation of all the included observational studies was 0.91 (95% CI, 0.79 to 1.06) in a random-effect model. Analyses stratified by study design showed no significant association between alcohol intake and DR incidence in cohort, case control or cross-sectional studies. In the subgroup analyses, neither beer nor spirits intake were associated with DR risk. Furthermore, it was interesting to find that protective effects were detected in the wine (OR = 0.77, 95% CI = 0.64 to 0.92) and sherry (OR = 0.22, 95% CI = 0.05 to 0.95) groups. In conclusion, this current meta-analysis demonstrated that alcohol intake was not associated with risk of DR. Subgroup analysis by alcoholic beverage types showed that wine consumption would reduce the incidence of DR. In the future, more large-scale prospective studies with detailed alcohol subtypes and contents are still warranted to clarify the association.
Introduction
Diabetes mellitus (DM) is now regarded as one of the most challenging public health problems worldwide1. Both the economic burden and loss of health caused by complications of DM indicate the importance of primary prevention and early intervention in the management of DM2, 3. Diabetic retinopathy (DR) is a common microvascular complication of DM and a major preventable cause of visual impairment in the working-age population4. Accordingly, early detection of DR in the DM population is crucial. The mechanisms of DR development and progression are still not fully understood5, 6. Previous epidemiological studies indicated that longer DM duration, older age, aging and cardiovascular events were risk factors for DR incidence7, 8.
Alcohol intake is reported to be a risk factor for several kinds of diseases, including cancers, gastrointestinal diseases, respiratory disorders and infections9–11. A quantitative review of 26 epidemiological studies reported an inverse association between alcohol intake and risk of type 2 DM (T2DM) in a non-linear dose-response manner. It was found that light and moderate alcohol consumption was associated with a lower risk of T2DM, whereas heavy alcohol consumption demonstrated no protective effect against T2DM risk12. Furthermore, in an advanced study, specific types of alcoholic beverage consumption demonstrated modified influences on T2DM risk. In a meta-analysis of 13 prospective studies, compared with beer or spirits, wine was associated with a more significant inverse risk of DM13.
In previous studies, the associations of alcohol intake with DR risk demonstrated contradictory results. Alcohol intake, which was regarded as an unhealthy lifestyle behavior, was previously regarded as a risk factor for DR development14. Cardiovascular events, which were reported to be risk factors for DR, could be prevented by moderate alcohol intake. Moderate alcohol intake was thereby reported to be associated with a decreased risk of DR15. We therefore conducted a systematic review of all observational studies that reported a relationship between alcohol consumption and DR risk. To clarify the detailed effects of alcohol intake on the risk of DR, modified alcohol quantities and specific types of alcoholic beverages were collected. The purpose of this current study was to investigate the association between alcohol intake and DR risk by conducting a meta-analysis of observational studies such as cohort, case control and cross-sectional studies classified by type of study design.
Materials and Methods
This current meta-analysis was conducted following Meta-analysis of Observational Studies in Epidemiology (MOOSE)16 and Preferred Reporting Items for Systematic reviews and Meta-Analysis (PRISMA) guidelines17.
Search Strategy and Selection Criteria
A literature search was conducted by searching three electronic databases, including PubMed, EMBASE and Web of Science, for research published by May 2016. The search strategy combined the keywords and corresponding MeSH terms regarding alcohol intake (alcohol, drink, wine, beer and spirits) and diabetic retinopathy in observational epidemiological studies such as cohort, case control and cross-sectional studies. No restrictions were set in the literature search. Additionally, possible studies were detected by reviewing the references lists of the reviews or articles. When the data we needed was missing in the article, we attempted to contact the corresponding authors for additional information. All the literature searches were conducted by one author and then checked by another author.
The review included observational studies reporting the association between alcohol intake and DR risk. The studies were included when they met the inclusion criteria as follows: (1) consisted of cohort, case control or cross-sectional design; (2) reported the association of alcohol intake and DR risk; (3) presented relative risk (RR), odds ratio (OR) or original data that could lead to OR values. We excluded studies in which only DR progression, microvascular complications or visual impairments were reported in the outcome. If different literature reported the results from the same datasets, only the smallest reports were included in our meta-analysis. Additionally, the literature was excluded if no alcohol consumption data was detected.
Data Extraction
Data extractions were conducted from each included study independently by two investigators (W Zhu and YF Meng). The following data were extracted by reviewing all the included studies: name of the first author, publication year, age and number of participants, study period, study site and design, DR designations and diagnostic methods. Additionally, the definition of alcohol intake, adjusting factor and the OR or RR with 95% CI were also recorded for advanced analyses. Any disagreements in the data extraction were resolved through discussion with the third reviewer until a consensus was reached.
Quality Evaluation
Because there is no universal scale available for the evaluation of the quality of all kinds of observational studies, we developed a modified scoring system that was based on a commonly used system18, 19. The methodological quality of each included study was assessed by a checklist: (1) Defined study design (case control or cohort study, 1 point; cross-sectional study, 0 points), (2) List inclusion and exclusion criteria for all participants (Yes, 1 point; No, 0 points); (3) Indicate study period and follow-up duration (Yes, 1 point; No, 0 points); (4) Diagnosis of DR based on fundal examination or fundal photography (Yes, 1 point; No, 0 points); (5) Provided enrollment duration for all participants (Yes, 1 point; No, 0 points); (6) Described the general characteristics, such as age and sex, of the full participant population (Yes, 1 point; No, 0 points); (7) Adjusted for confounding factors, such as age, gender, DM duration or cardiovascular factors (Yes, 1 point; No, 0 points); (8) Stratified alcohol intake into more than three stratifications (Yes, 1 point; No, 0 points); (9) Common influence factors, including age, gender, DM duration, were matched among all the groups (Yes, 1 point; No, 0 points). Studies with over 6 points were considered to have relatively high methodological quality.
Statistical Analysis
We evaluated the association between alcohol consumption and risk of DR by pooling the results from all the included studies. Adjusted OR or RR with 95% CI were used for the meta-analysis whenever possible. Crude values or primary data were used when adjusted data were not presented. Considering the existing heterogeneity among the modified observational study designs, we conducted this meta-analysis using the random-effects model in the presence of significant heterogeneity. In this study, both the I2 method and the χ2 test were used to detect heterogeneity. We assumed significant heterogeneity if I2 was greater than 50% or the P value was less than 0.1. We also conducted subgroup analyses by study design types (cohort studies, case control studies and cross-sectional studies). Furthermore, classified analyses of all the included studies were conducted by study sites, DR stage (PDR or any DR), DM type (T1DM or T2DM), alcohol consumption amount and consumption subtypes as well as adjusting status.
Sensitivity analyses were also conducted to evaluate the influence of individual studies on the final conclusion. A total of two methods were used in the sensitivity analysis: (1) drop the included studies individually and then calculate the modified effects; (2) conduct sensitive analyses through advanced analyses by cutting the studies with lower study quality. Potential publication bias was detected by both a funnel plot and Egger’s test. An asymmetric plot and P less than 0.05 demonstrate the possible existence of publication bias. When significant publication bias was detected, a trim and fill analysis20, which would yield the adjusted effect of funnel plot asymmetry, was conducted. All analyses were performed using STATA software (version 12.0; Stata Corp LP). P values less than 0.05 were considered statistically significant in each analysis.
Results
Literature Search
Among 1499 publications retrieved by the electronic database search (543 from PubMed, 624 from EMBASE, 332 from Web of Science and 27 studies from reference lists), 889 duplicates were excluded. After reviewing title/abstracts of 637 articles, 594 studies were excluded after a first screening and 43 remaining articles were obtained for full-text review. In the full-text assessment for final inclusion, 28 articles were excluded for the following reasons: (1) DR was combined with other complications in 5 studies; (2) 22 studies were excluded either because they did not report outcomes of interest or no usable data was presented; (3) one study was excluded for updated data from a duplicated study. Finally, a total of 15 observational studies were included in this meta-analysis. The flow diagram of the literature search process is presented in Fig. 1.
Figure 1.
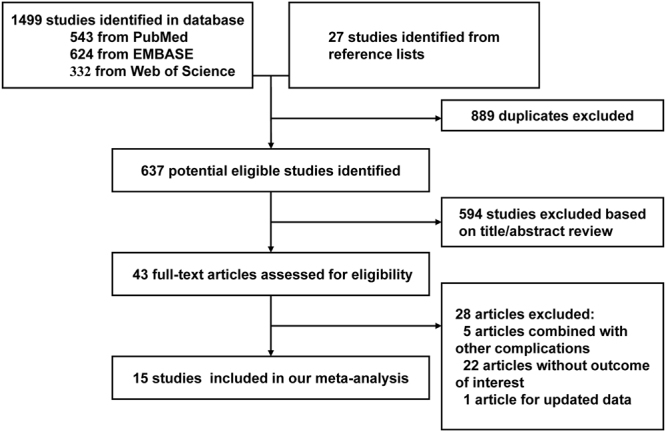
Flow diagram of the literature search and selection process.
Study Characteristics
Table 1 shows the characteristics of all the included studies in this analysis. Among these included studies were cohort studies (n = 5), case control studies (n = 4) and cross-sectional studies (n = 6). The locations where the studies were conducted were as follows: Europe (n = 6), America (n = 2), Asia (n = 6) and Australia (n = 1). When DM types were considered, three studies focused on T1DM cases, and eight studies analyzed DR cases in T2DM patients. The DR identification in most studies was based on the Early Treatment Diabetic Retinopathy Study (ETDRS) severity level in 7 studies, whereas grade classification (3 or 4 levels) was used in 4 studies. The range of enrollment periods for included studies in this study was 1977–2014. All studies reported at least one alcohol consumption level as the exposure of interest. When the alcohol exposure definition was considered, a total of 7 studies demonstrated stratified analysis into more than three categories. The adjusted or matched factors in the included studies were also reported in Table 1. In the 15 observational studies, we identified a total of 12,875 DR cases among 37,285 participants.
Table 1.
Characteristics of Eligible Studies.
| Author year | Country | Study design | Age, year | DR diagnosis | DR definication | No. of case/control | Diabetes | Adjustment/matched | Exposure Definition |
|---|---|---|---|---|---|---|---|---|---|
| Yang JY 2013 | Korean | CS | ≥19 | Fundus examination | ETDRS | 112/866 | Mix | Age, gender, smoking status, regular exercise, BMI, Serum total cholesterol, Serum triglyceride, Serum HDL-cholesterol, Anti-lipid drug use | ≥4 alcoholic drinks/week, <3 drinks/week |
| Xu L 2009 | China | Cohort | ≥40 | Fundus photographs | NR | 366/3775 | General | BMI, high-density lipoprotein, low-density lipoprotein, arterial hypertension | Consumers, Non-consumers |
| Moss SE 1994 | USA | Cohort | ≥21 | Fundus photographs | ETDRS | 238/678 | Mix | Age, sex, glycosylated, hemoglobin, retinopathy | Average loz/day increase |
| Lee CC 2010 | Whole world | Cohort | 55–81 | Retinal photography | ETDRS | 640/599 | T2DM | age, sex, HbA1c, systolic blood pressure, duration of diabetes, BMI, cigarette smoking, ethnicity | 0, drinks ⁄week 1–14, drinks ⁄week >14 drinks ⁄week |
| Kohner EM 1998 | UK | CC | 25–65 | Retinal photography | ETDRS | 1102/1862 | T2DM | NR | None, occasional, regular, heavy |
| Hirai FE 2007 | USA | CS | 45.3 ± 9.9 | Retinal photography | ETDRS | 309/228 | T1DM | NR | Alcohol/No alcohol |
| Harjutsalo V 2014 | Finnish | CS | 28.9–46.8 | Retinal photography | NR | 1191/2417 | T1DM | None | Heavy drinker light drinker |
| Fenwick EK 2015 | Australia | CS | ≥18 | Fundus photography | ETDRS | 235/160 | T2DM | Education, income, language spoken at home, country of birth, lipid-lowering medication, hypertension medication | None, moderate, high |
| Young RJ 1984 | UK | Cohort | 20–59 | Fundoscopic | Four Grades | 230/62 | Mix | NR | ≤10 measures/week, >10 measures/week |
| Beulens JW 2008 | European | CS | 15–60 | Retinal photographs | Three grades | 304/2946 | T1DM | Age, sex, centre, duration of illness, systolic BP, physical activity, smoking, BMI, presence of cardiovascular disease and HbA | 0 g/week, 0.0–4.9 g/week, 5.0–29.9 g/week, 30.0–69.9 g/week, 70.0–209.9 g/week, ≥210 g/week |
| Rasmidatta S 1998 | Thailand | CC | 60.5 ± 7.4 | Fundoscopic examinations | Three grades | 63/135 | T2DM | Glycosylated hemoglobin (%), cholesterol (mg/dL), triglyceride (mg/dL), HDL (mg/dL), BP (mmHg) | Nondrinker, drinker, not regular drinker |
| Jongsareejit A 2013 | Thailand | CS | 59.5 | Indirect ophthalmoscope | International scalesa | 214/719 | type 2 | Gender, age, diastolic BP, waist, total cholesterol HDL, ccular perfusion pressure | No, ever, current |
| Martín-Merino E 2016 | UK | CC | NR | Computerized records | NR | 7735/9395 | T2DM | Sex; age at index date; diabetes duration; primary care practitioner visits; referrals and hospitalizations; smoking; alcohol consumption; first HbA1c; systolic blood pressure; glaucoma; cataracts, or lens extraction; high-density lipoprotein and triglycerides; and hypoglycaemic agents, including oral hypoglycaemic drugs and insulin | 0–1 units/week 2–21 units/week 22–34 units/week ≥35 units/week |
| Giuffrè G 2004 | Italy | CC | ≥40 | Fundus examination | ETDRS | 45/86 | Mix | NR | None 1–19 years 20 years or more |
| Tseng ST 2015 | China | Cohort | 58.9 | Funduscopic | Three grades | 91/482 | T2DM | NR | Drinker no-drinker |
NR: not reported; CC: case-control study; CS: cross-sectional study; T1DM: type 1 diabetes mellitus; T2DM: type 1 diabetes mellitus; HDL: high-density lipoprotein; BMI: body mass index; BP: blood pressure; ETDRS: Early Treatment Diabetic Retinopathy Study.
aInternational clinical diabetic retinopathy and diabetic macular edema disease severity scales.
Quality Scale of Study Methodology
The methodology quality of studies included in this meta-analysis is presented in Table 1 and Supplemental Table 1. The study methodologies were scored on a 9-point scale. The range of methodological scores was 3 to 8 points, and the average score was 6.07 points. Relatively high quality (6 points or more) was detected in 12 of the 15 included studies.
Alcohol Intake and DR Risk
The pooled estimation of the 15 included observational studies that reported the association between alcohol consumption and DR risk was 0.91 (95% CI, 0.79 to 1.06; Fig. 2) in a random-effect model. When heterogeneity was considered, significant heterogeneity was detected (I 2 = 62.3%, P = 0.001). Analyses stratified by study design showed that no significant association was evident between alcohol intake and DR incidence in cohort, case control or cross-sectional studies (cohort study: OR = 0.95, 95% CI = 0.66 to 1.36; case control: OR = 0.97, 95% CI = 0.77 to 1.22; cross-sectional study: OR = 0.86, 95% CI = 0.69 to 1.08).
Figure 2.

Summary of the odds ratios for the association between alcohol intake and the risk of DR by study designs. Through subgroup analyses, no significant association was detected in cohort, case-control or cross-sectional studies. The size of the shaded square is proportional to the percent weight of each study. Horizontal lines represent 95% CIs. The diamond data markers indicate pooled ORs.
In advanced subgroup studies, no significant associations were detected in Europe (OR = 0.94, 95% CI = 0.75 to 1.17), America (OR = 0.97, 95% CI = 0.70 to 1.34) or Asia (OR = 0.94, 95% CI = 0.66 to 1.33). However, only one study in Australia was included in this study, and an inverse association between alcohol intake and DR risk was detected (OR = 0.52, 95% CI = 0.31 to 0.88). When DM types were considered, no significant association was detected in either T1DM (OR = 0.84, 95% CI = 0.60 to 1.20) or T2DM (OR = 1.01, 95% CI = 0.87 to 1.16) group. Neither population-based (OR = 0.88, 95% CI = 0.74 to 1.04) nor hospital-based studies (OR = 1.17, 95% CI = 0.82 to 1.67) demonstrated significant association between alcohol consumption and DR risk. We also considered the alcohol amount intake and DR incidence. Through the stratified studies, neither protective nor harmful effects were detected among different alcohol consumption groups (light: OR = 1.10, 95% CI = 0.87 to 1.40; moderate: OR = 0.91, 95% CI = 0.72 to 1.14; heavy: OR = 0.90, 95% CI = 0.76 to 1.08). Otherwise, we measured the effects of different types of alcoholic beverages on the incidence of DR. In the subgroup analyses, intake of neither beer (OR = 0.90, 95% CI = 0.76 to 1.08) nor spirits (OR = 1.00, 95% CI = 0.81 to 1.24) was associated with DR risk. Furthermore, it was interesting to find that protective effects were detected in the wine (OR = 0.77, 95% CI = 0.64 to 0.92) and sherry (OR = 0.22, 95% CI = 0.05 to 0.95) groups. Further subgroup analyses on the adjusting status, age adjustment, gender adjustment and BMI adjustment showed no significant association in each subgroup. The detailed results are presented in Table 2.
Table 2.
Subgroup Analysis of Alcohol Intake and Risk of DR.
| Subgroups | No. of studies | Summary Effect | P value | Study | Heterogeneity | |
|---|---|---|---|---|---|---|
| OR (95% CI) | I2, % | P value | ||||
| DR stage | PDR | 2 | 0.90 (0.55 to 1.45) | 0.65 | 71.5 | 0.1 |
| Any DR | 14 | 0.94 (0.80 to 1.09) | 0.385 | 26.7 | 0.008 | |
| Study type | Cohort | 5 | 0.95 (0.66 to 1.36) | 0.612 | 54.8 | 0.065 |
| Case-control | 4 | 0.97 (0.77 to 1.22) | 0.807 | 65.1 | 0.035 | |
| Cross-sectional | 6 | 0.86 (0.69 to 1.08) | 0.188 | 43.2 | 0.117 | |
| Site | Europe | 6 | 0.94 (0.75 to 1.17) | 0.506 | 77.9 | <0.001 |
| Americas | 2 | 0.97 (0.70 to 1.34) | 0.843 | 0 | 0.414 | |
| Asia | 6 | 0.94 (0.66 to 1.33) | 0.713 | 29.9 | 0.222 | |
| Australia | 1 | 0.52 (0.31 to 0.88) | 0.015 | — | — | |
| DM type | Type 1 | 3 | 0.84 (0.60 to 1.20) | 0.187 | 62.1 | 0.104 |
| Type 2 | 8 | 1.01 (0.87 to 1.16) | 0.942 | 43.3 | 0.102 | |
| Alcohol amount | Light | 3 | 1.10 (0.87 to 1.40) | 0.43 | 78.3 | 0.003 |
| Moderate | 6 | 0.91 (0.72 to 1.14) | 0.397 | 71.2 | 0.004 | |
| Heavy | 8 | 1.06 (0.93 to 1.21) | 0.412 | 16.8 | 0.001 | |
| Alcohol type | Beer | 3 | 0.90 (0.76 to 1.08) | 0.267 | 0 | 0.55 |
| Wine | 3 | 0.77 (0.64 to 0.92) | 0.005 | 0 | 0.472 | |
| Spirit | 3 | 1.00 (0.81 to 1.24) | 0.975 | 0 | 0.545 | |
| Sherry | 1 | 0.22 (0.05 to 0.95) | 0.042 | — | — | |
| Adjustment status | Adjusted | 9 | 0.85 (0.69 to 1.05) | 0.124 | 70.5 | 0.001 |
| Unadjusted | 6 | 1.00 (0.77 to 1.30) | 0.132 | 40.9 | 0.081 | |
| Age adjusted | Yes | 6 | 0.95 (0.78 to 1.15) | 0.584 | 65.8 | 0.012 |
| No | 9 | 0.83 (0.62 to 1.10) | 0.188 | 64.7 | <0.001 | |
| Gender adjusted | Yes | 6 | 0.95 (0.78 to 1.15) | 0.584 | 65.8 | 0.012 |
| No | 9 | 0.83 (0.62 to 1.10) | 0.188 | 64.7 | <0.001 | |
| BMI adjusted | Yes | 4 | 0.79 (0.63 to 0.99) | 0.038 | 34.5 | 0.205 |
| No | 11 | 0.97 (0.82 to 1.15) | 0.711 | 54.9 | 0.018 |
DM: diabetic mellitus; DR: diabetic retinopathy; OR: odds ratio; CI: confidence interval.
Sensitivity Analyses and Publication Bias
In the sensitivity analysis, it was found that the outcome was not significantly changed when any study was excluded from this meta-analysis (Fig. 3). We also excluded studies with lower methodological scores and found no significant association between alcohol intake and DR risk (OR = 0.87, 95% CI, 0.73 to 1.04). Both visual inspection of Begg’s funnel plot and Egger’s test were used to detect publication bias. In general, it revealed symmetry for the funnel plot (P = 0.692, Fig. 4). However, Egger’s test demonstrated a significant publication bias (P = 0.049). Therefore, we conducted an advanced sensitivity analysis using the trim and fill method. It was found that no study should be added; thus, no advanced meta-analysis could be calculated with updated records.
Figure 3.

Funnel plot for the association between alcohol intake and the risk of DR in all the included studies. No significant publication bias was detected through pooling the 15 observational studies together.
Figure 4.
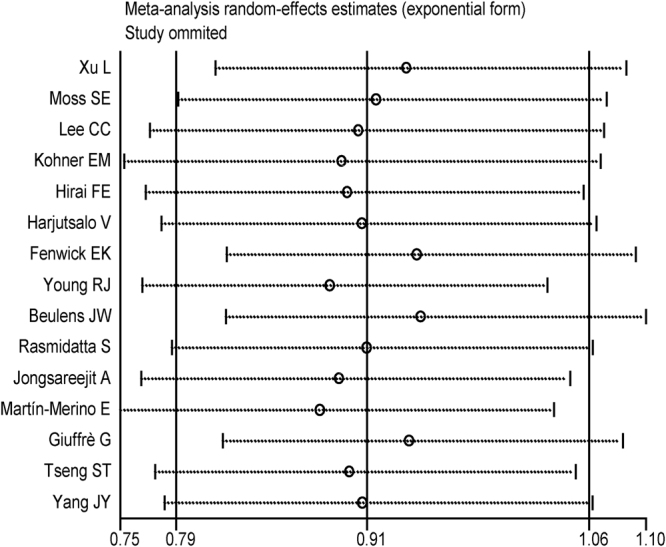
Sensitivity analysis through a one-way method. There were no studies influencing the result of alcohol consumption on DR.
Discussion
There were contradictory results regarding the relationship between alcohol consumption and DR incidence in DM cases. This current meta-analysis showed that alcohol intake was not associated with DR risk in quantitative analyses of 15 observational studies. In advanced subgroup analysis, no significant associations were detected in different DR stages, study designs, DM type and various alcohol consumption groups. However, the subgroup meta-analyses by alcoholic beverage groups showed that wine and sherry intake were associated with reduced DR incidence. Overall, the sensitivity analysis indicated that the conclusions of this study were quite robust.
Alcohol consumption was regarded as a significant factor influencing increased morbidity and mortality21, while moderate alcohol intake demonstrated certain protective effects on cardiovascular diseases and DM status. A previous observational study with 5.5 years of follow-up indicated that light and moderate alcohol consumption could reduce the risk of T2DM22. In a dose-response meta-analysis of 38 observational studies, the results showed that significant reductions in the risk of T2DM were present at all levels of alcohol intake <63 g/day23. Considering that alcohol consumption was a protective factor of DM, it was natural to conjecture that alcoholic beverage intake might also influence the incidence or progression of the complications of DM. The incidence of DR, which was an important microvascular complication of DM, was influenced by various genetic and environmental factors. Considering that alcoholic beverages are usually consumed on a global scale, it is an important public health issue to determine the effect of alcohol consumption on the risk of DR.
It has been a long time since the associations between alcohol consumption and ocular disorders or visual health were first detected24, 25. In a previous cohort study, the relationships between alcohol patterns on the incidence of visual impairment (VI) in over a 20-year period were studied. Through analyzing the follow-up data, it was found that those who had not consumed alcoholic beverages over the past year had higher odds of incident VI than persons who drank occasionally26. The effect of alcohol intake on the VI incidence of DM patients was also detected in the Sankara Nethralaya Diabetic Retinopathy Epidemiology and Molecular Genetics Study (SN-DREAMS). Compared with that of non-drinkers, alcohol consumers demonstrated a lower prevalence of DR (OR = 0.41; 95% CI, 0.17 to 0.96; P = 0.04)27. The effect of alcohol consumption on DR risk was studied in previous epidemiological studies. As early as 1984, the role of alcohol consumption on development and progress of retinopathy was sought in 296 randomly selected diabetic men aged 20–59 during a five-year prospective study28. The results of the follow-up demonstrated that alcohol intake was associated with development and progression of retinopathy (P = 0.02). A cohort analysis of 1239 participants with T2DM aged 55 to 81 years enrolled in the AdRem study showed that moderate alcohol consumption, compared with no current alcohol intake, was not associated with presence or progression of diabetic retinopathy after adjusting for confounding factors29. Furthermore, in this cross-sectional study, the effects of the consumption of different alcoholic beverages on the risk of DR were reported among patients with T2DM15. Compared with the no alcohol intake group, moderate alcohol consumption was significantly associated with a reduced odds ratio of DR incidence (OR = 0.47, 95% CI, 0.26 to 0.85), while heavy alcohol consumption was not associated with DR risk (OR = 0.75, 95% CI, 0.25 to 2.20). In this study, through meta-analysis of 15 observational studies, it was reported that alcohol consumption was not associated with DR risk. Sensitivity analysis further indicated that the conclusions of this study were quite robust.
In the subgroup analysis by alcoholic drink types, wine and sherry consumption were associated with reduced risk of DR. This was an interesting finding with several potential explanations. Considering the relatively higher quality of wine and sherry compared with beer and spirits, the modification of drinking patterns of different alcoholic drink types might influence the DR risk. Drinking patterns might also be associated with healthy dietary behaviors and thus might affect the incidence of diabetes complications. Additionally, the polyphenolic content was the principal biologically active component in wine and was notably higher in fortified wine. Polyphenolic content could produce significant protective effects on DR progression both by reducing oxidative stress and inflammation in the retina directly and by decreasing cardiovascular and renal complications, thus reducing DR risk. However, the reason why no significant protective effect was detected from red wine as in a previous study is still unknown. Further epidemiological and in vitro studies will be required in the future. Considering that only limited studies have demonstrated the alcoholic drink subgroup effect on DR incidence (3 studies for wine and 1 for sherry), more well-designed studies with stratified analyses by alcohol types will be required in the future.
As this is the first meta-analysis on the association between alcohol consumption and DR risk as we know to date, a protective effect of wine consumption was detected. There are several possible mechanisms explaining this outcome. Moderate alcohol intake, especially of wine, has been regarded as a protective factor for cardiovascular disease30. In most epidemiological studies, a significant U-shaped association between alcohol consumption and all-cause mortality and vascular deaths was detected31. Through the SUN Project with 142,177 person-years of follow-up, the traditional Mediterranean alcohol-drinking pattern was reported to be associated with lower cardiovascular risk in most point estimates32. As cardiovascular events have been regarded as risk factors for DR33, the benefit of wine intake might arise from the reduction of cardiovascular disease risk. Furthermore, abnormal inflammation and increased oxidative stress have been regarded as key factors in the pathogenesis of DR development34. Both in vitro and in vivo studies have shown that polyphenol, delphinidin and resveratrol from wine produce protective effects against the development of DR through inhibiting the inflammatory response and oxidative stress35 ,36. Increased vascular endothelial growth factor (VEGF) activity also promoted the incidence and progression of microvascular complications of DM cases37. Moderate alcohol, especially red wine intake, demonstrated reduced VEGF expression38 and thus could produce a protective effect against DR risk.
The main strength of this meta-analysis was the comprehensive literature search. It was based on an extensive search up to May 2016 for potential included studies to identify associations between alcohol consumption and DR risk. In this study, the publication date of all included studies ranged from 1984 to 2015. Furthermore, the inclusion criteria in this study contained all observational studies reporting the effects of alcohol intake on the risk of DR. Comprehensive inclusion of all published studies provided stronger evidence for the conclusion. A stratified analysis by different subgroups would demonstrate a more detailed understanding of the effect of alcohol intake and risk of DR. Advanced studies by subgroup analysis showed that alcoholic beverage subtypes might produce differential effects on DR risk. The analysis provided clues for subsequent clinical study design and indicated that effects of alcoholic beverage types should be comprehensively explored in studies with more participants. Detailed information on the frequency and type of alcoholic drinks as well as other dietary or social factors should be collected and analyzed. However, certain limitations existed in our current meta-analysis that also must be considered. First, although 15 observational studies were included in this study, six of them consisted of cross-sectional design. The cross-sectional design is considered to demonstrate a weaker power to detect correlations. The relatively lower number of cohort studies included in this analysis demonstrated the requirement for additional well-designed cohort studies. Second, publication bias, which might influence the robustness of the conclusion, was detected in this study. The P value in Egger’s test was 0.049, and no additional studies were indicated using the trim and fill method. However, only mild significance was presented in the publication bias calculation, and the unmodified result was detected through trim and fill analysis. Thus, publication bias did not have a crucial influence on the conclusion of this study. Third, the crude OR/RR was provided in several included studies. Additionally, the adjusted models were different among the included studies. Accordingly, adjusting status might play an important role in DR development.
In conclusion, this current meta-analysis demonstrated that alcohol intake was not associated with the risk of DR. Subgroup analysis by alcoholic beverage type showed that wine consumption could reduce the incidence of DR. No significant association was detected between different quantities of alcohol intake and DR incidence in our meta-analysis. In the future, more large-scale prospective studies with detailed alcohol subtypes and contents are still warranted to clarify the association.
Electronic supplementary material
Acknowledgements
This work was supported in whole or in part, by the Foundation for Young Scholars of Suzhou, China (Grant No. kjxw2015044). The sponsor or funding organization had no role in the design or conduct of this research.
Author Contributions
W.Z. and Y.F.M. designed the study, Y.F.M. and M.X. collected data, W.Z. and M.X. completed statistical analyses and W.Z., Y.F.M., and J.L. wrote the manuscript, all authors contributed to discussions, writing and reviewing of the manuscript.
Competing Interests
The authors declare no competing financial interests.
Footnotes
Wei Zhu and Yi-Fang Meng contributed equally to this work.
Electronic supplementary material
Supplementary information accompanies this paper at doi:10.1038/s41598-017-00034-w
Publisher's note: Springer Nature remains neutral with regard to jurisdictional claims in published maps and institutional affiliations.
References
- 1.Ohara N, et al. Rapid Normalization of High Glutamic Acid Decarboxylase Autoantibody Titers and Preserved Endogenous Insulin Secretion in a Patient with Diabetes Mellitus: A Case Report and Literature Review. Internal medicine. 2016;55:485–489. doi: 10.2169/internalmedicine.55.5398. [DOI] [PubMed] [Google Scholar]
- 2.Liao PJ, et al. Long-Term and Interactive Effects of Pay-For-Performance Interventions among Diabetic Nephropathy Patients at the Early Chronic Kidney Disease Stage. Medicine. 2016;95:e3282. doi: 10.1097/MD.0000000000003282. [DOI] [PMC free article] [PubMed] [Google Scholar]
- 3.Hanefeld, M., Monnier, L., Schnell, O. & Owens, D. Early Treatment with Basal Insulin Glargine in People with Type 2 Diabetes: Lessons from ORIGIN and Other Cardiovascular Trials. Diabetes therapy: research, treatment and education of diabetes and related disorders, 10.1007/s13300-016-0153-3 (2016). [DOI] [PMC free article] [PubMed]
- 4.Wang Y, Yan H. MicroRNA-126 contributes to Niaspan treatment induced vascular restoration after diabetic retinopathy. Scientific reports. 2016;6:26909. doi: 10.1038/srep26909. [DOI] [PMC free article] [PubMed] [Google Scholar]
- 5.Shih CJ, et al. Comparative effectiveness of angiotensin-converting-enzyme inhibitors and angiotensin II receptor blockers in patients with type 2 diabetes and retinopathy. CMAJ: Canadian Medical Association journal = journal de l′Association medicale canadienne. 2016;188:E148–157. doi: 10.1503/cmaj.150771. [DOI] [PMC free article] [PubMed] [Google Scholar]
- 6.Pieramici DJ, Wang PW, Ding B, Gune S. Visual and Anatomic Outcomes in Patients with Diabetic Macular Edema with Limited Initial Anatomic Response to Ranibizumab in RIDE and RISE. Ophthalmology. 2016;123:1345–1350. doi: 10.1016/j.ophtha.2016.02.007. [DOI] [PubMed] [Google Scholar]
- 7.Alam U, Arul-Devah V, Javed S, Malik RA. Vitamin D and Diabetic Complications: True or False Prophet? Diabetes therapy: research, treatment and education of diabetes and related disorders. 2016;7:11–26. doi: 10.1007/s13300-016-0159-x. [DOI] [PMC free article] [PubMed] [Google Scholar]
- 8.Ahmed RA, Khalil SN, Al-Qahtani MA. Diabetic retinopathy and the associated risk factors in diabetes type 2 patients in Abha, Saudi Arabia. Journal of family & community medicine. 2016;23:18–24. doi: 10.4103/2230-8229.172225. [DOI] [PMC free article] [PubMed] [Google Scholar]
- 9.Maas, P. et al. Breast Cancer Risk From Modifiable and Nonmodifiable Risk Factors Among White Women in the United States. JAMA oncology, doi:10.1001/jamaoncol.2016.1025 (2016). [DOI] [PMC free article] [PubMed]
- 10.Tu, H. P. et al. Additive composite ABCG2, SLC2A9 and SLC22A12 scores of high-risk alleles with alcohol use modulate gout risk. Journal of human genetics, doi:10.1038/jhg.2016.57 (2016). [DOI] [PubMed]
- 11.Song, M. & Giovannucci, E. Preventable Incidence and Mortality of Carcinoma Associated With Lifestyle Factors Among White Adults in the United States. JAMA oncology, doi:10.1001/jamaoncol.2016.0843 (2016). [DOI] [PMC free article] [PubMed]
- 12.Li XH, Yu FF, Zhou YH, He J. Association between alcohol consumption and the risk of incident type 2 diabetes: a systematic review and dose-response meta-analysis. The American journal of clinical nutrition. 2016;103:818–829. doi: 10.3945/ajcn.115.114389. [DOI] [PubMed] [Google Scholar]
- 13.Athyros VG, et al. Association of drinking pattern and alcohol beverage type with the prevalence of metabolic syndrome, diabetes, coronary heart disease, stroke, and peripheral arterial disease in a Mediterranean cohort. Angiology. 2007;58:689–697. doi: 10.1177/0003319707306146. [DOI] [PubMed] [Google Scholar]
- 14.Martin-Merino, E., Fortuny, J., Rivero-Ferrer, E., Lind, M. & Garcia-Rodriguez, L. A. Risk factors for diabetic retinopathy in people with Type 2 diabetes: A case-control study in a UK primary care setting. Primary care diabetes, doi:10.1016/j.pcd.2016.01.002 (2016). [DOI] [PubMed]
- 15.Fenwick EK, et al. Moderate consumption of white and fortified wine is associated with reduced odds of diabetic retinopathy. Journal of diabetes and its complications. 2015;29:1009–1014. doi: 10.1016/j.jdiacomp.2015.09.001. [DOI] [PubMed] [Google Scholar]
- 16.Stroup DF, et al. Meta-analysis of observational studies in epidemiology: a proposal for reporting. Meta-analysis Of Observational Studies in Epidemiology (MOOSE) group. Jama. 2000;283:2008–2012. doi: 10.1001/jama.283.15.2008. [DOI] [PubMed] [Google Scholar]
- 17.Panic N, Leoncini E, de Belvis G, Ricciardi W, Boccia S. Evaluation of the endorsement of the preferred reporting items for systematic reviews and meta-analysis (PRISMA) statement on the quality of published systematic review and meta-analyses. PloS one. 2013;8:e83138. doi: 10.1371/journal.pone.0083138. [DOI] [PMC free article] [PubMed] [Google Scholar]
- 18.Zeng X, et al. The methodological quality assessment tools for preclinical and clinical studies, systematic review and meta-analysis, and clinical practice guideline: a systematic review. Journal of evidence-based medicine. 2015;8:2–10. doi: 10.1111/jebm.12141. [DOI] [PubMed] [Google Scholar]
- 19.Cota GF, de Sousa MR, Fereguetti TO, Rabello A. Efficacy of anti-leishmania therapy in visceral leishmaniasis among HIV infected patients: a systematic review with indirect comparison. PLoS neglected tropical diseases. 2013;7:e2195. doi: 10.1371/journal.pntd.0002195. [DOI] [PMC free article] [PubMed] [Google Scholar]
- 20.Coburn KM, Vevea JL. Publication bias as a function of study characteristics. Psychological methods. 2015;20:310–330. doi: 10.1037/met0000046. [DOI] [PubMed] [Google Scholar]
- 21.Ogeil RP, Gao CX, Rehm J, Gmel G, Lloyd B. Temporal changes in alcohol-related mortality and morbidity in Australia. Addiction. 2016;111:626–634. doi: 10.1111/add.13213. [DOI] [PubMed] [Google Scholar]
- 22.Marques-Vidal P, Vollenweider P, Waeber G. Results from the CoLaus study. Nutrition, metabolism, and cardiovascular diseases: NMCD. 2015;25:75–84. doi: 10.1016/j.numecd.2014.08.010. [DOI] [PubMed] [Google Scholar]
- 23.Knott C, Bell S, Britton A. Alcohol Consumption and the Risk of Type 2 Diabetes: A Systematic Review and Dose-Response Meta-analysis of More Than 1.9 Million Individuals From 38 Observational Studies. Diabetes care. 2015;38:1804–1812. doi: 10.2337/dc15-0710. [DOI] [PubMed] [Google Scholar]
- 24.Klein R, Lee KE, Gangnon RE, Klein BE. Relation of smoking, drinking, and physical activity to changes in vision over a 20-year period: the Beaver Dam Eye Study. Ophthalmology. 2014;121:1220–1228. doi: 10.1016/j.ophtha.2014.01.003. [DOI] [PMC free article] [PubMed] [Google Scholar]
- 25.Rani PK, Raman R, Gella L, Kulothungan V, Sharma T. Prevalence of Visual Impairment and Associated Risk Factors in Subjects with Type II Diabetes Mellitus: Sankara Nethralaya Diabetic Retinopathy Epidemiology and Molecular Genetics Study (SN-DREAMS, Report 16) Middle East African journal of ophthalmology. 2012;19:129–134. doi: 10.4103/0974-9233.102762. [DOI] [PMC free article] [PubMed] [Google Scholar]
- 26.Young RJ, McCulloch DK, Prescott RJ, Clarke BF. Alcohol: another risk factor for diabetic retinopathy? British medical journal. 1984;288:1035–1037. doi: 10.1136/bmj.288.6423.1035. [DOI] [PMC free article] [PubMed] [Google Scholar]
- 27.Helm L, Macdonald IA. Impact of beverage intake on metabolic and cardiovascular health. Nutrition reviews. 2015;73(Suppl 2):120–129. doi: 10.1093/nutrit/nuv049. [DOI] [PubMed] [Google Scholar]
- 28.Hernandez-Hernandez A, et al. Mediterranean Alcohol-Drinking Pattern and the Incidence of Cardiovascular Disease and Cardiovascular Mortality: The SUN Project. Nutrients. 2015;7:9116–9126. doi: 10.3390/nu7115456. [DOI] [PMC free article] [PubMed] [Google Scholar]
- 29.Beulens JW, et al. Alcohol consumption and risk of recurrent cardiovascular events and mortality in patients with clinically manifest vascular disease and diabetes mellitus: the Second Manifestations of ARTerial (SMART) disease study. Atherosclerosis. 2010;212:281–286. doi: 10.1016/j.atherosclerosis.2010.04.034. [DOI] [PubMed] [Google Scholar]
- 30.Raum P, et al. Prevalence and Cardiovascular Associations of Diabetic Retinopathy and Maculopathy: Results from the Gutenberg Health Study. PloS one. 2015;10:e0127188. doi: 10.1371/journal.pone.0127188. [DOI] [PMC free article] [PubMed] [Google Scholar]
- 31.Reddy VS, Reddy GB. Role of crystallins in diabetic complications. Biochimica et biophysica acta. 2016;1860:269–277. doi: 10.1016/j.bbagen.2015.05.009. [DOI] [PubMed] [Google Scholar]
- 32.Chang CC, Chang CY, Huang JP, Hung LM. “Effect of resveratrol on oxidative and inflammatory stress in liver and spleen of streptozotocin-induced type 1 diabetic rats”. The Chinese journal of physiology. 2012;55:192–201. doi: 10.4077/CJP.2012.BAA012. [DOI] [PubMed] [Google Scholar]
- 33.Noll C, et al. Effect of red wine polyphenol dietary supplementation on two phase II enzymes in liver of hyperhomocysteinemic mice. Food and chemical toxicology: an international journal published for the British Industrial Biological Research Association. 2011;49:1764–1769. doi: 10.1016/j.fct.2011.04.024. [DOI] [PubMed] [Google Scholar]
- 34.Ajlan RS, Silva PS, Sun JK. Vascular Endothelial Growth Factor and Diabetic Retinal Disease. Seminars in ophthalmology. 2016;31:40–48. doi: 10.3109/08820538.2015.1114833. [DOI] [PubMed] [Google Scholar]
- 35.Yu W, Fu YC, Wang W. Cellular and molecular effects of resveratrol in health and disease. Journal of Cellular Biochemistry. 2012;113(3):752–759. doi: 10.1002/jcb.23431. [DOI] [PubMed] [Google Scholar]
- 36.Srikanta AH, Kumar A, Sukhdeo SV, Peddha MS, Govindaswamy V. The antioxidant effect of mulberry and jamun fruit wines by ameliorating oxidative stress in streptozotocin-induced diabetic Wistar rats. Food Funct. 2016;7(10):4422–4431. doi: 10.1039/C6FO00372A. [DOI] [PubMed] [Google Scholar]
- 37.Capitão M, Soares R, et al. Angiogenesis and Inflammation Crosstalk in Diabetic Retinopathy. Journal of Cellular Biochemistry. 2009;117(11):2443–2453. doi: 10.1002/jcb.25575. [DOI] [PubMed] [Google Scholar]
- 38.Gan L, Matsuura H, Ichiki T, Yin X, Miyazaki R, Hashimoto T, Cui J, Takeda K, Sunagawa K. Improvement of neovascularization capacity of bone marrow mononuclear cells from diabetic mice by ex vivo pretreatment with resveratrol. Hypertension Research. 2009;32(7):542–547. doi: 10.1038/hr.2009.67. [DOI] [PubMed] [Google Scholar]
Associated Data
This section collects any data citations, data availability statements, or supplementary materials included in this article.