

Abstract
Background:
Diffusion weighted imaging (DWI) is recently developed for identifying different malignant tumors. In this article the diagnostic accuracy of DWI for ovarian cancer was evaluated by synthesis of published data.
Methods:
A comprehensive literature search was conducted in PubMed/MEDLINE and Embase databases on the diagnostic performance of DWI for ovarian cancer published in English. Methodological quality was evaluated following Quality Assessment for Studies of Diagnostic Accuracy 2 (QUADAS 2) tool. We adopted the summary receiver operating characteristic (SROC) curve to assess the DWI accuracy.
Results:
Twelve studies including 1142 lesions were analyzed in this meta-analysis to estimate the pooled Sen (sensitivity), Spe (specificity), PLR (positive likelihood ratio), NLR (negative likelihood ratio), and construct SROC (summary receiver operating characteristics) curve. The pooled Sen and Spe were 0.86 (95% confidence interval [CI], 0.83–0.89) and 0.81 (95%CI, 0.77–0.84), respectively. The pooled PLR and pooled NLR were 5.07 (95%CI, 3.15–8.16) and 0.17 (95%CI, 0.10–0.30), respectively. The pooled diagnostic odds ratio (DOR) was 35.23 (95%CI, 17.21–72.14). The area under the curve (AUC) was 0.9160.
Conclusion:
DWI had moderately excellent diagnostic ability for ovarian cancer and promised to be a helpful diagnostic tool for patients of ovarian cancer.
Keywords: diagnosis, DWI, meta-analysis, ovarian cancer
1. Introduction
Ovarian cancer is the fifth fatal cause related to cancer among women in both developing and developed countries, causing approximately 125,000 deaths annually.[1,2] Ovarian cancer occurs frequently among women in perimenopause period, with few children and adolescents falling into this suffering. Since potentially curable ovarian cancers often do not produce any symptoms,[3–5] early clinical diagnosis is very difficult and ovarian cancer patients often present with an advanced stage at initial diagnosis. It is estimated that about 50% to 60% of the deaths in ovarian cancer patients are associated with local progress. Up to 10% of ovarian cancer patients suffer with distant metastases, including breast, gastrointestinal tract, and reproductive tract.[6] Although aggressive surgery combined with chemotherapy has resulted in prolonged remission for ovarian cancer patients, most advanced women present with poor prognosis.[7] The 5-year survival of early-stage patients with ovarian cancer exceeds 90%, while only 21% of advanced-stage patients survive 5 years upon first diagnosis.[8] Thus, new diagnostic techniques are indispensable to detect ovarian cancer and ultimately formulate treatment decisions aimed at improving life quality and survival rate of ovarian cancer patients at early stage.[9,10]
A variety of diagnostic methods have been adopted in ovarian cancer. Color doppler ultrasound and computer tomography (CT) are commonly used imaging techniques for ovarian cancer diagnosis.[11] Cancer antigen 125 (CA125) as a serum biomarker of ovarian cancer has high specificity for early-stage disease (96–100%), but its sensitivity is poor.[12–14] Magnetic resonance imaging (MRI) has high resolution for soft tissues and can clearly display the anatomic relationship. To date, MRI tends to be an accurate imaging technique for ovarian cancer because of its noninvasive nature and there is no risk of radiation exposure, and no need of patient preparation.[15] MRI is substantially better than ultrasonography and CT.[16] DWI is a newly developed magnetic resonance functional imaging technique based on water molecules movement rather than structure.[17] Malignant tumors are composed of randomly organized tumor cells and the free movement of water molecules inside malignant dense mass is hindered. The inhibited diffusion of water is attributed to hypercellularity,[18,19] thus DWI could provide unique information of tissue structure by tissue cellularity evaluation.[20] Apparent diffusion coefficient (ADC) is calculated quantitatively to measure diffusion ability[21] and in general malignant lesions present higher ADC compared with benign lesions. DWI has being been used for early diagnosis of ischemic cerebral infarction over the past decade,[22,23] but now researches concerning cancer are rapidly expanding and a growing amount of data is published. It was reported that DWI had a desired diagnostic accuracy for lung cancer, pancreatic cancer, and prostate cancer.[24–26] ADC values are employed to differentiate between malignant and benign lesions and in general the former has a significantly lower ADC value.
A series of studies have assessed the performance of DWI for diagnosis of ovarian cancer. However, diagnostic accuracy of DWI in detecting ovarian cancer varied because of some factors such as field intensity, imaging parameters, disease staging, and so on. The study is aimed to evaluate the diagnostic performance of DWI in detecting ovarian cancer by synthesis of published data.
2. Materials and methods
2.1. Search strategy
Our meta-analysis followed the Preferred Reporting Items for Systematic Reviews and Meta-Analyses (PRISMA) recommendations. A systematic literature search was conducted independently by 2 investigators in PubMed/MEDLINE and Embase databases published before January 2016 without other restrictions. We used the following search terms: “ovarian cancer or ovarian tumor or ovarian neoplasm” and “DWI or diffusion weighted Imaging or DW imaging.” Also, manual search were performed for additional relevant studies. As this was a meta-analysis, no ethical approval was required.
2.2. Eligibility criteria and study selection
Two investigators, Xia Yuan and Yan Tie, screened all abstracts and checked relevant full-texts independently. Studies were enrolled in the meta-analysis if they satisfied the following criteria: the study adopted DWI in patient to determine the benignity or malignancy of ovarian masses; the study used histopathology of biopsy or surgery specimens as reference standard; the study provided sufficient data available to calculate true-positive (TP), false-positive (FP), false-negative (FN), and true-negative (TN) values.
Studies were excluded from the meta-analysis if meeting the following criteria: the study did not involve ovarian cancer; the study did not provide complete and available data; the study is other research type, such as review, letter, meeting abstract, and case report; the study whose sample size was fewer than 10 patients.
2.3. Data extraction and quality assessment
The same 2 investigators who conducted the literature searches have extracted the relevant data independently. A third reviewer was responsible for coordinating disagreements. To perform accuracy analyses, the following data items of each study were extracted: the name of the first author, year of publication, country of origin, number and age of subjects, b values, techniques, and MRI field strength. For each study, 2 × 2 contingency tables were obtained with TP, FP, TN, FN results. If diagnostic accuracy was executed by different observers, only 1 contingency table by the most experienced observer was extracted or reconstructed.
Quality of relevant studies was examined according to QUADAS-2 which follows 14 items by scoring “yes” if done; “no” if not done; or “unclear” if it is not certain.[27] The quality assessment was performed by Xia Yuan and Yan Tie independently.
2.4. Statistical analysis
With TP, TN, FP, FN from extracted 2 × 2 contingency tables, we quantified the pooled Sen, Spe, LR, and DOR with 95% confidence intervals (95%CI) to evaluate DWI diagnosis accuracy for ovarian cancer. Also, SROC curve was obtained to explain the interaction between Sen and Spe. Area under the curve (AUC) was calculated to assess the diagnostic ability of a test.[28] The heterogeneity between enrolled articles was estimated statistically using the Q statistic of the Chi-squared value test and the inconsistency index (I2) and I2 > 50% indicates the existence of significant heterogeneity.[29] If so, a random effects model was adopted.[30] On the opposite condition, the pooled analysis was performed using the fixed effects model.[31] Statistical analyses were carried out by Meta Disc statistical software version 1.4 (XI. Cochrane Colloquium, Barcelona, Spain) and Stata software version 11.1 (STATA Corporation, College Station, TX).
2.5. Publication bias
Deeks funnel plot asymmetry test was used to assess publication bias by Stata 11.0 and P > .05 indicates the absence of potential publication bias.[32]
3. Results
3.1. Literature search and selection of studies
The initial systematic literature search from the PubMed/MEDLINE and Embase databases yielded 169 relevant studies, of which 12 articles were finally identified. Thirty nine articles of full-text were reviewed and ultimately 27 studies were excluded. Thus, 12 studies[33–44] were included in our final dataset for the meta-analysis. The flowchart of study selection was shown in Fig. 1.
Figure 1.

Flow chart of selection process for eligible studies.
3.2. Study characteristics
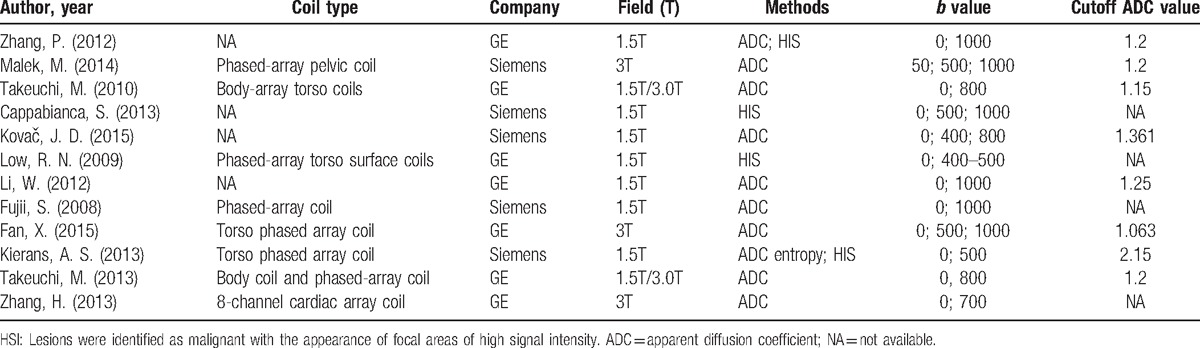
Table 1 summarized the main characteristics of the included studies and Table 2 summarized imaging features of each study. In the 12 studies included in meta-analysis, a total of 1142 examinations were evaluated by DWI. We used histopathologic findings as the reference standard for the final result of DWI for ovarian cancer in all 12 studies. Of 12 studies, 5 studies used 3T MRI scanner with the others using 1.5T MRI scanner. Typical b-values for imaging were 0, 500, 800, and 1000 s/mm2. Two methods were adopted to identify malignant lesions, one of which was to visually identify high signal intensity (HIS) areas and the other was to quantitatively calculate ADC value from region of interest on images. In 2 of the 13 studies, malignant lesions were identified by both HIS and ADC value, and 2 used the method of HIS alone. The remaining articles were only identified by ADC value, one of which calculated the ADC entropy instead of the mean ADC. ADC value of malignant lesion ranged from 0.878 to 2 s/mm2, and benign lesion ranged from 1.13 to 1.9 s/mm2. In general, malignant lesions had a lower ADC value.
Table 1.
Main characteristics of all studies included in the meta-analysis.

Table 2.
Imaging features of each studies.
3.3. Assessment of study quality
Detailed information about the QUADAS questionnaire of all enrolled studies is shown in Table 3. The overall quality of the studies was favorable, with all articles fulfilled 9 or more of the 14 items.
Table 3.
Quality assessment.

3.4. Diagnostic accuracy
A random effects model was used to calculate Sen and Spe of DWI with corresponding 95%CIs. The pooled sensitivity and specificity were 0.86 (95%CI, 0.83–0.89) and 0.81 (95%CI, 0.77–0.84), respectively (Fig. 2). The overall PLR and NLR were 5.07 (95%CI, 3.15–8.16) and 0.17 (95%CI, 0.10–0.30), respectively (Fig. 2). The diagnostic odds ratio was 35.23 (95%CI, 17.21–72.14) (Fig. 3). The AUC was 0.916 (Fig. 4). There was statistically significant heterogeneity in Spe (P < .001, I2 = 78.0%), PLR (P < .001, I2 = 82%), and DOR (P = .0027, I2 = 61.4%), respectively. No threshold effect was detected.
Figure 2.

Forest plot of sensitivity, specificity, positive likelihood ratio, and negative likelihood ratio of DWI for detection of ovarian cancer. Solid circles represent the study-specific point estimates of sensitivity, specificity, positive LR, and negative LR. Horizontal lines indicate 95% confidence interval (CI). The diamond represents the pooled estimates and 95% CI. DWI = diffusion weighted imaging, LR = likelihood ratio.
Figure 3.

Forest plot of DOR of DWI for detection of ovarian cancer. Solid circles represent the study-specific DOR. Horizontal lines indicate 95% confidence interval (CI). The area of solid circles reflects the study specific weight. The diamond represents the pooled DOR and 95% CI. DOR = diagnostic odds ratio, DWI = diffusion weighted imaging.
Figure 4.

The summary receiver operating characteristic (SROC) curve and Q∗ index of diagnostic performance of DWI in evaluation of ovarian cancer. Solid circles represent each study included in the meta-analysis. The size of each study is indicated by the size of the solid circle. The regression SROC curves summarize the overall diagnostic accuracy. DWI = diffusion weighted imaging.
3.5. Assessment of publication bias
The result of Deeks funnel plot asymmetry test revealed that no publication bias was observed (P = .6). The slope was not significant (Fig. 5), suggesting the absence of potential publication bias.
Figure 5.

Funnel graph to assess risk of publication bias among included studies. The funnel graph plots the log of the diagnostic odds ratio (DOR) against the standard error of the log of the DOR (an indicator of sample size). Solid circles represent each study in the meta-analysis. Regression line is shown.
4. Discussion
Ovarian cancer is one of the most fatal cancer-related diseases among women and even frequently diagnosed in young women. On initial diagnosis, most women were diagnosed at a progressive stage. Application of new techniques for differentiating between malignant and benign ovarian lesions has a positive effect on public health. Early-diagnosis of patients with ovarian cancer plays a critical role in improving patient outcomes and achieving better life quality. DWI as a noninvasive diagnostic technique is recently developed for distinguishing malignant tumors, determining lesion progression, and monitoring therapy responses.[17]
A recently published research[45] discussed the diagnosis performance of DWI in ovarian cancer, but the study focused on the difference of ADC values between benign and malignant ovarian lesions, without clearly evaluating the diagnosis accuracy of DWI, such as specificity and sensitivity. A similar systematic review published in 2015[41] on this topic reported the diagnosis accuracy of DWI in ovarian cancer. Since its publication, several new researches have emerged assessing DWI performance in detecting malignant ovarian cancer. Our objective was to provide an updated overview on this topic. The article included 5 of 10 studies in the previous review and also includes 2 literatures published in 2015. Although a recently published meta-analysis discussed in detail Spe, Sen, NLR, PLR, DOR, SROC of DWI,[46] some obvious shortcomings should be mentioned. First, the latest studies about DWI for diagnosing ovarian cancer were not included in their meta-analysis. Second, the included studies involved relatively narrow geographical region. Most of them were conducted in China and 4 out of 10 were published in Chinese, which might make their results less unrepresentative. Thirdly, the general QUADAS score was not favorable with most scoring less than 9 points, which would discount the credibility of results. Fourth, main characteristics of the included studies were not descripted in detail. The defects mentioned above have been amended in our meta-analysis, which involved global areas and scored high for study quality.
Results demonstrated that for ovarian cancer detection, DWI had both moderately high specificity (86%) and sensitivity (81%). Actually, high sensitivity and NPV of DWI indicated higher correct diagnostic rate for patients in early stages.[47] AUC was calculated by SROC which equaled 0.9160 indicating a promising result. Significant heterogeneity existed between the 12 included studies in our analysis. We found no significant threshold effect existed through the ROC plane and first eliminated threshold effect as the source of heterogeneity.
DWI is a functional measure of tumor microenvironment with quantitatively calculated ADC values to improve diagnostic accuracy. ADC values mainly depend on extracellular/intracellular components and reflect the diffusion characteristics of water in tissues.[33] Small ADC values demonstrate restricted diffusion which tends to indicate the presence of malignant tissue or hypercellularity.[39] There was the presence of a significant difference of ADC values in some studies between benign and malignant masses with an optical cut-off value which showed ADC value is useful in discriminating ovarian cancer from benign masses. Sensitivity, specificity, PPV, and NPV were observed with a corresponding cut-off in each article but the 3.[40,48,49] There was overlap of ADC value between malignancy and benign lesions. Pathologic structures of benign tumors such as fibromas, Brenner tumors, and cystadenofibromas probably contributed to the apparent discrepancy significantly. Inside the extracellular matrix of benign fibrous tumors the presence of dense network of collagen fibers and abundant collagen-producing fibroblastic cells decreased ADC value.[33] In addition, malignant tissues exhibited increased ADC value due to the existence of necrosis or cystic areas and fluid collection intervening papillary components.[40]
Meanwhile, we searched 2 articles on DWI for differentiating borderline from malignant ovarian lesions.[50,51] Histologically, borderline ovarian lesions are characterized by both benign and malignant masses, thus in this review they were excluded in order to avoid increasing the uncertainty of analysis results.
Notwithstanding, some limitations of the meta-analysis also should be acknowledged. First, only a small number of studies were included in the final meta-analysis because many studies were excluded based on eligibility criteria and may not be qualified to evaluate the diagnostic accuracy. All included studies were published in English which may have negated some of the gray literature. Second, MRI protocols for diagnosis of ovarian cancer were not standardized. Not all the studies used similar DWI parameters, such as b-value and magnet field strength among the studies. Studies used 1.5 T or 3 T and b value varied from 400 to 1500. Standardization of DWI protocol for ovarian cancer across the multicenter studies is recommended. Finally, the considerable overlap of ADC between cancer and noncancerous tissue made it difficult to determine a cutoff value which might be a source of statistical heterogeneity.[52]
In conclusion, DWI as an accurate noninvasive imaging method is a useful tool for diagnosis of ovarian cancer. Still, further prospective researches are required to build the value of DWI for diagnosis of ovarian cancer.
Footnotes
Abbreviations: ADC = apparent diffusion coefficient, AUC = area under the curve, DOR = diagnostic odds ratio, DWI = diffusion weighted imaging, FN = false-negative, FP = false-positive, HIS = high signal intensity, MRI = magnetic resonance imaging, NLR = negative likelihood ratio, PLR = positive likelihood ratio, SROC = summary receiver operating characteristic, TN = true-negative, TP = true-positive.
This work was supported by National Natural Science Foundation of China (Grant No. 81572850).
The authors have no conflicts of interest to disclose.
References
- [1].Fan T, Zhao Q, Chen JJ, et al. Clinical significance of circulating tumor cells detected by an invasion assay in peripheral blood of patients with ovarian cancer. Gynecol Oncol 2009;112:185–91. [DOI] [PMC free article] [PubMed] [Google Scholar]
- [2].Sankaranarayanan R, Ferlay J. Worldwide burden of gynaecological cancer: the size of the problem. Best Pract Res Clin Obstet Gynaecol 2006;20:207–25. [DOI] [PubMed] [Google Scholar]
- [3].Bourne TH, Campbell S, Reynolds KM, et al. Screening for early familial ovarian cancer with transvaginal ultrasonography and colour blood flow imaging. BMJ 1993;306:1025–9. [DOI] [PMC free article] [PubMed] [Google Scholar]
- [4].DePriest P, Gallion H, Pavlik E, et al. Transvaginal sonography as a screening method for the detection of early ovarian cancer. Gynecol Oncol 1997;65:408–14. [DOI] [PubMed] [Google Scholar]
- [5].Jacobs I, Skates S, MacDonald N, et al. Outcome of a pilot randomised controlled trial of ovarian cancer screening. Lancet 1999;253:1207–10. [DOI] [PubMed] [Google Scholar]
- [6].Banys M, Solomayer E-F, Becker S, et al. Disseminated tumor cells in bone marrow may affect prognosis of patients with gynecologic malignancies. Int J Gynecol Cancer 2009;19:948–52. [DOI] [PubMed] [Google Scholar]
- [7].Van Nagell J, DePriest P, Reedy M, et al. The efficacy of transvaginal sonographic screening in asymptomatic women at risk for ovarian cancer. Gynecol Oncol 2000;77:350–6. [DOI] [PubMed] [Google Scholar]
- [8].Berek JS, Schultes BC, Nicodemus CF. Biologic and immunologic therapies for ovarian cancer. J Clin Oncol 2003;21(Suppl):168s–74s. [DOI] [PubMed] [Google Scholar]
- [9].Rossing MA, Wicklund KG, Cushing-Haugen KL, et al. Predictive value of symptoms for early detection of ovarian cancer. J Natl Cancer Inst 2010;102:222–9. [DOI] [PMC free article] [PubMed] [Google Scholar]
- [10].Jayson GC, Kohn EC, Kitchener HC, et al. Ovarian cancer. Lancet 2014;384:1376–88. [DOI] [PubMed] [Google Scholar]
- [11].Zhao J-Y, Ma X-L, Li Y-Y, et al. Diagnostic accuracy of 18F-FDG-PET in patients with testicular cancer: a meta-analysis. Asian Pac J Cancer Prev 2013;15:3525–31. [DOI] [PubMed] [Google Scholar]
- [12].Bell R, Petticrew M, Sheldon T. The performance of screening tests for ovarian cancer: results of a systematic review. BJOG 1998;105:1136–47. [DOI] [PubMed] [Google Scholar]
- [13].Einhorn N, SJÖVALL K, KNAPP RC, et al. Prospective evaluation of serum CA 125 levels for early detection of ovarian cancer. Obstet Gynecol 1992;80:14–8. [PubMed] [Google Scholar]
- [14].Jacobs IJ, Skates S, Davies AP, et al. Risk of diagnosis of ovarian cancer after raised serum CA 125 concentration: a prospective cohort study. BMJ 1996;313:1355–8. [DOI] [PMC free article] [PubMed] [Google Scholar]
- [15].Panes J, Bouhnik Y, Reinisch W, et al. Imaging techniques for assessment of inflammatory bowel disease: joint ECCO and ESGAR evidence-based consensus guidelines. J Crohn's Colitis 2013;7:556–85. [DOI] [PubMed] [Google Scholar]
- [16].Kinkel K, Kaji Y, Yu KK, et al. Radiologic staging in patients with endometrial cancer: a meta-analysis 1. Radiology 1999;212:711–8. [DOI] [PubMed] [Google Scholar]
- [17].Patterson DM, Padhani AR, Collins DJ. Technology insight: water diffusion MRI—a potential new biomarker of response to cancer therapy. Nat Clin Pract Oncol 2008;5:220–33. [DOI] [PubMed] [Google Scholar]
- [18].Padhani AR, Liu G, Mu-Koh D, et al. Diffusion-weighted magnetic resonance imaging as a cancer biomarker: consensus and recommendations. Neoplasia 2009;11:102–25. [DOI] [PMC free article] [PubMed] [Google Scholar]
- [19].Zelhof B, Pickles M, Liney G, et al. Correlation of diffusion-weighted magnetic resonance data with cellularity in prostate cancer. BJU Int 2009;103:883–8. [DOI] [PubMed] [Google Scholar]
- [20].Marini C, Iacconi C, Giannelli M, et al. Quantitative diffusion-weighted MR imaging in the differential diagnosis of breast lesion. Eur Radiol 2007;17:2646–55. [DOI] [PubMed] [Google Scholar]
- [21].Yamada I, Aung W, Himeno Y, et al. Diffusion coefficients in abdominal organs and hepatic lesions: evaluation with intravoxel incoherent motion echo-planar MR imaging. Radiology 1999;210:617–23. [DOI] [PubMed] [Google Scholar]
- [22].Gauvain KM, McKinstry RC, Mukherjee P, et al. Evaluating pediatric brain tumor cellularity with diffusion-tensor imaging. Am J Roentgenol 2001;177:449–54. [DOI] [PubMed] [Google Scholar]
- [23].Thoeny HC. Diffusion-weighted MRI in head and neck radiology: applications in oncology. Cancer Imaging 2010;10:209. [DOI] [PMC free article] [PubMed] [Google Scholar]
- [24].Chen L, Zhang J, Bao J, et al. Meta-analysis of diffusion-weighted MRI in the differential diagnosis of lung lesions. J Magn Reson Imaging 2013;37:1351–8. [DOI] [PubMed] [Google Scholar]
- [25].Haghighi M, Shah S, Taneja SS, et al. Prostate cancer: diffusion-weighted imaging versus dynamic-contrast enhanced imaging for tumor localization—a meta-analysis. J Comput Assist Tomogr 2013;37:980–8. [DOI] [PubMed] [Google Scholar]
- [26].Ma X, Zhao X, Ouyang H, et al. Quantified ADC histogram analysis: a new method for differentiating mass-forming focal pancreatitis from pancreatic cancer. Acta Radiol 2014;55:785–92. [DOI] [PubMed] [Google Scholar]
- [27].Whiting P, Rutjes AW, Reitsma JB, et al. The development of QUADAS: a tool for the quality assessment of studies of diagnostic accuracy included in systematic reviews. BMC Med Res Methodol 2003;3:1. [DOI] [PMC free article] [PubMed] [Google Scholar]
- [28].Moses LE, Shapiro D, Littenberg B. Combining independent studies of a diagnostic test into a summary ROC curve: data-analytic approaches and some additional considerations. Stat Med 1993;12:1293–316. [DOI] [PubMed] [Google Scholar]
- [29].Higgins JP, Thompson SG, Deeks JJ, et al. Measuring inconsistency in meta-analyses. BMJ 2003;327:557–60. [DOI] [PMC free article] [PubMed] [Google Scholar]
- [30].Vamvakas EC. Meta-analyses of studies of the diagnostic accuracy of laboratory tests: a review of the concepts and methods. Arch Pathol Lab Med 1998;122:675. [PubMed] [Google Scholar]
- [31].Moreno G, Pantoja C. [Systematic reviews of studies of diagnostic test accuracy]. Rev Med Chil 2009;137:303–7. [PubMed] [Google Scholar]
- [32].Deeks JJ, Macaskill P, Irwig L. The performance of tests of publication bias and other sample size effects in systematic reviews of diagnostic test accuracy was assessed. J Clin Epidemiol 2005;58:882–93. [DOI] [PubMed] [Google Scholar]
- [33].Zhang P, Cui Y, Li W, et al. Diagnostic accuracy of diffusion-weighted imaging with conventional MR imaging for differentiating complex solid and cystic ovarian tumors at 1.5 T. World J Surg Oncol 2012;10:1. [DOI] [PMC free article] [PubMed] [Google Scholar]
- [34].Malek M, Pourashraf M, Mousavi A, et al. Differentiation of benign from malignant adnexal masses by functional 3 tesla MRI techniques: diffusion-weighted imaging and time-intensity curves of dynamic contrast-enhanced MRI. Asian Pac J Cancer Prev 2014;16:3407–12. [DOI] [PubMed] [Google Scholar]
- [35].Takeuchi M, Matsuzaki K, Nishitani H. Diffusion-weighted magnetic resonance imaging of ovarian tumors: differentiation of benign and malignant solid components of ovarian masses. J Comput Assist Tomogr 2010;34:173–6. [DOI] [PubMed] [Google Scholar]
- [36].Cappabianca S, Iaselli F, Reginelli A, et al. Value of diffusion-weighted magnetic resonance imaging in the characterization of complex adnexal masses. Tumori 2013;99:210–7. [DOI] [PubMed] [Google Scholar]
- [37].Kovač JD, Terzić M, Mirković M, et al. Endometrioid adenocarcinoma of the ovary: MRI findings with emphasis on diffusion-weighted imaging for the differentiation of ovarian tumors. Acta radiol 2015;57:758–66. [DOI] [PubMed] [Google Scholar]
- [38].Low RN, Sebrechts CP, Barone RM, et al. Diffusion-weighted MRI of peritoneal tumors: comparison with conventional MRI and surgical and histopathologic findings—a feasibility study. Am J Roentgenol 2009;193:461–70. [DOI] [PubMed] [Google Scholar]
- [39].Li W, Chu C, Cui Y, et al. Diffusion-weighted MRI: a useful technique to discriminate benign versus malignant ovarian surface epithelial tumors with solid and cystic components. Abdom Imaging 2012;37:897–903. [DOI] [PubMed] [Google Scholar]
- [40].Fujii S, Kakite S, Nishihara K, et al. Diagnostic accuracy of diffusion-weighted imaging in differentiating benign from malignant ovarian lesions. J Magn Reson Imaging 2008;28:1149–56. [DOI] [PubMed] [Google Scholar]
- [41].Fan X, Zhang H, Meng S, et al. Role of diffusion-weighted magnetic resonance imaging in differentiating malignancies from benign ovarian tumors. Int J Clin Exp Med 2015;8:19928–37. [PMC free article] [PubMed] [Google Scholar]
- [42].Kierans AS, Bennett GL, Mussi TC, et al. Characterization of malignancy of adnexal lesions using ADC entropy: comparison with mean ADC and qualitative DWI assessment. J Magn Reson Imaging 2013;37:164–71. [DOI] [PubMed] [Google Scholar]
- [43].Takeuchi M, Matsuzaki K, Harada M. Ovarian adenofibromas and cystadenofibromas: magnetic resonance imaging findings including diffusion-weighted imaging. Acta Radiol 2013;54:231–6. [DOI] [PubMed] [Google Scholar]
- [44].Zhang H, Zhang G-F, He Z-Y, et al. Prospective evaluation of 3T MRI findings for primary adnexal lesions and comparison with the final histological diagnosis. Arch Gynecol Obstet 2014;289:357–64. [DOI] [PubMed] [Google Scholar]
- [45].Kim H-J, Lee S-Y, Shin YR, et al. The value of diffusion-weighted imaging in the differential diagnosis of ovarian lesions: A meta-analysis. PLoS ONE 2016;11:e0149465. [DOI] [PMC free article] [PubMed] [Google Scholar]
- [46].Meng XF, Zhu SC, Sun SJ, et al. Diffusion weighted imaging for the differential diagnosis of benign vs. malignant ovarian neoplasms. Oncol Lett 2016;11:3795–802. [DOI] [PMC free article] [PubMed] [Google Scholar]
- [47].Das SK, Niu XK, Wang JL, et al. Usefulness of DWI in preoperative assessment of deep myometrial invasion in patients with endometrial carcinoma: a systematic review and meta-analysis. Cancer Imaging 2014;14:32. [DOI] [PMC free article] [PubMed] [Google Scholar]
- [48].Cappabianca S, Iaselli F, Reginelli A, et al. Value of diffusion-weighted magnetic resonance imaging in the characterization of complex adnexal masses. Tumori 2013;99:210–7. [DOI] [PubMed] [Google Scholar]
- [49].Low RN, Sebrechts CP, Barone RM, et al. Diffusion-weighted MRI of peritoneal tumors: comparison with conventional MRI and surgical and histopathologic findings—a feasibility study. AJR Am J Roentgenol 2009;193:461–70. [DOI] [PubMed] [Google Scholar]
- [50].Zhao SH, Qiang JW, Zhang GF, et al. Diffusion-weighted MR imaging for differentiating borderline from malignant epithelial tumours of the ovary: pathological correlation. Eur Radiol 2014;24:2292–9. [DOI] [PubMed] [Google Scholar]
- [51].Mimura R, Kato F, Tha KK, et al. Comparison between borderline ovarian tumors and carcinomas using semi-automated histogram analysis of diffusion-weighted imaging: focusing on solid components. Jpn J Radiol 2016;34:1–9. [DOI] [PubMed] [Google Scholar]
- [52].Nagayama M, Watanabe Y, Terai A, et al. Determination of the cutoff level of apparent diffusion coefficient values for detection of prostate cancer. Jpn J Radiol 2011;29:488–94. [DOI] [PubMed] [Google Scholar]