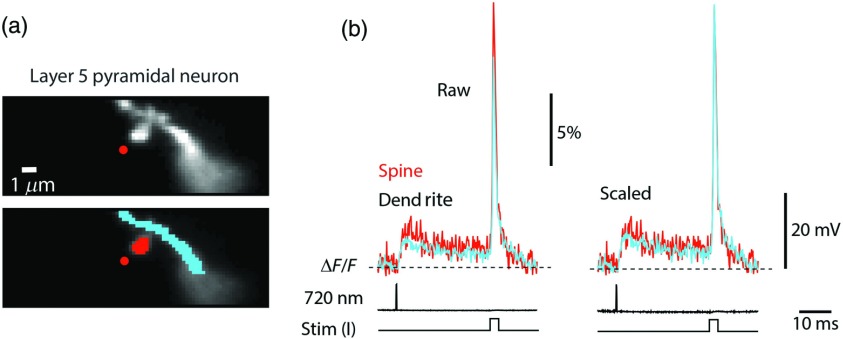
Fig. 2.
Voltage-sensitive dye recordings under wide-field illumination in epifluorescence microscopy mode. (a) Upper panel: fluorescence image of a basal dendrite branch with one spine in focus with objective. The red dot indicates the position of a stationary spot for two-photon uncaging. Lower panel: selection of pixels for spatial averaging of spine signal (red) and parent dendrite signals (blue). (b) Optical signals related to uncaging evoked EPSP and a subsequent bAP initiated by a depolarizing current pulse and used as a calibration standard. In the right panel, AP signals are scaled to the same height to correct for the difference in sensitivity in recordings from different locations. This is necessary for calibration of optical signals in terms of membrane potential.

