Supplemental digital content is available in the text.
Key Words: sensorimotor, traumatic brain injury, diagnostic tool, pursuit eye movement, neurological impairment
ABSTRACT
Purpose
Diffuse tissue damage from impact or blast traumatic brain injury (TBI) degrades information processing throughout the brain, often resulting in impairments in sensorimotor function. We have developed an eye-movement assessment test, consisting of a simple, appropriately randomized, radial tracking task together with a broad set of oculometric measures that can be combined to yield a sensitive overall indicator of sensorimotor functional status. We show here that this multidimensional method can be used to detect and characterize sensorimotor deficits associated with TBI.
Methods
To compare dynamic visuomotor processing of TBI subjects (n = 34) with a separate control population (n = 41), we used the Comprehensive Oculometric Behavioral Response Assessment (COBRA) method (Liston & Stone, J Vision. 14:12, 2014) to quantify 10 performance metrics for each subject. Each TBI subject's set of oculometrics was then combined to compute a single TBI impairment vector whose magnitude we refer to as the impairment index.
Results
In our TBI population, several individual oculometrics were significantly degraded, including pursuit latency, initial pursuit acceleration, pursuit gain, catch-up saccade amplitude, proportion smooth tracking, and speed responsiveness. Furthermore, the TBI impairment index discriminated TBI subjects from controls with an 81% probability that increased with self-reported TBI severity; although the 9 subjects self-reporting “little-to-no” residual impairment were statistically indistinguishable from controls (58% probability), the remaining 25 subjects were easily detectable (91% probability). Given the demonstrated link between higher-order visual perception/cognition and eye movements, we interpret the observed TBI-related impairments as degradations in the speed, accuracy, and precision of information processing within cortical circuits supporting higher-order visual processing and sensorimotor control, not just low-level brainstem motor deficits.
Conclusions
We conclude that multidimensional oculometric testing could be used as a sensitive screen for subtle neurological signs of subclinical neurological insults, to quantify functional impairment, to monitor deterioration or recovery, and to evaluate treatment efficacy.
Eye movements are the most frequent, biomechanically simplest, voluntary, visually driven motor responses, providing a model system to assess the sequelae of brain insult and injury. For more than a century, neurologists, psychologists, and psychiatrists have recognized that oculomotor behavior can reflect functional consequences of neural pathology,1 resulting in an extensive catalogue of qualitative oculomotor signs of drug toxicity, brain injury,2 and neurological disease,3,4 and standard ranges for normal behavior on common tasks.4,5 Thus, oculomotor examinations are used in both clinical (e.g. localizing lesions,3 diagnosing vestibular disorders,4 detecting cranial nerve palsies6) and field (e.g. detecting alcohol intoxication7,8 and fatigue9,10) settings. After traumatic brain injury (TBI), oculomotor signs such as disconjugate gaze,11 impaired saccadic inhibition,12 increased movement latency,12–16 amplified directional error,14–17 and impaired predictive tracking17,18 have been reported, all consistent with impaired visual processing, but the need for a readily available clinical tool to quantitatively and systematically assess motion processing persists.19 To this end, leaders in the oculomotor field have proposed using oculomotor metrics as biomarkers of disease or trauma.4,13,20–22
We document here a constellation of TBI-related functional impairments in dynamic visual processing.23 Consistent with previous results, we found deficits in several largely independent dimensions of oculomotor behavior in TBI subjects. Using a signal detection-based analysis, we computed a vector to characterize the nature of oculomotor impairment associated with TBI, and a scalar index to quantify the overall severity of an individual’s functional impairment along that particular axis. We conclude that a comprehensive multidimensional oculomotor screening test could be used to detect and quantify characteristic signs of functional impairment associated with TBI, to monitor the time course of deterioration or recovery, and to evaluate treatment outcomes.
METHODS
Eye-Tracking and Behavioral Task
Our methods describing the Comprehensive Oculometric Behavioral Response Assessment (COBRA) have been described in detail previously.23 After calibration,24 subjects participated in a 15-minute eye-movement tracking task consisting of 180 trials, using a chin and forehead rest for head stabilization. On each trial, a radial version of Rashbass step-ramp25 motion was then displayed whereby the target made a step in a random direction from a central fixation location, then moved back through the original location at a constant velocity (16–24 deg/s). The speed, direction, onset timing, and duration of target motion were independently randomized to promote uniform distribution of attention across space, time, and direction and to defeat strategies using anticipatory or predictive eye movements.
TBI and Control Populations
Our 34 TBI subjects were recruited from local medical facilities and brain injury rehabilitation centers who met the following requirements: (1) security rules allowed them access to NASA Ames Research Center (US citizen); (2) aged between 18 and 70 years old; (3) self-reported non-penetrating impact trauma to the head, verified using the Ohio State University TBI Identification Method26; (4) able to make their own medical decisions and sign informed consent forms; (5) able to sit still for 20 minutes, fixate for several seconds at a time, and track with the left eye while keeping their head still; (6) able to sit, stand, and walk without assistance; and (7) better than 20/200 visual acuity. Written informed consent was obtained before participation by our NASA Ames HRIRB-approved research protocol. Subjects completed a survey to document their age, gender, whether they needed glasses or contacts, when they were diagnosed, when they were injured, and a self-reported assessment of the severity of their current condition, with 1 being “little to no residual injury” and 10 being “completely disabled”. The causes of injuries sustained by our TBI population varied in both type and severity, including unspecified injuries (5 subjects), motor vehicle accidents (18 subjects), falls (1 subject), bicycle or skateboarding accidents (8 subjects), and assault (2 subjects). Of our 25 TBI subjects who reported their TBI on the mild-moderate-severe scale, 2 reported mild TBI, 5 reported moderate TBI, 3 reported moderate-to-severe TBI, and 15 reported severe TBI. Our subject population reported loss of consciousness (LOC) ranging in duration from no LOC to 2 months in a coma. Using the durations provided by the Ohio State University TBI Identification Method, 2 subjects reported no LOC, 7 subjects reported LOC less than 30 minutes, 1 subject reported LOC between 30 minutes and 24 hours, and 24 subjects reported LOC greater than 24 hours. The Freiburg Visual Acuity Test27 was used to measure binocular visual acuity. For our 34-subject TBI population (21 males, 13 females) ranging in age from 20 to 61 years (10th percentile: 23 years, 25th percentile: 26 years, 50th percentile: 34 years, 75th percentile: 49 years, 90th percentile: 57 years), the mean time since injury was 9.1 years (range: 6.9 months to 32.2 years; 10th percentile: 1.0 year, 25th percentile: 3.6 years, 50th percentile: 6.1 years, 75th percentile: 16.1 years, 90th percentile: 19.0 years) and the mean self-reported severity level was 3.3 (range: 1–7), with static visual acuity ranging from −0.28 to 0.44 (median: −0.08). Our 41-subject control population (22 males, 19 females) ranging in age from 20 to 56 years (10th percentile: 22 years, 25th percentile: 24 years, 50th percentile: 27 years, 75th percentile: 35 years, 90th percentile: 51 years) had static visual acuity ranging from −0.29 to 0.44 (median: −0.20).23 Although the age distribution of control subjects was skewed toward younger ages and the distribution of ages of TBI subjects was more uniform, the difference in age between the two populations was only borderline significant (p = 0.052, Wilcoxon rank sum test). Although our control population was not screened for history of brain injury, any unknown injuries in the control population would only serve to underestimate the TBI detectability using COBRA.
TBI Vector and TBI Impairment Index
To characterize the TBI-related signs present in our task, we used a previously described baseline dataset23 as a normative standard. First, we considered the set of 10 measurements from each subject in their native units (e.g. ms, deg, deg/s2) as a raw COBRA vector. We then converted raw measurements into z-values relative to our control dataset by subtracting the median and scaling by the estimated standard deviation:

where

and Φ−1 is the inverse of the normal cumulative distribution function. For the steady-state gain metric, we applied an arcsin correction to de-skew the raw data. Lastly, we flipped the sign for the latency, speed noise, saccadic amplitude, and direction noise metrics so that negative values indicate impairment. Normalized metrics (ω) with higher values correspond to faster, quicker, smoother, higher-gain, and more accurate tracking; lower values correspond to slower, less accurate movements with larger and more frequent saccades. For our analyses, we used a 10-element COBRA vector of normalized metrics:
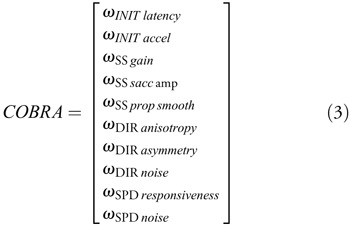
However, we excluded direction-tuning anisotropy and asymmetry metrics when the level of direction noise exceeded 25° (4 of 34 TBI subjects) because the fits that yield these two metrics became numerically unstable and unreliable.
To characterize TBI-related oculomotor signs, we averaged COBRA vectors across our TBI population to yield a TBI vector (Eq. 3):

where n is the number of TBI subjects. Because the COBRA vectors are “normalized”, each element of the TBI vector gives the distance (in z-values) between the average TBI subject and the average of the control population, defined as the origin. For example, if there were no effect for a given metric, the mean of the TBI population would fall near zero along that axis. While more complicated formulations (e.g. a vector based on signal-to-noise) may afford incrementally better statistical power, we opted for the most intuitive definition of the TBI vector.
To quantify the scalar magnitude of the functional impairment along the TBI vector, we took the dot product between an individual’s COBRA vector and the TBI vector to yield a cross-correlation–based scalar metric28:

The scaling factor in the denominator ensures a standard normal distribution of TBI impairment indices for our control population and the subtraction of  in the numerator ensures that an individual’s TBI impairment index is not based on circular logic (by excluding the individual’s contribution to the TBI vector).a
RESULTS
Our oculometric approach yields a 10-dimensional summary of an individual’s performance on our tracking task for both control and TBI subjects (Fig. 1). The left-hand column shows distributions of measurements for smooth pursuit latency, initial pursuit acceleration, steady-state pursuit gain, catch-up saccadic amplitude, and the proportion of smooth tracking; for each, we report the median as a summary metric. The control and TBI subjects shown highlight typical TBI-related oculomotor tracking deficits: longer latency, lower initial acceleration, lower steady-state gain, larger catch-up saccades, and a lower proportion of smooth movement. The right-hand column shows the respective metrics for direction-tuning (anisotropy, asymmetry, and noise) and speed tuning (responsiveness and noise). Again, obvious impairments in this TBI subject include high direction noise, large distortion in the direction-tuning function, and low speed-tuning responsiveness. Although these two subjects are drawn from populations with substantial across-subject variance, our overall results (Table 1) demonstrate degraded tracking for the TBI population.15,16
FIGURE 1.
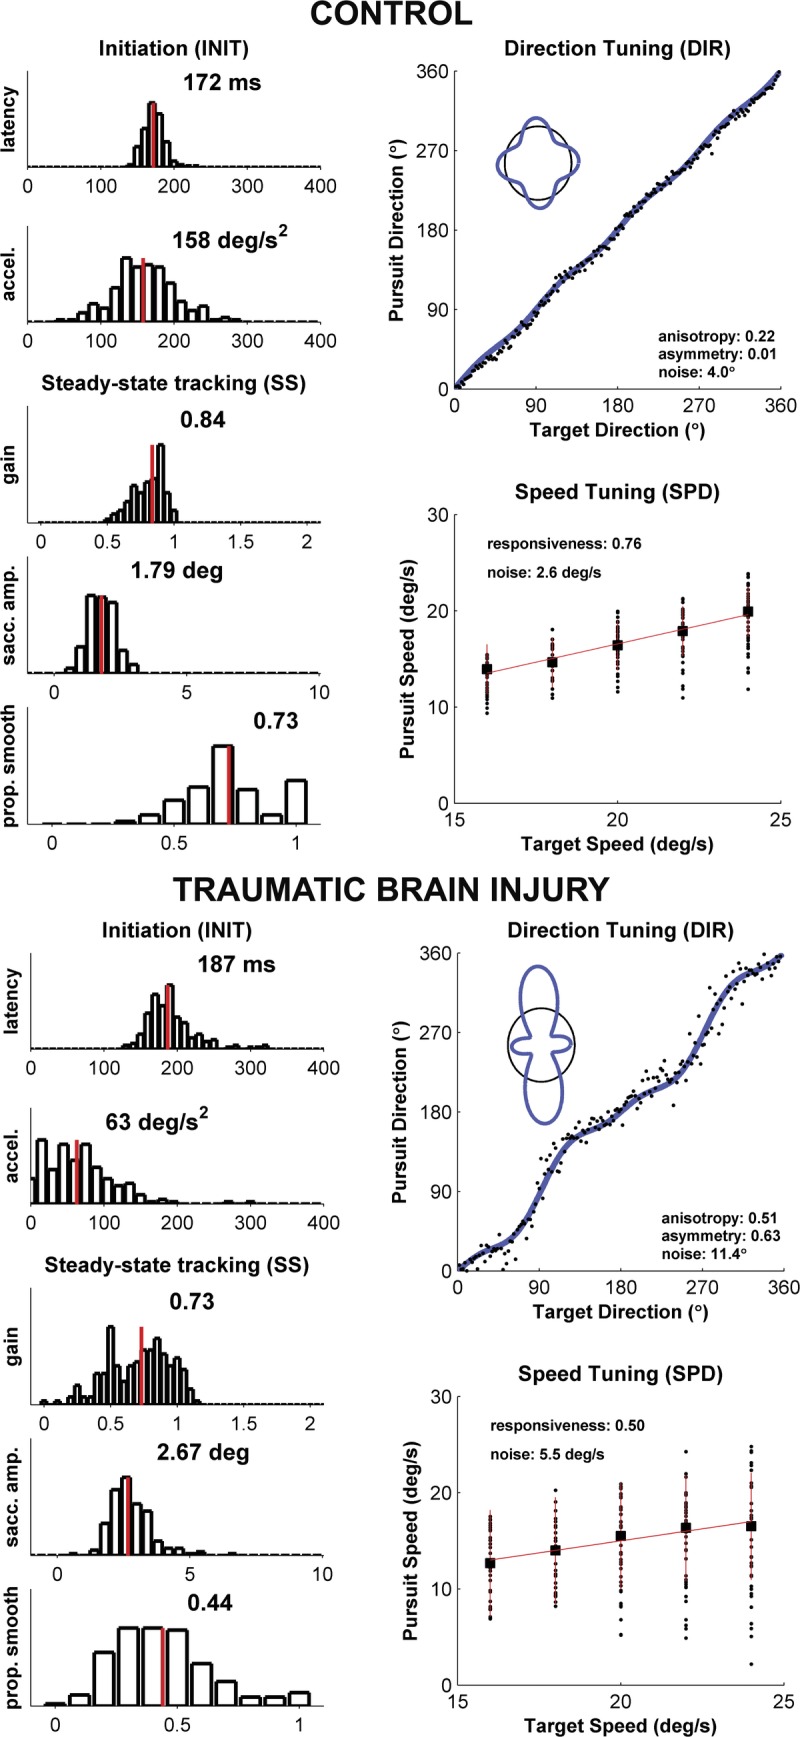
Summary of oculometric measurements for a typical control (A) and TBI subject (B). A COBRA summary sheet is shown for each. Histograms in the left-hand columns of both (A) and (B) plot across-trial measurements of standard measures of pursuit performance; direction-tuning and speed-tuning measurements of visual motion processing are shown in the right-hand columns. Pursuit initiation (INIT) measurements yield a skewed distribution of latencies and a quasi-normal distribution of accelerations. Steady-state (SS) tracking measurements (400 to 700 ms after motion onset) include pursuit gain (ratio of eye speed to target speed), the average amplitude of catch-up saccades, and the proportion of total eye displacement that was smooth. The direction-tuning (DIR) plot shows pursuit direction as a function of target direction for each trial; the inset illustrates the “cloverleaf” direction-gain anisotropy and asymmetry (blue line) referenced to the circle of unity gain (thin black line). The speed-tuning (SPD) plot shows pursuit speed as a function of target speed (solid black circles), the across-trial median (solid black square), and the speed-tuning slope (solid red line). Qualitative comparison of panels (A) and (B) captures some of the functional consequences of TBI-related tissue damage seen in the raw data.
TABLE 1.
Distributions of COBRA oculometrics for control and TBI populations
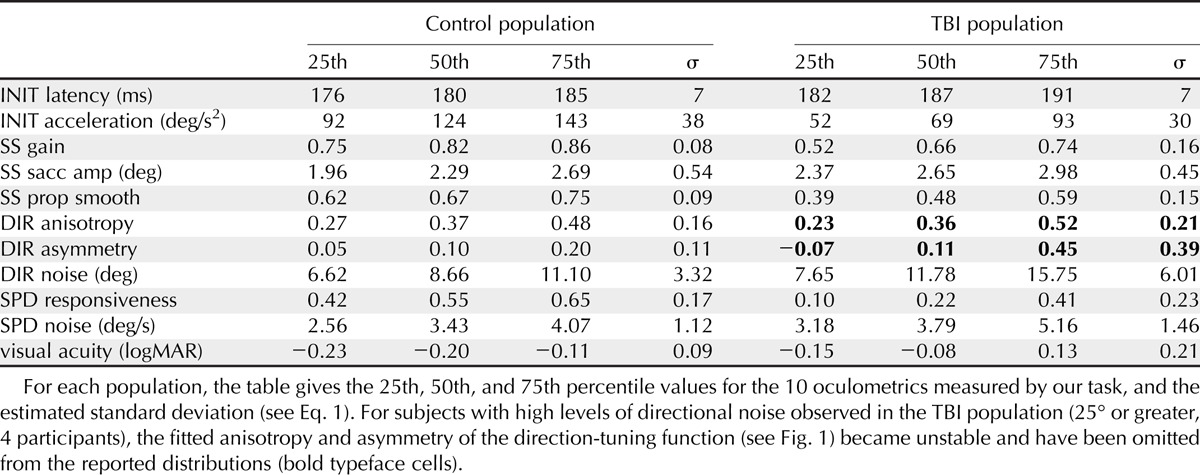
To characterize the set of TBI-related deficits, we first normalized the data by the across-subject variance in our control population and then compared the distributions of values for TBI and control populations using an across-subject paradigm. Fig. 2 plots the distributions of all 10 COBRA metrics and static visual acuity. Considered separately, we observed significant decrements in the TBI population for 6 of the 10 metrics (p < 0.0001 for initial acceleration, steady-state gain, steady-state proportion smooth, and speed responsiveness; p < 0.001 for initial latency; and p < 0.05 for steady-state saccade amplitude, Bonferroni-corrected Wilcoxon rank sum test). We also observed a significantly lower (p < 0.0001, Wilcoxon rank sum test) static visual acuity for the TBI subjects (median: −0.08 logMAR, 20/16 Snellen; range: −0.28 to 0.44, 20/11 to 20/55) with respect to the control population (median: −0.20 logMAR, 20/13 Snellen; range: −0.29 to 0.44, 20/10 to 20/55), similar to previous reports.29 Overall, visual acuity was not significantly correlated with self-reported TBI severity (p = 0.127, r = −0.20, Pearson’s R) so acuity problems are not a significant factor in their self-reported impairment.
FIGURE 2.
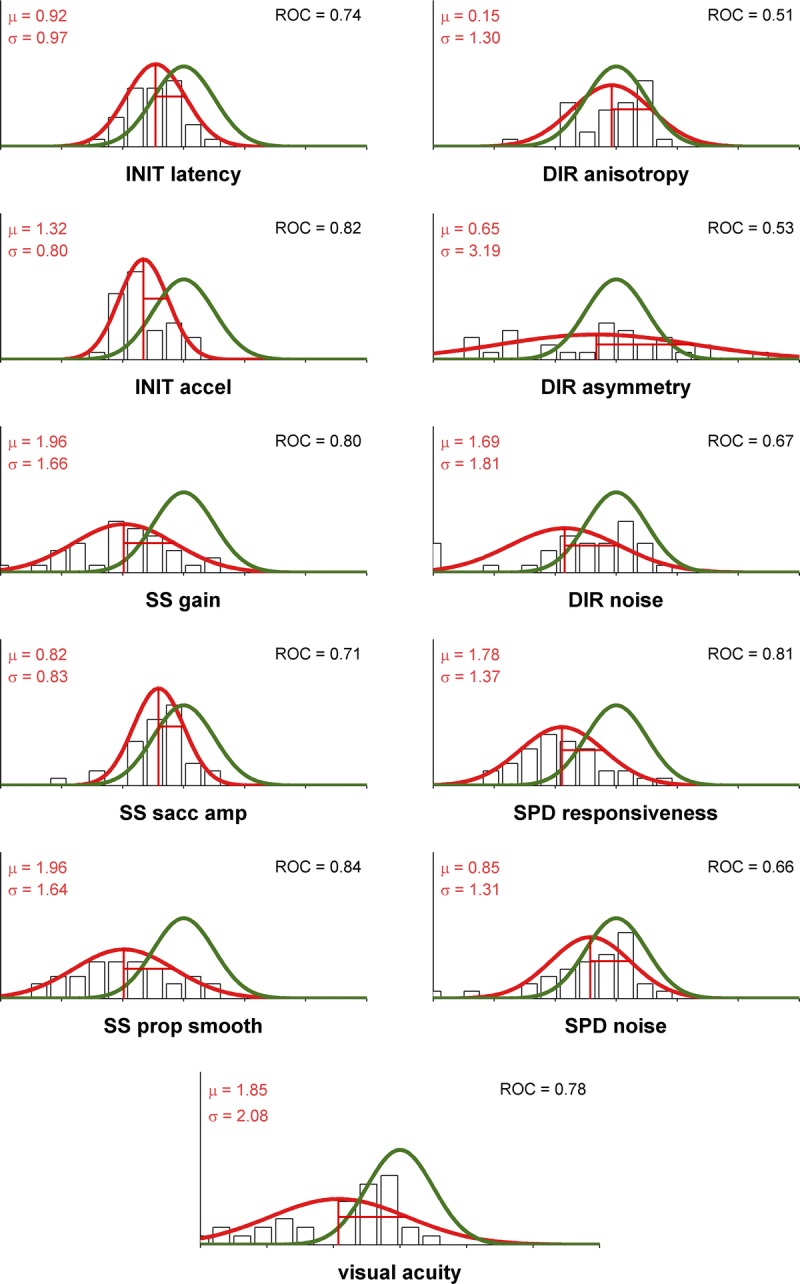
Oculometrics in control and TBI populations. Each panel plots the Gaussian fits to the distributions for control (solid green line) and TBI (solid red line) populations; the black unfilled histogram plots the values for the 34-subject TBI population. Vertical lines correspond to z-values. Inset into each set of axes are the mean and standard deviation for each of the TBI population’s metrics, and the ROC area between the two distributions, which quantifies the ability of an ideal observer to discriminate one sample at random from one of the two distributions. The TBI vector is defined by the set of 10 mean (μ) values.
To evaluate the ability of our data to identify the TBI status of the subject without the benefit of individual baselines, we applied two techniques from signal-detection theory28 in an across-subject paradigm. First, we defined the TBI vector (Fig. 3) to be the across-observer average of COBRA vectors (Eq. 2) for our TBI population, indicated by the red vertical lines in Fig. 2. Second, we computed the TBI impairment index (Eq. 4) for each TBI and control subject (Fig. 4). This index computes the scalar projection of a COBRA vector onto the TBI vector, quantifying how closely an individual’s behavior matches typical TBI-related signs. Overall, the correlation between visual acuity and the TBI impairment index was not quite significant (p = 0.053, r = 0.28, Pearson’s R) indicating that 92% of the variance in the TBI impairment index could not be attributed to static visual acuity problems.
FIGURE 3.
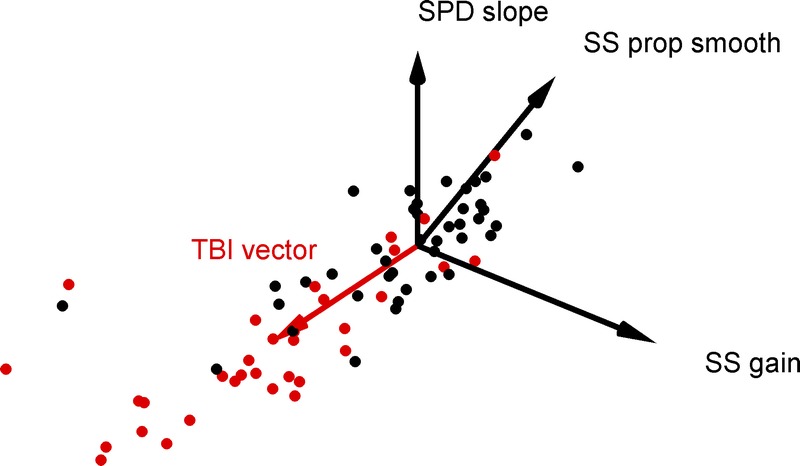
TBI vector. This scatterplot shows a 3-dimensional subspace of our 10-dimensional dataset for control (black filled circles) and TBI subjects (red filled circles). We defined the “TBI vector” (solid red vector) to point from the origin to the average across the TBI population. Two TBI data points falls right at the tip of the TBI vector and are difficult to segment from the arrowhead; one can be seen to occlude a nearby control data point, and the other can be seen as a red fringe occluded by the same control data point. As the TBI vector gives the typical pattern of oculomotor signs observed with TBI subjects, the projection of any given subject’s vector along the TBI vector, the subject’s TBI impairment index, is an overall scalar measure of the severity of their impairment, scaled to the unit variance of the control population. An animation of this figure is included as supplementary online material (available at http://links.lww.com/OPX/A245); the first revolution shows the 41 control and 34 TBI data points then the TBI vector is added.
FIGURE 4.
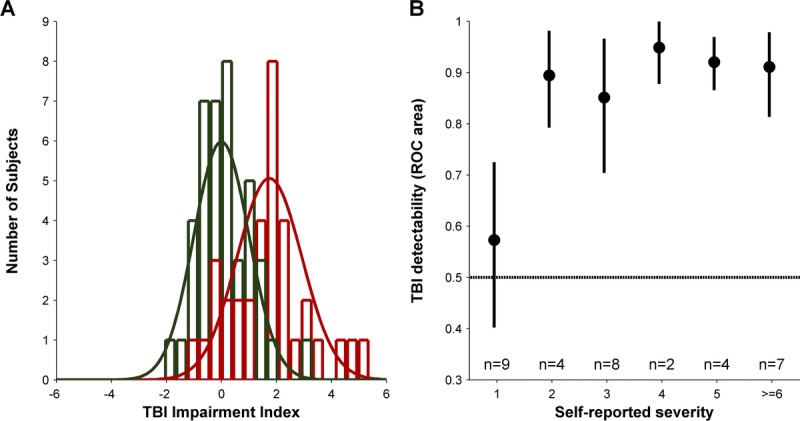
TBI impairment index. (A) plots the histogram of TBI impairment indices (red unfilled bars) and fitted normal distribution (solid red line) for our population of 34 TBI subjects and the histogram of baseline data for control subjects (green unfilled bars) and standard normal distribution (solid green line). (B) plots the measured ROC area for each of the self-reported severity in our TBI population. Filled black circles plot the average of 1000 bootstrapped measurements for each of the severity levels; error bars show the central 90% of the bootstrapped distribution. Inset text shows the number of TBI subjects at each self-reported severity level.
To compute the overall detectability of TBI subjects using our two populations, we computed the ROC area28 for the two distributions (Fig. 4A), which was 0.81. As control analyses, we computed analogous ROC areas for the subset of our TBI population (n = 23) with visual acuity better than the 95th percentile of our control population (their detectability was still 0.80) and for the subset of our TBI population (n = 29) that fell within the age range (20–56 years) of our control population (their detectability was still 0.83). This shows that the detection by COBRA that a given TBI subject is not within the normal population is not an indirect consequence of the negligible mismatches in acuity or age between our overall TBI and control populations.
We also subdivided our entire TBI population according to self-reported severity and computed ROC area for each severity level separately (Fig. 4B). For observers reporting “little to no residual injury” (severity level of 1), their TBI detectability (0.59) was not significantly different than chance (p > 0.05, bootstrap test) although we cannot rule out that the value was actually slightly higher than 0.5. For observers reporting more severe symptoms (severity level ≥ 2), we observed TBI detectability ranging from 0.85 to 0.95 (average: 0.91). Furthermore, across our entire TBI population, we observed a significant correlation between self-reported severity and TBI impairment index (p < 0.05, r = 0.34, Pearson’s R).
DISCUSSION
Our noninvasive, 15-minute Comprehensive Oculometric Behavioral Response Assessment (COBRA) task generates 10 performance metrics that quantify an individual’s dynamic visuomotor processing capability.23 We have now shown that COBRA provides a sensitive screening tool for detecting and characterizing impairments associated with TBI, even years after recovery. First, we used COBRA to quantify the characteristic constellation of TBI-related deficits in a population of 34 TBI subjects, expressed as a vector (i.e. the TBI vector). Presumably, non-TBI brain pathologies will show different characteristic vectors, but we have yet to systematically test this hypothesis. Second, we used the TBI vector to quantify each subject’s functional neurological impairment. Third, we used these TBI impairment indices to evaluate how well COBRA can detect TBI-related signs. For our entire TBI population, COBRA could discriminate TBI subjects from controls with 81% probability. For the nine TBI subjects who reported “little-to-no” residual injury, TBI impairment indices were not statistically distinguishable from those of control subjects (only 58% probability of detection); for the 25 TBI subjects who reported substantial residual effects, COBRA discriminated them with 91% probability.
In general, using oculomotor measures to screen for neural pathology may hold potential shortcomings, due to the fact that not all brain structures mediate visuomotor behavior. Whereas a punctate hippocampal tumor is unlikely to cause any discernable impairment on familiar oculomotor tasks, the diffuse nature of TBI suggests that visuomotor tasks, which require a wide swath of cortical and cerebellar circuitry to estimate, predict, and track precise motion trajectories, are well suited to detect such injuries. Even mild, yet diffuse, insults to neural circuitry may degrade the quality of the final output behavior. However, the oculomotor deficits observed among TBI subjects may also reflect factors that co-occur with TBI (e.g. stroke, medications, depression).
That said, differing visual, cognitive, and motor demands (e.g. executive function, response inhibition, attention, perception, expectation, prediction, memory) of various oculomotor paradigms (e.g. predictive tracking, gap/overlap saccades, antisaccades, memory-guided saccades, gaze conjugacy) likely engage specific brain networks to differing degrees. In particular, different degrees of injury affecting different networks may be necessary for specific oculomotor signs to be observed (e.g. saccadic hypometria, poor saccadic inhibition, gaze disconjugacy, altered saccade dynamics) in any particular task. For example, head injury cases presenting with ocular motor nerve palsy are more severe than those without,4,30 suggesting that certain oculomotor signs (e.g. gaze disconjugacy) may occur after a threshold level of damage to a localized set of brainstem structures (i.e. IIIrd, IVth, or VIth cranial nerves and their associated nuclei) resulting in greater difficulty in detecting milder cases. To assay neural processing across a diverse set of brain areas, our COBRA vector uses a wider array of behaviors to capture the entire neural hierarchy of visuomotor processing: initial pursuit latency and acceleration driven by retinal slip,31 later direction tuning determined by extrastriate cortical processing associated with perception,32,33 catch-up saccades driven by anticipated retinal position error,34 and steady-state motion processing driven by perceived object motion.35
In our data (Fig. 2), the magnitude of the deficits observed in our 10 COBRA metrics differed. Although all 10 metrics tested had negative mean values, four did not significantly differ from control metrics and two were only mildly impacted, whereas the remaining four were severely impacted. Because they all had similar variance, these four metrics had more statistical power to detect TBI than the remaining six. The value of having large set of largely independent COBRA measures is to increase the likelihood of detecting different types of pathologies. To go one step further, as the relationship between structural damage and functional impairment becomes better understood by pairing behavioral tests like COBRA with structural scans, anatomical explanations for the relatively high detection power of certain oculometrics for certain pathologies (e.g. speed responsiveness for TBI) may develop and also the reason that others (e.g. gaze disconjugacy) are only observed in more severe cases.4 Of course, more statistically powerful, as-yet undescribed, behavioral metrics may be discovered. The value of our impairment index is that a single scalar distills the 10 metrics along the single direction most consistent with TBI and can easily be refined and extended as additional valuable and independent dimensions are discovered.
Last, we must emphasize that COBRA metrics are not only able to detect TBI-related impairment (Fig. 4A), they also reflect TBI severity as documented by self-report. As a population, we observed normally distributed TBI impairment indices that overlap the control population (Fig. 4A), largely due to those TBI subjects with “little-to-no” residual injury (Fig. 4B), and leaving those TBI subjects with meaningful residual injuries (severity level > 2) discriminable at 91%. However, future studies of acute TBI patients with more clinically rigorous measures of the severity of their neurological impairment (e.g. the x-axis of a future Fig. 4B) will be needed to demonstrate the value of COBRA in clinical triage settings.
The first clinical eye-tracking study1 used eye movements to assay neural function. However, based on work showing tight linkages between visual perception/cognition and oculomotor responses,35–37 we expand the familiar association in neurology between oculomotor behavior and the function of certain cranial nerves and their associated brainstem nuclei3 to include the 10 COBRA metrics as neurological indicators of dynamic visuomotor processing at several functional stages: from retinal transduction, to cortical circuitry supporting motion perception and spatial attention, to the cortico-brainstem-cerebellar pathways supporting sensorimotor action. We conclude that characteristic datasets aggregated from standardized oculomotor test batteries (such as COBRA) may allow clinicians to detect, quantify, and characterize impairments from transient brain insults (e.g. due to trauma, drug toxicity, or alcohol) and permanent injuries6,14,18; to detect the onset of degenerative,22 developmental,38 and psychiatric39,40 disorders and track their progression; and to evaluate the effectiveness of candidate therapeutic interventions, even in the absence of an individual baseline.
ACKNOWLEDGMENTS
This work has been supported by the Office of Naval Research Force Health Protection program (N0001415IP00028/30). The authors thank Laura Jamison from Santa Clara Valley Medical Center for invaluable assistance in recruiting subjects. DL and LS share a non-provisional patent application (application #61994673), which is a subject of this publication, not yet licensed or otherwise commercialized.
aScalling Factor = ∥CHOL (COV (CONTROL))·TBI–∥
CONTROL is the matrix containing all 41 COBRA vectors in the control population, COV is the covariance matrix, and CHOL is the Cholesky decomposition. Subtracting COBRA/n is necessary for small sample sizes but can be omitted for samples with n ≥ 20.
Supplemental digital content is available for this article. Direct URL citations appear in the printed text and are provided in the HTML and PDF versions of this article on the journal’s Web site (www.optvissci.com).
REFERENCES
- 1.Diefendorf AR, Dodge R. An experimental study of the ocular reactions of the insane from photographic records. Brain 1908;31:451–89. [Google Scholar]
- 2.Barker F, Ciuffreda K, Jacobs R, et al. Development of Traumatic Brain Injury Detection Using Oculomotor and Eye Movement Tracking. Ft. Detrick, MD: Non-Invasive Neurologic Device Integrated Product Team, U.S. Army Medical Research & Materiel Command; 2013. [Google Scholar]
- 3.Bradley WG, Daroff RB, Fenichel GM, et al. Neurology in Clinical Practice. 4th ed Philadelphia, PA: Butterworth-Heinemann; 2004. [Google Scholar]
- 4.Leigh RJ, Zee DS. The Neurology of Eye Movements. 4th ed New York: Oxford University Press; 2006. [Google Scholar]
- 5.Boff KR, Lincoln JE. eds, Engineering Data Compendium: Human Perception and Performance. Wright-Patterson A.F.B., Ohio: Harry G. Armstrong Aerospace Medical Research Laboratory; 1988. [Google Scholar]
- 6.Samadani U, Farooq S, Ritlop R, et al. Detection of third and sixth cranial nerve palsies with a novel method for eye tracking while watching a short film clip. J Neurosurg 2015;122:707–20. [DOI] [PMC free article] [PubMed] [Google Scholar]
- 7.Aschan G. Different types of alcohol nystagmus. Acta Otolaryngol Suppl 1958;140:69–78. [DOI] [PubMed] [Google Scholar]
- 8.Citek K, Ball B, Rutledge DA. Nystagmus testing in intoxicated individuals. Optometry 2003;74:695–710. [PubMed] [Google Scholar]
- 9.Schmidt D, Abel LA, Dell’Osso LF, et al. Saccadic velocity characteristics: intrinsic variability and fatigue. Aviat Space Environ Med 1979;50:393–5. [PubMed] [Google Scholar]
- 10.Cazzoli D, Antoniades CA, Kennard C, et al. Eye movements discriminate fatigue due to chronotypical factors and time spent on task—a double dissociation. PLoS One 2014;9:e87146. [DOI] [PMC free article] [PubMed] [Google Scholar]
- 11.Samadani U, Ritlop R, Reyes M, et al. Eye tracking detects disconjugate eye movements associated with structural traumatic brain injury and concussion. J Neurotrauma 2015;32:548–56. [DOI] [PMC free article] [PubMed] [Google Scholar]
- 12.Kraus MF, Little DM, Donnell AJ, et al. Oculomotor function in chronic traumatic brain injury. Cogn Behav Neurol 2007;20:170–8. [DOI] [PubMed] [Google Scholar]
- 13.Pearson BC, Armitage KR, Horner CW, et al. Saccadometry: the possible application of latency distribution measurement for monitoring concussion. Br J Sports Med 2007;41:610–2. [DOI] [PMC free article] [PubMed] [Google Scholar]
- 14.Heitger MH, Jones RD, Dalrymple-Alford JC, et al. Motor deficits and recovery during the first year following mild closed head injury. Brain Inj 2006;20:807–24. [DOI] [PubMed] [Google Scholar]
- 15.Heitger MH, Anderson TJ, Jones RD, et al. Eye movement and visuomotor arm movement deficits following mild closed head injury. Brain 2004;127:575–90. [DOI] [PubMed] [Google Scholar]
- 16.Suh M, Kolster R, Sarkar R, et al. Cognitive and Neurobiological Research Consortium. Deficits in predictive smooth pursuit after mild traumatic brain injury. Neurosci Lett 2006;401:108–13. [DOI] [PubMed] [Google Scholar]
- 17.Maruta J, Suh M, Niogi SN, et al. Visual tracking synchronization as a metric for concussion screening. J Head Trauma Rehabil 2010;25:293–305. [DOI] [PubMed] [Google Scholar]
- 18.Suh M, Basu S, Kolster R, et al. Cognitive and Neurobiological Research Consortium. Increased oculomotor deficits during target blanking as an indicator of mild traumatic brain injury. Neurosci Lett 2006;410:203–7. [DOI] [PubMed] [Google Scholar]
- 19.Pelak VS, Hoyt WF. Symptoms of akinetopsia associated with traumatic brain injury and Alzheimer’s disease. Neuro-Ophthalmology 2005;29:137–42. [Google Scholar]
- 20.Daved SZ. What the future holds for the study of saccades. Biocybernet Biomed Eng 2012;32:65–76. [Google Scholar]
- 21.Leigh RJ, Kennard C. Using saccades as a research tool in the clinical neurosciences. Brain 2004;127:460–77. [DOI] [PubMed] [Google Scholar]
- 22.Ali FR, Michell AW, Barker RA, et al. The use of quantitative oculometry in the assessment of Huntington’s disease. Exp Brain Res 2006;169:237–45. [DOI] [PubMed] [Google Scholar]
- 23.Liston DB, Stone LS. Oculometric assessment of dynamic visual processing. J Vis 2014;14:12. [DOI] [PubMed] [Google Scholar]
- 24.Beutter BR, Stone LS. Motion coherence affects human perception and pursuit similarly. Vis Neurosci 2000;17:139–53. [DOI] [PubMed] [Google Scholar]
- 25.Rashbass C. The relationship between saccadic and smooth tracking eye movements. J Physiol 1961;159:326–38. [DOI] [PMC free article] [PubMed] [Google Scholar]
- 26.Corrigan JD, Bogner J. Initial reliability and validity of the Ohio State University TBI Identification Method. J Head Trauma Rehabil 2007;22:318–29. [DOI] [PubMed] [Google Scholar]
- 27.Bach M. The Freiburg Visual Acuity test—automatic measurement of visual acuity. Optom Vis Sci 1996;73:49–53. [DOI] [PubMed] [Google Scholar]
- 28.Green DM, Swets JA. Signal Detection Theory and Psychophysics. New York: Wiley; 1966. [Google Scholar]
- 29.Hellerstein LF, Freed S, Maples WC. Vision profile of patients with mild brain injury. J Am Optom Assoc 1995;66:634–9. [PubMed] [Google Scholar]
- 30.Dhaliwal A, West AL, Trobe JD, et al. Third, fourth, and sixth cranial nerve palsies following closed head injury. J Neuroophthalmol 2006;26:4–10. [DOI] [PubMed] [Google Scholar]
- 31.Lisberger SG, Westbrook LE. Properties of visual inputs that initiate horizontal smooth pursuit eye movements in monkeys. J Neurosci 1985;5:1662–73. [DOI] [PMC free article] [PubMed] [Google Scholar]
- 32.Stone LS, Krauzlis RJ. Shared motion signals for human perceptual decisions and oculomotor actions. J Vis 2003;3:725–36. [DOI] [PubMed] [Google Scholar]
- 33.Masson GS, Stone LS. From following edges to pursuing objects. J Neurophysiol 2002;88:2869–73. [DOI] [PubMed] [Google Scholar]
- 34.de Brouwer S, Yuksel D, Blohm G, et al. What triggers catch-up saccades during visual tracking? J Neurophysiol 2002;87:1646–50. [DOI] [PubMed] [Google Scholar]
- 35.Stone LS, Beutter BB, Eckstein MP, et al. Perception and eye movements. In: Squire LR, ed. Encyclopedia of Neuroscience. Oxford, England: Academic Press; 2009;503–11. [Google Scholar]
- 36.Kowler E, McKee SP. Sensitivity of smooth eye movement to small differences in target velocity. Vision Res 1987;27:993–1015. [DOI] [PubMed] [Google Scholar]
- 37.Beutter BR, Stone LS. Human motion perception and smooth eye movements show similar directional biases for elongated apertures. Vision Res 1998;38:1273–86. [DOI] [PubMed] [Google Scholar]
- 38.Takarae Y, Minshew NJ, Luna B, et al. Pursuit eye movement deficits in autism. Brain 2004;127:2584–94. [DOI] [PubMed] [Google Scholar]
- 39.Levin S, Luebke A, Zee DS, et al. Smooth pursuit eye movements in schizophrenics: quantitative measurements with the search-coil technique. J Psychiatr Res 1988;22:195–206. [DOI] [PubMed] [Google Scholar]
- 40.Hutton S, Kennard C. Oculomotor abnormalities in schizophrenia: a critical review. Neurology 1998;50:604–9. [DOI] [PubMed] [Google Scholar]


