

Abstract
Obesity is one of the major health issues in the United States. Consumption of diets rich in energy, notably from fats and sugars (high-fat/high-sugar diet: HF/HSD) is linked to the development of obesity and a popular dietary approach for weight loss is to reduce fat intake. Obesity research traditionally uses low and high fat diets and there has been limited investigation of the potential detrimental effects of a low-fat/high-sugar diet (LF/HSD) on body fat accumulation and health. Therefore, in the present study, we investigated the effects of HF/HSD and LF/HSD on microbiota composition, gut inflammation, gut-brain vagal communication and body fat accumulation. Specifically, we tested the hypothesis that LF/HSD changes the gut microbiota, induces gut inflammation and alters vagal gut-brain communication, associated with increased body fat accumulation.
Sprague-Dawley rats were fed an HF/HSD, LF/HSD or control low-fat/low-sugar diet (LF/LSD) for 4 weeks. Body weight, caloric intake, and body composition were monitored daily and fecal samples were collected at baseline, 1, 6 and 27 days after the dietary switch. After four weeks, blood and tissues (gut, brain, liver and nodose ganglia) were sampled. Both HF/HSD and LF/HSD-fed rats displayed significant increases in body weight and body fat compared to LF/LSD-fed rats. 16S rRNA sequencing showed that both HF/HSD and LF/HSD-fed animals exhibited gut microbiota dysbiosis characterized by an overall decrease in bacterial diversity and an increase in Firmicutes/Bacteriodetes ratio. Dysbiosis was typified by a bloom in Clostridia and Bacilli and a marked decrease in Lactobacillus spp. LF/HSD-fed animals showed a specific increase in Sutterella and Bilophila, both Proteobacteria, abundances of which have been associated with liver damage. Expression of pro-inflammatory cytokines, such as IL-6, IL-1β and TNFα was upregulated in the cecum while levels of tight junction protein occludin were downregulated in both HF/HSD and LF/HSD fed rats. HF/HSD and LF/HSD-fed rats also exhibited an increase in cecum and serum levels of lipopolysaccharide (LPS), a pro-inflammatory bacterial product. Immunofluorescence revealed the withdrawal of vagal afferents from the gut and at their site of termination the nucleus of the solitary tract (NTS) in both the HF/HSD and LF/HSD rats. Moreover, there was significant microglia activation in the nodose ganglia, which contain the vagal afferent neuron cell bodies, of HF/HSD and LF/HSD rats. Taken together, these data indicate that, similar to HF/HSD, consumption of an LF/HSD induces dysbiosis of gut microbiota, increases gut inflammation and alters vagal gut-brain communication. These changes are associated with an increase in body fat accumulation.
Keywords: Microbiota, body fat, sugar, inflammation, vagal nerve, obesity
1. INTRODUCTION
Obesity has reached epidemic proportion in Western countries, including the United States [1]. Evidence suggests that consumption of an energy-dense high-fat/high-sugar diet (HF/HSD) promotes excessive weight gain and that there is a direct relationship between the amount of dietary fat and the degree of obesity [2]. Consequently, lowering dietary fat intake has been considered one of the best approaches for weight management. However, a growing body of evidence has been pointing to its inadequacy for weight loss or disease prevention [3, 4]. Interestingly, many commercial low-fat foods are high in sugar and refined carbohydrates [5] and increased intake of sugars, especially fructose has been linked to increased body fat accumulation and obesity [6].
There is evidence that the gut microbiota plays a role in obesity [7]. In humans and animal models, changes in diet composition can rapidly trigger changes in gut microbiota composition [8, 9]. Interestingly, colonization of germ-free (GF) animals with either a “lean” or an “obese” microbiota leads to a recapitulation of the donor phenotype, identifying the gut microbiota as a potential driver of obesity [10]. The gut microbiota impacts the host metabolism and notably affects energy harvest and fat storage [8, 10] as well as inflammatory status [10, 11]. Consumption of HF/HSD has been associated with increased production of bacterial pro-inflammatory factors, such a lipopolysaccharide (LPS, a breakdown product of the outer membrane of gram-negative bacteria) [7, 11]. Moreover, diet-driven gut inflammation results in impairment in the gut epithelial barrier leading to enhanced LPS uptake into the plasma [7, 12]. An increase in circulating LPS, also called metabolic endotoxemia, can trigger systemic inflammation, impair liver function, alter food intake [12] and promote body fat accumulation [11, 12]. Interestingly, LPS has been shown in culture to activate vagal afferent neurons [13] and chronic treatment with low doses of LPS results in NG inflammation and impairs vagal satiety signaling [12].
Gut-originating peptides signal via the vagus nerve to control meal initiation and termination [14, 15]. Disruption of vagal afferent signaling is sufficient to drive obesity in a diet-induced rat obesity model [13]. Therefore, microbiota-mediated dysregulation of gut-brain vagal communication might contribute to the pathogenesis of obesity and its related diseases.
In the present study, we investigated the influence of diets rich in sugars, with different fat contents, on microbiota composition and gut-brain axis inflammation. Results show that regardless of fat contents, diets rich in sugars promote gut microbiota dysbiosis, induce gut inflammation, increase gut permeability, and alter vagal gut-brain communication when compared to control chow diet.
2. MATERIALS AND METHODS
2.1 Animals and diet
Male Sprague-Dawley rats (6 weeks old; Envigo, Indianapolis, IN) were housed in individual plastic cages in a temperature-controlled vivarium with ad libitum access to food and water. Rats were maintained on a 12-h light/dark schedule and habituated to laboratory conditions for one week before their diet was changed. All animal procedures were approved by the University of Georgia Institutional Animal Care and Use Committee and conformed to National Institutes of Health guidelines for the care and use of Laboratory animals (publication No. 8023, revised 1978). All efforts were made to minimize both the number of animals used and animal suffering.
Rats were randomly divided into three experimental groups (n = 4) and fed for four weeks with either normal low fat, low sucrose laboratory chow (LF/LSD, kcal%: Carb, 58; Fat, 13.5; Prot, 24.5, # 5053, PicoLab Rodent diet, Louis, MO); high-fat, high sucrose diet (HF/HSD; Kcal%: Carb, 35; Fat, 45; Prot, 20, # D12451, Research Diets, New Brunswick, NJ), or sucrose matched low-fat diet (LF/HSD; Kcal%: Carb, 70; Fat, 10; Prot, 20, # D12450H, Research Diets) with each of the diets containing sufficient minerals and vitamins (Table 1). LF/HSD and HF/HSD primarily contain refined carbohydrates and were matched for sucrose content; while the LF/LSD contains less than one-fifth the amount of sucrose (3.2% kcal) as the other two diets (17% kcal). The composition of the LF/LSD was analyzed by NP Analytical Laboratories (St. Louis, MO).
Table 1.
Composition of diets used in this study
| LF/LSD Lab Diet PicoLab Rodent Diet 20 (5053) | LF/HSD Research Diets D12450H 17% Sucrose Match to D12451 | HF/HSD Research Diets D12451 | ||||
|---|---|---|---|---|---|---|
|
|
||||||
| Gram % | kcal % | Gram % | kcal % | Gram % | kcal % | |
|
|
||||||
| Fat | 4.5 | 13.1 | 4.3 | 10.0 | 24.0 | 45.0 |
|
| ||||||
| Protein | 20 | 24.5 | 19.2 | 20.0 | 24.0 | 20.0 |
|
| ||||||
| Carbohydrates | 53.5 | 62.4 | 67.3 | 70.0 | 41 | 35.0 |
|
| ||||||
| Sucrose | 3.2 | 3.2 | 16.4 | 17.0 | 20.1 | 17.0 |
|
| ||||||
| Fiber | 6.0 | 0.0 | 4.7 | 0.0 | 5.8 | 0.0 |
|
| ||||||
| Total kcal/g | 3.43 | 3.85 | 4.73 | |||
|
| ||||||
Abbreviation: Regular diet –LF/LSD; low-fat diet –LF/HSD; and high-fat diet – HF/HSD.
2.2 Measurement of body composition, body weight, and food intake
Body weight, body composition, and food intake were measured daily throughout the experiment. A Minispec LF 110 BCA Analyzer (Bruker Corp., The Woodlands, TX), which uses whole-body magnetic resonance relaxometry in non-anesthetized rodents, was used to measure the body composition with linearity and reproducibility [16]. All food intake was reported in kcal and was broken down into kcals from fat and sugar based upon the composition of each diet. The food intake was measured daily. Preweighed food (~50g) was provided in standard stainless steel hoppers. After 24 h, rats were briefly removed from their cages and weighed, and the amount of food remaining, including any on the bottom of the cages or bedding crumbs, was recorded. Intake was calculated as the weight (in grams) of food provided minus that recovered. The total fat gain on each diet was calculated by subtracting body fat (g) at baseline from body fat (g) at study end. Total kcal consumed divided by total body fat (g) gained provided the kcal needed to gain 1g of body fat while on each diet. Similarly, total fat or sugar kcal consumed was divided by total body fat gained to determine fat kcal or sugar kcal needed to gain 1g of body fat.
2.3 Microbiota Analysis
Fecal samples were collected at baseline, 1 d, 6 d and 27 d after the dietary switch. Bacterial DNA was extracted from feces using a commercial kit and following the recommendation of the manufacturer (Zymo Research, Irvine, CA). Briefly, fecal contents were lysed by bead beating and DNA was isolated using fast-spin columns. DNA was filtered to remove humic acids and polyphenols and the eluted DNA was sent to SeqMatic (Fremont, CA) for sequencing. A library was generated by targeting the 16S V4 region. Sequencing was performed via Illumina MiSeq and sequences aligned to reference genomes. Diversity was determined using the Shannon-Weiner index. Abundances were normalized by log transformation and METAGENAssit platform [17] was used for phylogenic quantification and principal component analysis [17]. To identify discriminant taxa between groups, linear discriminant analysis was conducted using the Galaxy platform [18, 19].
2.4 Tissue fixation and sectioning
Immediately following euthanasia, the cecum and part of the liver were sampled. Rats were then transcardially perfused with 0.1 M phosphate-buffered saline (PBS; pH 7.4) followed by 4% paraformaldehyde (over 20 minutes). Hindbrains and nodose ganglia were harvested, post-fixed in 4% paraformaldehyde for 2 hours, and immersed overnight in 18% sucrose in PBS and 0.1% NaN3 (Sigma-Aldrich; pH 7.4). Hindbrains were sectioned at 20 μm throughout the caudal to the rostral extent of the NTS (between bregma −14.16 and −12.93 mm) and stained for selected antigens. Nodose ganglia were sectioned at 15 μm and stained for selected antigens.
2.5 Immunofluorescence
Primary and secondary antibodies used in the study are listed in Table 2. After blocking in 10% normal horse serum in Tris-phosphate buffered saline (TPBS, pH 7.4) sections were incubated overnight with a primary antibody against ionized calcium binding adaptor molecule 1 (Iba1) followed by an Alexa-488 secondary antibody (Invitrogen, CA) to visualize microglia activation as previously described [20]. The hindbrain sections were incubated with isolectin B4 biotin-conjugated (IB4) for 12 h at room temperature to visualize primary unmyelinated vagal afferents innervating the GI tract as previously described [21], followed by ExtrAvidin-CY3 (1:600, E-4142, Sigma-Aldrich) for 2 h. Negative controls were performed by omission of primary antibodies. Sections were mounted in ProLong (Molecular Probes, OR) and examined under Nikon 80-I fluorescent microscope as previously described [20, 22].
Table 2.
Sources and concentrations of primary and secondary antibodies used in this study for immunoblotting or immunofluorescence
| Primary antibody target | Source | Catalog no. (Host) | Application (dilution) | Secondary antibody |
|---|---|---|---|---|
| Biotinylated GSL I – isolectin B4 | Novus Biologicals (Littleton, CO) | B-1205 (NA) | IF or IB (1:100) | IF:ExtrAvidin®−Cy3 (Sigma-Aldrich, St. Louis, MO; Catalogue no. E4142)(1:400) IB: IRDye 680LT Streptavidin (LI-COR Biosciences, Lincoln, NE; Catalogue no. 925-68031)(1:5000) |
| Occludin | Santa Cruz Biotechnology, Inc. (Dallas, Texas) | Sc-5562 (Rabbit) | IB (1:200) | IB: IRDye 800CW Goat anti-rabbit (LI-COR Biosciences, Lincoln, NE; Catalogue no. 925-32211)(1:5000) |
| NF-κB p65 | Cell Signaling Technology, Inc (Danvers, MA) | 8242 (Rabbit) | IB (1:1000) | IB: IRDye 800CW Goat anti-rabbit (LI-COR Biosciences, Lincoln, NE; Catalogue no. 925-32211)(1:5000) |
| Phospho- NF-κB | Cell Signaling Technology, Inc (Danvers, MA) | 3033 (Rabbit) | IB (1:1000) | IB: IRDye 800CW Goat anti-rabbit (LI-COR Biosciences, Lincoln, NE; Catalogue no. 925-32211)(1:5000) |
| Histone H3 | Cell Signaling Technology, Inc (Danvers, MA) | 4499 (Rabbit) | IB (1:1000) | IB: IRDye 800CW Goat anti-rabbit (LI-COR Biosciences, Lincoln, NE; Catalogue no. 925-32211)(1:5000) |
| β-Actin | Sigma-Aldrich (St. Louis, MO) | A1978 (Mouse) | IB (1:10,000) | IB: IRDye 680 Goat anti-mouse (LI-COR Biosciences, Lincoln, NE; Catalogue no. 925-68070)(1:5000) |
| Beta III Tubulin | Abcam (Cambridge, MA) | ab18207 (Rabbit) | IB (1:1000) | IF: Donkey anti-Rabbit IgG (H+L) Secondary Antibody, Alexa Fluor® 488 conjugate (Invitrogen, Carlsbad, CA Catalogue no. A-21206)(1:400) IB: IRDye 800CW Goat anti-rabbit (LI-COR Biosciences, Lincoln, NE; Catalogue no. 925-32211)(1:5000) |
| Iba1 | Wako Chemicals USA, Inc. (Richmond, VA) | 019-19741 (Rabbit) | IF (1:1000) | Donkey anti-Rabbit IgG (H+L) Secondary Antibody, Alexa Fluor® 488 conjugate (Invitrogen, Carlsbad, CA Catalogue no. A-21206)(1:400) |
Abbreviation: Immunofluorescence-IF; and immunoblotting-IB.
2.6 Immunofluorescence quantification
Images of the NG and dorsal vagal complex were captured under 20× magnification with a Nikon 80i imaging photomicroscope (Nikon, Tokyo, Japan) equipped with a digital camera (Nikon Digital Sight DS-Qi1Mc), and appropriate filters for DAPI, Alexa 488, and ExtrAvidin-CY3. Stitched large images were produced for NG and dorsal vagal complex for the analysis. Images were analyzed with the Nikon Elements AR 3.0 Imaging software (Nikon, Tokyo, Japan).
The number of positive-stained profiles for a particular antigen (Iba1 and IB4) was quantified as described in our previous studies [22], using binary imaging analysis based on principles described by Hunter et al. [23]. Briefly, a binary threshold was set at the mean intensity plus standard deviations to separate positively labeled fibers or cells from the background. The area of positively labeled fibers or cells above the binary threshold was recorded for each section. For each animal, the analyzed sections were binned by calculating the average area across three serial sections. The reported values represent the group mean of these binned values. For the preparation of the microscopic illustrations, Adobe (San Jose, CA) Photoshop CS5 was used to adjust only the brightness, contrast, and sharpness and to make composite plates.
2.7 LPS measurement
Blood was collected intracardially with a sterile syringe during the euthanasia process and allowed to clot for 30 min on ice. Serum was then collected following centrifugation at 1,000× g for 10 minutes at 4°C. LPS was measured in serum and cecal content (homogenized in PBS) as previously described [12]. Briefly, LPS was quantified using a Pyrochrome Lysate Mix, a quantitative chromogenic reagent, diluted in Glucashield buffer which inhibits cross-reactivity with (1 → 3)- β-D-Glucans (Associate of Cape Cod, East Falmouth, MA, USA). Samples were diluted 1:10 in pyrogen-free water (Associate of Cape Cod) and heated for 10 min at 70°C. Samples and reactive solution were incubated at 37°C for 15 min (for cecum) 30 min (for serum) and absorbance was read at 405 nm.
2.8 Western blot analysis
Binding of IB4 and expression of occludin, NF-kB p65, histone H3 and beta-3-tubulin was analyzed by western blotting. Primary and secondary antibodies used in the study are listed in Table 2. Fresh cecal tissues were washed in PBS and homogenized on ice for 30 min in RIPA buffer [0.5M Tris-HCl, pH 7.4, 1.5M NaCl, 2.5% deoxycholic acid, 10% NP-40, 10 mM EDTA, supplemented with 1 mM phenyl methyl sulfonyl fluoride and protease inhibitor mixture (EMD Millipore, Billerica, Massachusetts)]. After centrifugation at 12,000 rpm for 15 min, the supernatant was harvested. Nuclear and cytosolic subcellular fractions were prepared using a Nuclear/Cytosol Fractionation kit (BioVision, Mountain View, CA) according to the manufacturer’s protocol. The protein concentration was determined using a Pierce™ Coomassie Plus (Bradford) Assay Kit (Thermo Fisher scientific, Grand Island, NY). Equal amounts of protein (50 to 75 μg each) were mixed with 4X Bolt® LDS Sample Buffer and sample reducing agent (Invitrogen, Carlsbad, CA), run on 4–12% NuPAGE, and electroblotted onto Nitrocellulose membrane (iBlot® 2 Dry Blotting System, Invitrogen, Carlsbad, CA). For subcellular fractions, 40 μg of each of the extracts were subjected to electrophoresis on a polyacrylamide gel followed by immunoblotting using appropriate antibodies. The membrane was blocked with PBS supplemented with 0.1% Tween 20 and 5% nonfat milk or 5% BSA for 1 h at room temperature, and probed with primary antibody (Table 2) overnight at 4°C followed by appropriate fluorescent secondary antibodies (IR Dye800 or IR Dye680; LI-COR Biosciences, Lincoln, NE) for 1 h at room temperature. β-actin and Histone H3 were used as loading controls for the cytoplasmic and nuclear fractions respectively. Immunoblots were visualized using the LI-COR Odyssey CLx. Quantification was done using Image Studio (LI-COR Biosciences); lanes were defined and bands were automatically identified. The profile feature was used to identify band boundaries and lane background was subtracted. Optimization of images for publication was performed by adjusting the brightness and contrast in Image Studio (LI-COR Biosciences).
2.9 RNA extraction and Real-Time RT-PCR analysis
Total RNA from fresh cecum samples was isolated using RNeasy Kit (Qiagen, Germantown, MD) according to manufacturer’s instructions. First-strand cDNA was synthesized from 2 μg of total RNA using qScript™ cDNA SuperMix kit (Quanta Biosciences, Gaithersburg, MD). Amplifications were performed on Step one plus real-time PCR system (Applied Biosystems, Austin, TX) (95°C for 10 minutes, followed by 40 cycles of 95°C for 15 seconds, 55°C for 40 seconds and 62°C for 60 seconds) using SYBR Green-based PCR master mix (Applied Biosystems). Gene expression was determined using the ΔΔCt method with 18S as the housekeeping gene [24]. Primers for tumor necrosis factor alpha (TNFα), interleukin-6 (IL-6) and interleukin-1-beta (IL-1β) were ordered from Real Time Primers (Elkins Park, PA) and TNFα F:CCCATTACTCTGACCCCTTT, R: TGAGCATCGTAGTTGTTGGA; IL-1β F:AGAGTGTGGATCCCAAACAA, R: AGTCAACTATGTCCCGACCA; IL-6 F:CTTCCTACCCCAACTTCCAA, R:ACCACAGTGAGGAATGTCCA; and 18S F:CGTCTGCCCTATCAACTTTC, R: GATGTGGTAGCCGTTTCTC.
2.10 Statistical analysis
GraphPad Prism 7.0 software (GraphPad, La Jolla, CA) was used for statistical analysis and to plot the data unless noted otherwise. The 5% (P<0.05) significance level was adopted. Variables from the three groups (LF/LSD, LF/HSD, and HF/HSD) were compared using analysis of variance (ANOVA) and multiple comparisons were performed using the Tukey-Kramer post-hoc test (P<0.05) unless noted otherwise. Repeated measures two-way ANOVA tests were used to assess the differences between groups over time for body weight gain, body fat, and lean mass, considering treatment and time as repeated factors. The post-hoc Tukey–Kramer test was used when significance was detected by multiple comparisons. Data for energy intake, LPS analysis, immunoblotting, and immunofluorescence quantification were analyzed using one-way ANOVA followed by Tukey-Kramer post-tests for comparisons between HF/HSD, LF/HSD, and LF/LSD control. Each graph depicts the mean ± standard error of the mean [10].
3. RESULTS AND DISCUSSION
3.1. Consumption of diets rich in sugars can promote obesity
We determined the animals’ body weight, body fat mass, and lean mass at baseline and throughout the four-week feeding study. As expected, there were no significant differences in body weight and body composition between groups at baseline (Figure 1A). However, body weights of the LF/HSD and HF/HSD fed rats were significantly increased after 4 weeks on their respective diets when compared to the LF/LSD control rats (Figure 1A). The HF/HSD fed animals weighed significantly more than the LF/LSD after only one week on their diet (LF/LSD: 332.12±3.8g and HF/HSD: 355.94±7.4g), while, the LF/HSD fed became significantly heavier than the LF/LSD-fed rats after week 3 of their diet (LF/LSD: 351.36±6.4g and LF/HSD: 373.15±6.2g). At the end of the experiment, HF/HSD fed rats were significantly heavier than both LF fed groups (LF/LSD: 361.7±7g, LF/HSD: 379.2±7.3g and HF/HSD: 402.4±8.1g).
Figure 1. HSD consumption increases body fat content.
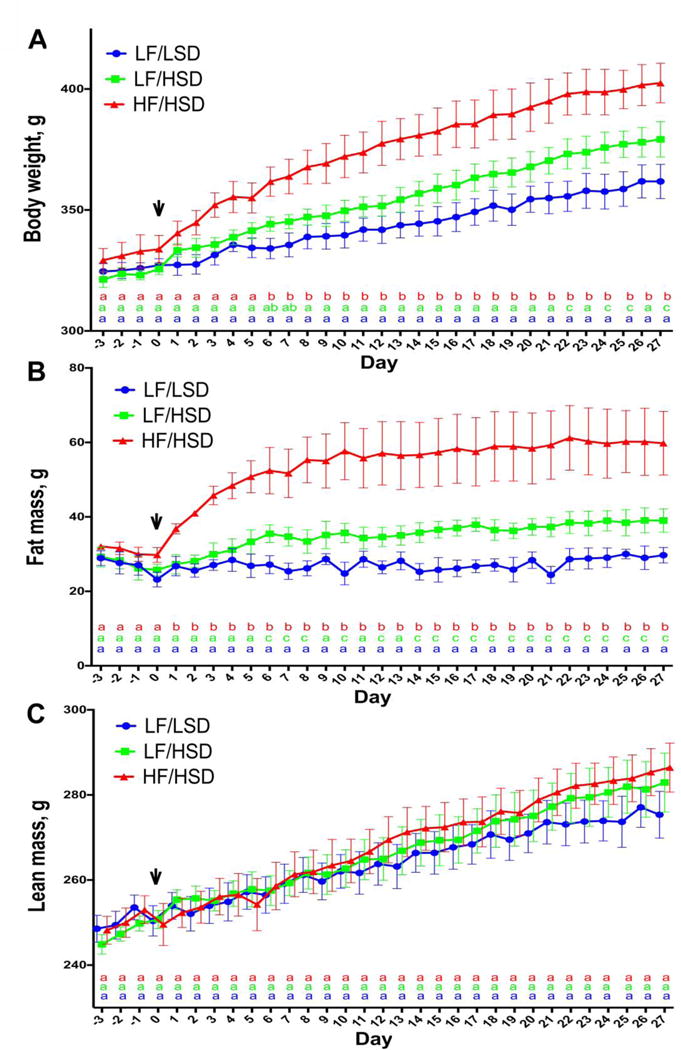
A–C. Daily changes in body weight (A), body fat (B) lean mass (C) of rats fed with regular diet (LF/LSD in blue), low-fat diet (LF/HSD in green) or high-fat diet (HF/HSD in red) for four weeks (n=4) shows that both HF/HSD and LF/HSD can significantly increase both body weight and body fat gains, compared to control LF/LSD. HF/HSD showed a significant increase in body weight and body fat within one week of diet introduction compared to control diet. Compared to LF/LSD, LF/HSD fed rats had significant increases in body fat after one week on their diet and significant increases in body weight appeared after three weeks. Significant differences in body fat between HF/HSD and LF/HSD appeared after one week on experimental diets while significant differences in body weight did not appear until after the second week between these two groups. Despite differences in body weight and body fat, lean mass did not differ between the three diet groups at any time during the 4 week study. The vertical arrow after 3 days (day 0 on the graph) represents the point at which the LF/HSD or HF/HSD was introduced in two groups of rats. The third group was maintained on the same control LF/LSD throughout the experiment. Statistical significance was analyzed by repeated measures two-way ANOVA with Tukey-Kramer post-test between the groups. a,b,cMean values for week 4 with unlike letters (at the bottom of the graph with LF/LSD in blue, LF/HSD in green and HF/HSD in red) were significantly different (P≤ 0.05).
The increase in body weight was due to an increase in adiposity. The growth and development of the rats was found to be unaffected by the diets as the body length and tail growth were unaltered between the groups in four weeks (data not shown). Total body fat mass significantly increased with both high sugar diets with no significant differences in lean body mass (Figure 1B and 1C). HF/HSD fed rats displayed a significant increase in body fat mass within a day of diet introduction when compared to both LF fed groups. LF/HSD fed rats showed a significant increase in body fat mass a week following diet introduction when compared to the LF/LSD control rats. (Figure 1B). Overall, body fat mass was greater in LF/HSD than LF/LSD (LF/HSD: 39±3.1 g and LF/LSD: 29.7±2 g) and greater in HF/HSD than both LF fed groups (HF/HSD: 59.8±8.5 g) (Figure 1B).
Sprague-Dawley rats have previously been reported to display different phenotypes (obesity-prone and obesity-resistant) when fed a high-fat diet [25]. In this particular cohort, only one animal was somewhat resistant to diet-induced obesity. It should be noted that LF/LSD has not systematically been used as control diets and previous studies have used LF/HSD for control. In this study, all animals were included in the HF/HSD group and were all significantly heavier than the LF/LSD.
Interestingly, consumption of both the LF/HSD and HF/HSD led to a significant increase in body fat and body weight compared to the LF/LSD leading us to conclude that diets rich in sugars can promote obesity. The combination of HF and HS exacerbated the obese phenotype, however, because we did not include an HF/LSD group, we do not know if these effects are additive or synergistic.
3.2. HSD promote liver fat infiltration
Increased fat infiltration in the liver is a risk factor for metabolic abnormalities [26]. Because of its anatomical location, blood supply, immunological repertoire, and multiple metabolic roles, the liver is continually exposed to gut-derived factors (including microbes, microbial components, and products of microbe-gut interactions) that traverse the gut barrier and gain access to the bloodstream. Recent studies have shown that a leaky gut can contribute to the onset and progression of liver diseases such as non-alcoholic fatty liver disease (NAFLD) [27].
In this study, we found that liver fat was significantly increased in the LF/HSD group compared to LF/LSD-fed rats (LF/LSD: 12.05 ± 1.317g, LF/HSD: 19.575 ± 2.013 g; p<0.05 by one-way ANOVA with post-hoc Tukey–Kramer test). We did not find statistically significant changes in liver fat accumulation between LF/LSD and HF/HSD or LF/HSD and HF/HSD-fed rats (LF/LSD: 12.05 ± 1.317g, LF/HSD: 19.575 ± 2.013 g and HF/HSD: 13.8 ± 2.539 g).
We speculated that the extent of liver fat accumulation might correlate with abundance and overgrowth of specific groups of bacteria. It is possible that bacteria and/or bacterial metabolites affect the regulation of energy metabolism by controlling the transcription of metabolic mediators (e.g., PPARγ, Fiaf) or other enzymes involved in de novo fatty acid synthesis [10]. This hypothesis is supported by the previous finding that a low-fat, high-carbohydrate diet promotes the development of a fatty liver through de novo fatty acid synthesis [28, 29].
3.3. HSDs alter energy efficiency and promote body fat accumulation
The introduction of HF/HSD led to a significant increase in energy intake during the first week of exposure when compared to the LF/HSD and LF/LSD control group. By week 2, intake was normalized and there were no significance differences between the LF/LSD and HF/HSD throughout the rest of the experiment. Conversely, starting at week 2, rats fed the LF/HSD consumed significantly less kcal than the LF/LSD control group and the HF/HSD fed animals. Difference between the LF/HSD and HF/HSD did not reach significance at week 4 (Figure 2A).
Figure 2. HSD consumption impacts energy efficiency.
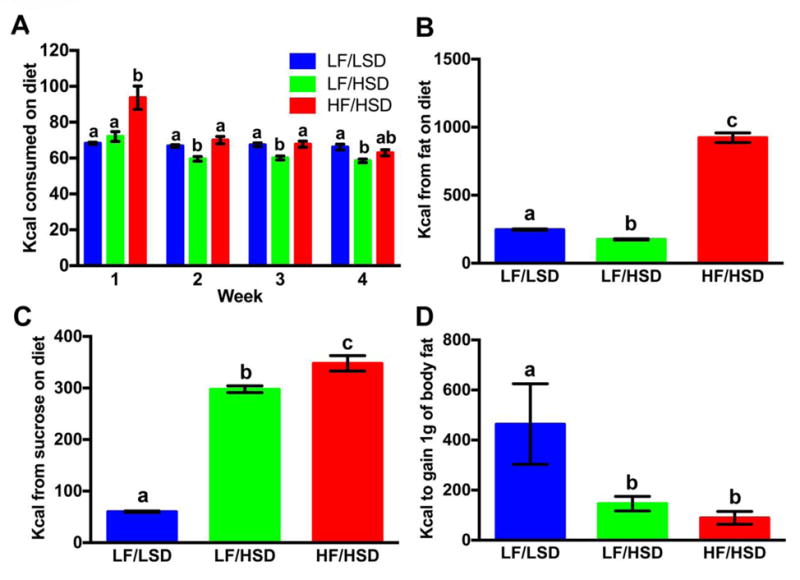
Average weekly Kcal per day consumed on diets (A), average Kcal intake from fat (B), average Kcal intake from sugar (C) and average Kcal to gain 1 g of fat (D) was plotted (as mean ± SEM, n=4) with each group of rats fed either LF/LSD, LF/HSD or HF/HSD for 4 weeks. Summary results in bar graph show that, although the average weekly Kcal consumption between LF/LSD and HF/HSD were significantly different during the first week of diet changes, there was no significant difference after the second week of diet changes (Figure 2A). At the same time, although the average weekly Kcal consumption between LF/LSD and LF/HSD were not significantly different during the first week of diet changes, there was a significant difference after the second week of diet changes (Figure 2A). However, the average weekly Kcal consumption between LF/HSD and HF/HSD were significantly different from the very first week of diet changes (Figure 2A). Similarly, the average Kcal intake from fat (B) was significantly higher in HF/HSD (P≤0.0001 compared to LF/LSD and LF/HSD), and the average Kcal intake from sugar (C) was significantly higher (P≤0.05) in both HF/HSD and LF/HSD. However, average calories to gain 1 g of fat (D) was significantly lesser in both HF/HSD and LF/HSD compared to control LF/LSD (P≤0.05). Statistical significance was analyzed by one-way ANOVA with Tukey-Kramer post-test between the groups. a,b,cMean values at week 4 with unlike letters were significantly different.
The LF/HSD rats had increased body fat accumulation (Figure 1B) when compared to the LF/LSD rat while consuming fewer calories (Figure 2A). HF/HSD fed rats consumed significantly more calories from fat than the two LF fed groups. Conversely, LF/HSD rats consumed significantly fewer calories from fat than the LF/LSD fed animals (Figure 2B). Both LF/HSD and HF/HSD fed animals consumed significantly more calories from sugars than the LF/LSD control group (Figure 2C). Energy efficiency (the amount of energy needed to gain 1 gram of body fat) was dramatically altered by high sugar diets. Both LF/HSD and HF/HSD rats were required to consume significantly fewer calories to gain a gram of body fat than the LF/LSD animals (Figure 2D) suggesting that, despite providing less fat, the LF/HSD diet modified body fat metabolism and storage similarly to the energy dense HF/HSD resulting in an increase in adiposity [30]. HSD may also be downregulating energy expenditure [31], however, we did not measure it in this study.
We concluded that diet composition plays a critical role in regulating fat storage and diets rich in sugars may promote adiposity. However, the observed increased body fat accumulation cannot be attributed solely to just the sugar content because of some fiber and microelements differences between the control (LF/LSD) and high-sugar diets used in the study.
3.4. HSD consumption significantly alters gut microbial ecology
Diet-induced obesity is associated with marked changes in the microbiota composition, and there is evidence that microbiota composition can regulate body fat accumulation; colonization of GF mice with the microbiota from a diet-induced obese animal notably leads to a significant increase in body fat [32, 33]. Previous studies have shown that diet-induced dysbiosis and associated impairment in gut function are especially marked in the distal gut, including the colon and cecum [34, 35]. In the present study, we focused on fecal microbiota composition.
We characterized the microbiota composition at baseline, 24hrs (day 1), 6 days (week 1) and 26 days (week 4) post-diets introduction. The rarefaction curve for this analysis indicates >120,000 sequences and >1,000 operational taxonomic units (OTUs) per sample on average (Supplementary Figure S1). Principal component analysis (PCA) using all phylogenic levels was used to characterized the microbiota profile (Figure 3A). At baseline (B) and day 1 (D1), all animals clustered together. LF/LSD rats at week 1 (W1) and week 4 (W4) still clustered with their baseline profiles, while LF/HSD and HF/HSD clustered together. These results are further confirmed by heatmap analysis with dendrogram (Supplementary Figure S2). Diets rich in sugars, regardless of fat contents, induced rapid microbiota dysbiosis.
Figure 3. Sugar-rich diets led to a significant loss in species diversity.
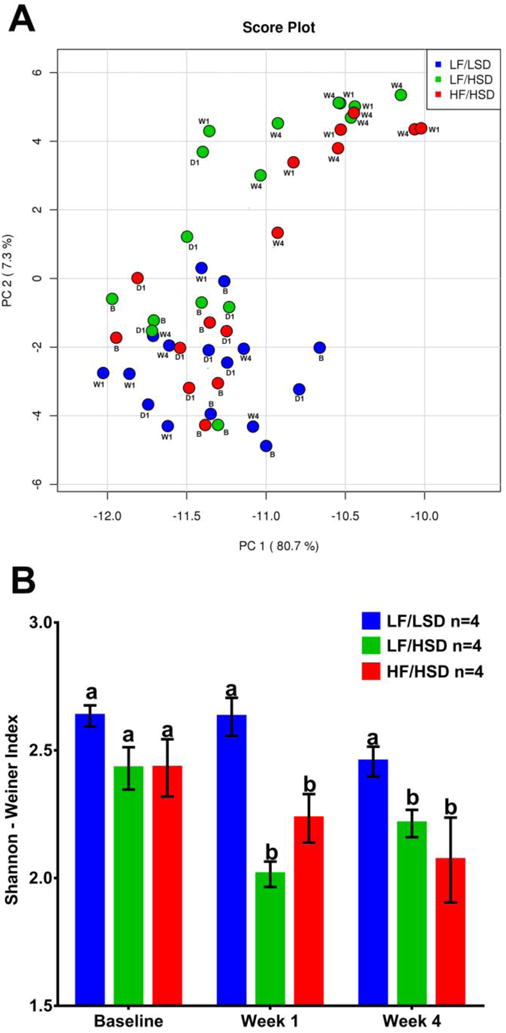
A. Principal Coordinate Analysis showing microbiota from all time points combined. Colors designate diet groups: Blue: LF/LSD; Green: LF/HSD; Red: HF/HSD. Time points are designated as B: baseline; W1: week 1; W4: week 4. Microbiota of all rats clustered together at baseline and day 1. Over the course of the study, LF/LSD microbiota remained with the baseline grouping; however, LF/HSD and HF/HSD fed rats’ microbiota grouped away from their baseline compositions. A heatmap and dendrogram (Supplementary Figure S2) further confirm this result. B. Shannon-Weiner Index shown as mean ± SEM for each group and time point. Bars with the same letters are not significantly different from one another (P>0.05) using repeated measures two-way ANOVA and Tukey–Kramer post-hoc test. Colors designate diet groups: Blue: LF/LSD; Green: LF/HSD; Red: HF/HSD. Baseline (Day -3) refers to 3 days before the beginning of experimental diets. Week 1 is after one week on experimental diets and Week 4 is after four weeks on experimental diets. All diet groups had similar species diversity at baseline. During the study period, both of the sugar-rich diets (LF/HSD and HF/HSD) led to a significant loss in species diversity.
A loss of microbial diversity is the most common presentation of intestinal dysbiosis and has been associated with many disease states including obesity [36, 37]. In the present study, we calculated the Shannon-Weiner index which takes into account richness (number of species) and evenness (abundances distribution). Consumption of a diet rich in sugar, regardless of fat contents, led to a significant decrease in microbial diversity within a week of diet introduction. This significantly reduced microbial diversity was maintained in both HF/HSD and LF/HSD groups through the end of the experiment (Figure 3B). Microbiota composition was not significantly different at week 1 and week 4. The detailed week 4 composition is shown in Figure 4.
Figure 4. HSD intake alters gut microbial ecology that promotes host adiposity.
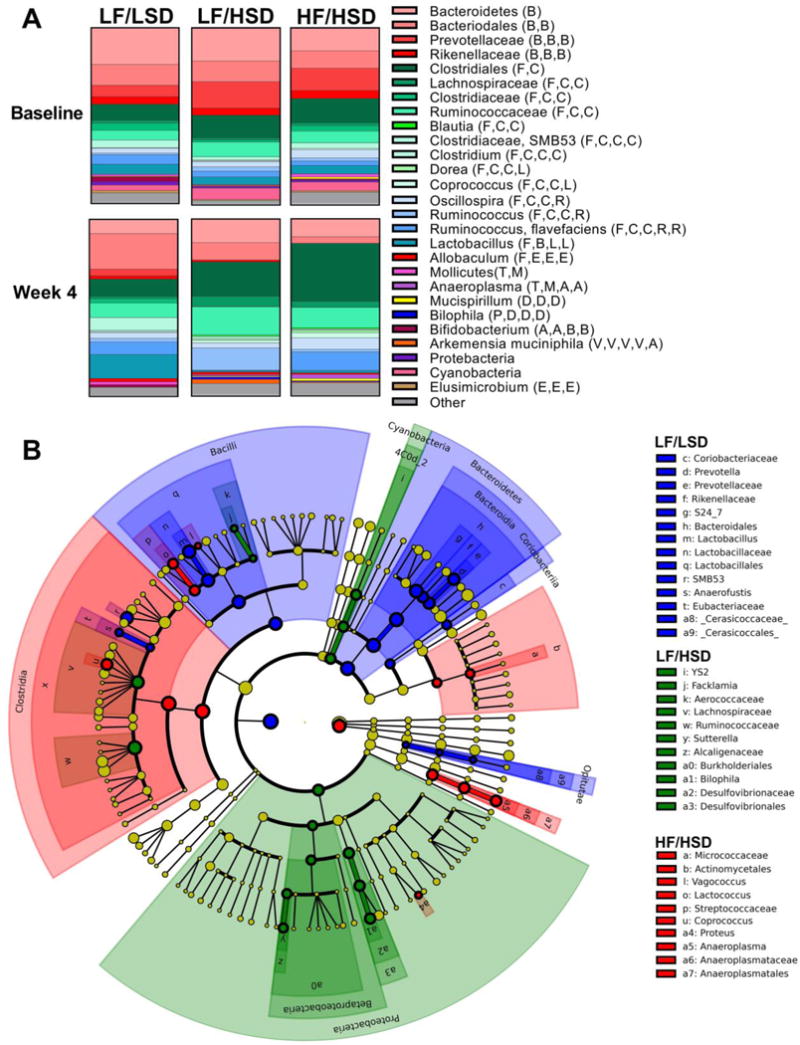
A. Microbiota composition of animals fed LF/LSD, LF/HSD, HF/HSD. All phylogenic levels present with abundance >1% are represented (See Supplementary Figures S3 and S4 to see this representation broken down by phylogenic levels and significance). Phyla: B: Bacteroidetes, F: Firmicutes, T: Tenericutes, D: Deferribacteres, P: Proteobacteria, A: Actinobacteria, V: Verrucomicrobia, E: Elusimicrobia. Class: B: Bacilli, C: Clostridia, E: Erysipelotrichia; M: Mollicutes, D: Deferribacteres, D: Deltaproteobacteria, A: Actinobacteria, V: Verrucomicrobiae, E: Elusimicrobia. Order: B: Bacteroidia, C: Clostridiales, L: Lactobacillales, E: Erysipelotrichiales, A: Anaeroplasmatales, D: Deferribacteriales, D: Desulfovibrionales, B: Bifidobacteriales, V: Verrucomicrobiales, E: Elusomicrobiales. Family: C: Clostridiaceae, L: Lachnospiraceae, R: Ruminococcaceae, L: Lactobacillaceae, E: Erysipelotrichaceae, A: Anaeroplasmataceae, D: Desulfovibrionaceae, B: Bifidobacteriaceae, V: Verrucomicrobiaceae. Overall, consumption of HSD, regardless of fat content, led to increases in members of the Firmicutes and decreases in Bacteroidetes. However, Lactobacillus, a Firmicutes of the Bacilli class, decreased significantly on HSD. The Ruminococcaceae and Lachnospiraceae families of the Firmicutes class Clostridia significantly increased on the HSD. Micrococcaceae, genera of Actinobacteria, increased on HSD and more so on HF/HSD. LF/HSD specifically increased the Sutterella and Bilophila genera of Proteobacteria.
B. Cladogram produced from LDA score of 2.5 at Day 26 (See Supplementary Figure S5 for LDA Scores). Colors designate diet groups: Blue: LF/LSD; Green: LF/HSD; Red: HF/HSD. Cladogram reveals that LF/HSD and HF/HSD are characterized by abundant members of the Firmicutes class Clostrida. LF/HSD, in particular, is marked by the abundance of members of Proteobacteria, particularly the genera Sutterella and Bilophila.
Figure 4A displays the fecal microbiota composition of each of the three groups with all phylogenic levels with an abundance >1% represented. Separate phylogenic abundances can be found in the supplementary data (Supplementary Figures S3–S4). At the phylum level, HSD consumption led to a significant increase in Firmicutes abundance and a decrease in Bacteriodetes, these changes being more marked in the HF/HSD group. Diet-induced obesity has previously been reported to be associated with decreased levels of Bacteroidetes and an increase in Firmicutes abundance when compared to lean controls [32, 38]. Despite an overall increase in Firmicutes, HSD consumption led to a significant reduction in Bacilli, particularly Lactobacillus, a known probiotic [39]. Conversely, Clostridia abundance bloomed under the HSD, especially the Ruminococcaceae and Lachnospiraceae families; higher abundances of these two families have been previously reported in obese animals [40–42] and are believed to promote body fat accumulation [43].
HSD-induced dysbiosis was overall more marked in the HF/HSD fed rats, which notably displayed elevated Micrococcaceae, a family of Actinobacteria. Actinobacteria abundance has previously been shown to be regulated by dietary fat [44] and to be elevated in obese individuals [8]. Surprisingly, Micrococcaceae had previously been reported to preferentially colonize the upper gastrointestinal tract [45]. Additionally, HF/HSD led to a specific increase in Anaeroplasmatales abundance; Anaeroplasmatales are an order of Mollicutes bacteria, a class of Tenericutes that has been previously linked to diet-induced obesity and increased fat deposition [32, 33] (Figure 4B and Supplementary Figure S5).
LF/HSD led to a specific increase in Proteobacteria, which was largely mediated by an increase in abundances of genera Sutterella and Bilophila (Figure 4B and Supplementary Figure S5). An increase in Betaprotebacteria abundance has been associated with enhanced liver fat deposition [46]. Specifically, in humans, the family Sutterellaceae has been shown to be associated with short chain fatty acids (SCFAs), including acetate and butyrate [47], which can promote liver lipogenesis [48] while in mice, reduction in Bilophila abundance is associated with a decrease in liver fat infiltration [49].
Interestingly, abundances of Actinobacteria (Class) and Tenericutes were negatively correlated with Betaproteobacteria abundance (Supplementary Figure S6). Since Betaproteobacteria promotes fat deposition in the liver, HF/HSD driven increases in Actinobacteria and Tenericutes may explain the counterintuitive effect of HF consumption on liver fat in this study. Interestingly, a diet rich in medium and long chain saturated fatty acids has previously been shown to counterbalance the effect of ethanol on liver inflammation and fat accumulation [50].
3.5. HSD consumption led to an increase in metabolic endotoxemia
In the present study, we found that HSD consumption, regardless of fat contents led to a significant increase in cecal and circulating LPS levels when compared to control LF/LSD-fed animals (Figure 5A, B). Although there was no significant difference in LPS levels between HF/HSD and LF/HSD, HF/HSD fed animals displayed higher LPS levels in both cecum and serum at the end of the experiment (Figure 5A, B), which may be directly related to the exaggerated dysbiosis observed in these animals.
Figure 5. HSD consumption enhances LPS levels in gut and serum.
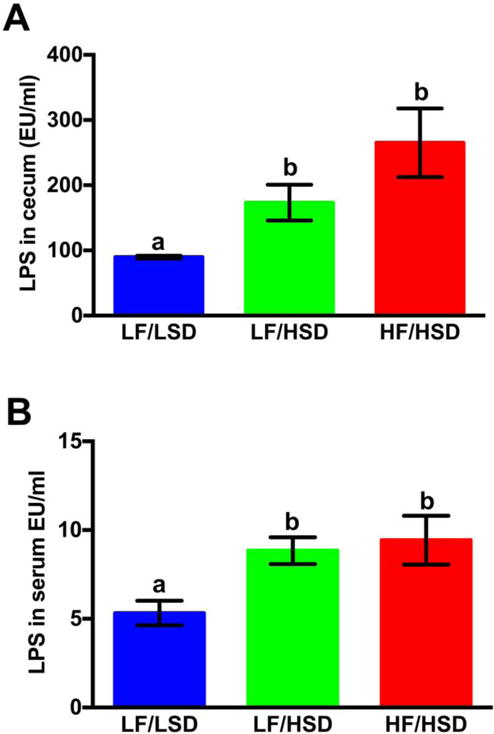
LAL assay was used to measure the cecum (A) and plasma (B) endotoxin concentration in rats fed with LF/LSD, LF/HSD and HF/HSD for four weeks. Summary results are shown in the bar graphs. Values are mean ± SEM, n=4. The one-way ANOVA with a Tukey-Kramer post-hoc correction shows that both HF/HSD and LF/HSD have a significant increase in both cecum and serum LPS levels compared to LF/LSD; a,b,cMean values at week 4 with unlike letters were significantly different. P≤0.05.
The increase in circulating LPS has previously been reported in diet-induced obesity models [11]. Interestingly, in rodents, chronic administration of LPS led to an increase in body fat mass [11, 12] which was not systematically accompanied by an increase in food intake [11] suggesting that LPS can modulate fat metabolism and body fat accumulation.
3.6. Consumption of HSD promotes gut inflammation and impaired gut epithelial function
LPS binding to its receptor (Toll-like receptor-4, TLR4) leads to nuclear translocation of transcription factor NF-κB and upregulation of pro-inflammatory cytokines expressions, such as TNF-α, IL-6 and IL-1β. We have previously shown that diet-induced dysbiosis is associated with an increase in intestinal TLR-4 activation, resulting in gastrointestinal inflammation [38]. Gut inflammation can alter tight junction protein expression and localization, notably occludin [51] resulting in an increase in gut permeability. A leaky gut allows for LPS translocation to the general circulation and promotes systemic inflammation [7].
Consistent with increased LPS levels (Figure 5), nuclear translocation and activation of NF-κB were considerably higher in both LF/HSD, and HF/HSD compared to that of LF/LSD-fed group (Figure 6A). Consumption of HSD, regardless of fat contents, promoted distal gut inflammation compared to the LF/LSD control, as shown by the significant increase in pro-inflammatory cytokines, IL-6, IL-1β and TNFα, expression in cecum tissues (Figure 6B). In accordance with these data, we found that cecal occludin protein levels were greatly reduced in both LF/HSD and HF/HSD-fed rats compared to of LF/LSD-fed rats (Figure 6C, D).
Figure 6. HSD intake modulates inflammation, tight junction integrity and vagal innervation in the gut.
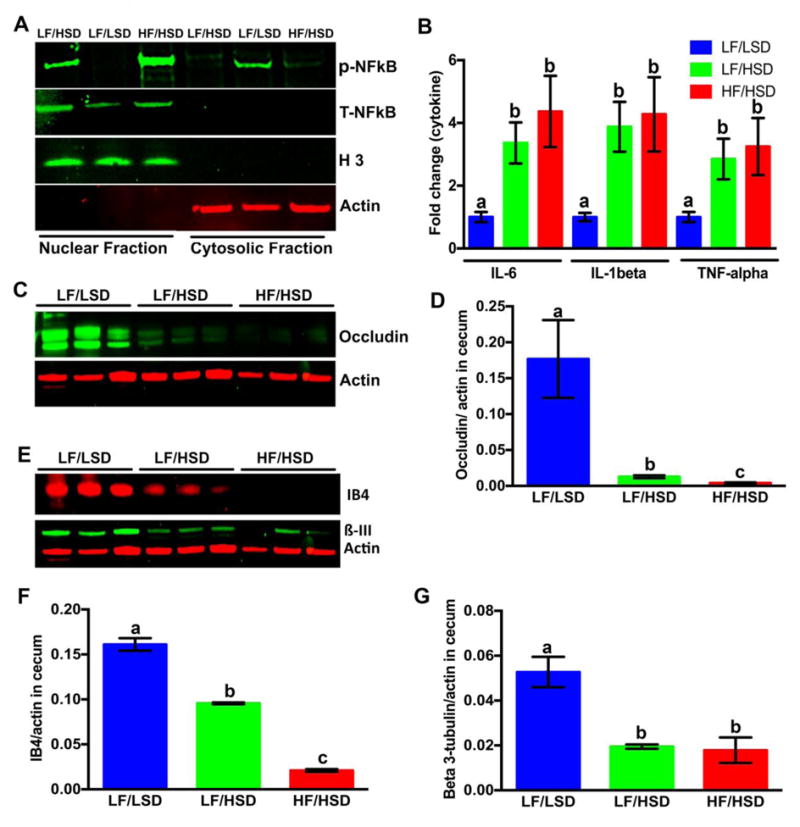
A. Effects of different diet on the nuclear translocation of NF-κB: Immunoblot analysis of isolated nuclear and cytosolic protein fractions from cecum were performed to determine NF-κB (p65) nuclear translocation and activation levels (total and phospho-). Actin and histone 3 were used as internal controls for the cytosolic and nuclear fractions, respectively. The representative figure of three different experiments shows that in both LF/HSD and HF/HSD the NF-κB nuclear translocation and activation was more than LF/LSD.
B. mRNA expression of pro-inflammatory cytokines (IL-6, IL-1β and TNFα) in the cecum of rats fed four weeks with LF/LSD, LF/HSD, or HF/HSD were measured by real-time PCR. The results are indicated as a fold-change expression from the LF/LSD. Summary results are shown in the bar graphs. All values were indicated as the mean ± SEM (n = 4). The one-way ANOVA with a Tukey-Kramer post-hoc correction shows a significant increase in expression of IL-6, IL-1β and TNFα in HF/HSD and LF/HSD compared to that of LF/LSD (P≤0.05); a,b,cMean values at week 4 with unlike letters were significantly different (P≤0.05).
C–D. Immunoblot analysis (C) and quantification of immunoblot (D, the average densitometric analysis as compared with actin) with whole cell lysate from cecum using the occludin antibody show both HF/HSD and LF/HSD have significantly lower expression compared to LF/LSD (P≤0.05 compared to LF/LSD). Actin was used as internal control for the immunoblot analysis. All values were indicated as the mean ± SEM (n = 4). a,b,cMean values at week 4 with unlike letters were significantly different (P≤0.05).
E–G. Immunoblot analysis (E) and quantification of immunoblot (F and G, the average densitometric analysis as compared with actin) with whole cell lysate from cecum were performed using the biotinylated IB4 and ß3-tubulin antibody as described in methods. Actin was used as internal control for the immunoblot analysis. All values were indicated as the mean ± SEM (n = 4). The one-way ANOVA with a Tukey-Kramer post-hoc correction shows that both HF/HSD (P≤0.0001 for IB4; P≤0.001 for β3-tubulin) and LF/HSD (P≤0.001 for IB4 and P≤0.0001 for β3-tubulin) have a significantly lower binding of IB4 and expression of ß3-tubulin protein compared to LF/LSD. a,b,cMean values at week 4 with unlike letters were significantly different (P≤0.05).
We concluded that consumption of a diet rich in sugars, regardless of energy density and fat contents can promote gut inflammation and impair gut permeability. In combination with dysbiosis, impaired gut function can promote metabolic endotoxemia as we have observed in the HSD fed animals.
3.7. Consumption of HSD led to vagal withdrawal and remodeling
We have previously shown that LPS can activate vagal afferent neurons and impair satiety signaling in rodents [12]. Therefore, to investigate the effects of diet-induced microbial dysbiosis on the vagal system, we examined the gut-brain vagal innervation after consumption of HF/HSD, LF/HSD or LF/LSD for four weeks.
We first quantified IB4 binding and β3-tubulin protein expression in cecum samples. β3-tubulin is regarded as a neuron-specific marker [52]. IB4 is a marker of unmyelinated c type fiber neurons and can be used to detect vagal and spinal afferents [53, 54]. We found that both the LF/HSD and HF/HSD led to a significant decrease in IB4 binding and ß3-tubulin protein expression when compared to LF/LSD (Figure 6E, F, and G), suggesting the consumption of HSD can compromise gut innervation. The decrease in IB4 binding was significantly more pronounced in the HF/HSD when compared to the LF/HSD.
Vagal sensitivity to gut-originating signals, including satiety peptides, has been shown to decrease in HF/HSD fed animals [55, 56] and may be related to the loss of gut innervation. In our study, the decrease in innervation was more marked in HF/HSD, which may be related to LPS production as LPS has been shown to promote neurodegeneration [57].
3.8. HSD consumption induces inflammation in the nodose ganglia and withdrawal of sensory fibers from the hindbrain
We have previously found that HF feeding triggers vagal withdrawal from the NTS [58]. Moreover, our previously published studies show that damage to the subdiaphragmatic vagus triggers withdrawal of afferent fibers from the NTS and microglia activation in the NG and Dorsal Vagal Complex. [20, 22]. In the present study, using IB4 immunofluorescence staining, we found that vagal afferent density was decreased in the NTS in LF/HSD and HF/HSD rats, compared to LF/LSD rats (Figure 7A staining). However, differences reached statistical significance in the HF/HSD group only, showing that fats and sugars may both have an independent deleterious effect on vagal innervation (Figure 7A bar graph). Immunostaining against Iba1 revealed that HSD consumption, independently of fat and calorie contents, led to microglia activation in the NG but not in the NTS (Figure 7B and C). Thus, we concluded that loss of gastrointestinal vagal innervation may be responsible for the reorganization of vagal afferents in the NTS through the activation of microglia at NG. Alternatively, microglia activation may be directly related to gut dysbiosis as LPS and pro-inflammatory cytokines have previously been found to induce glial activation [59, 60]. Additionally, LPS has also been shown induce an inflammatory response in vagal afferent neurons in culture [61].
Figure 7. HSD consumption induces inflammation in the nodose ganglia and withdrawal of sensory fibers within the hindbrain.
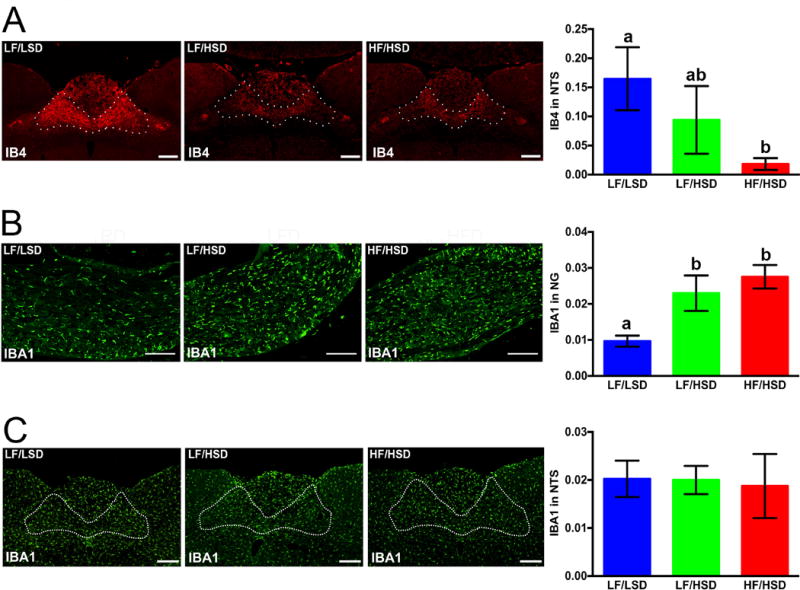
A. Representative coronal sections of the intermediate NTS (outlined) revealing more IB4-immunoreactive fibers in rats fed with LF/LSD compared to LF/HSD or HF/HSD for four weeks. Quantification on the left shows binary analysis of the area of IB4-labeled vagal afferents in the NTS by using Nikon Element’s binary imaging analysis software; n=4 per group. The one-way ANOVA with a Tukey-Kramer post-hoc correction shows a significant decrease in IB4-labeled vagal afferents in HF/HSD compared to that of LF/LSD (P≤0.05). All data are expressed as average ± SEM; a,b,cMean values at week 4 with unlike letters were significantly different. Scale bar = 250μm.
B. Representative sections of the nodose ganglion revealing Iba1-immunoreactive microglia. Quantification on the left shows binary analysis of the area of Iba1-labeled microglia in the nodose ganglion by using Nikon Elements binary imaging analysis software. n=4 per group. The one-way ANOVA with a Tukey-Kramer post-hoc correction shows significant increase Iba1 labeling in both HF/HSD (P≤0.001) and LF/HSD (P≤0.05) compared to that of LF/LSD. Scale bar = 250μm. All data are expressed as average ± SEM; a,b,cMean values at week 4 with unlike letters were significantly different.
C. Representative sections of the NTS revealing Iba1-immunoreactive microglia. Quantification on the left shows binary analysis of the area of Iba1-labeled microglia in the NTS by using Nikon Elements binary imaging analysis software. n=4 per group. Statistical significance was measured by one-way ANOVA with a Tukey-Kramer post-hoc correction. No significant increase Iba1 labeling was found between the groups. All data are expressed as average ± SEM; Scale bar = 250μm.
Similar to vagotomy, it is possible that inflammation-mediated damage to the gastric vagus system may reduce food intake and increase satiety signaling in these animals [62, 63]. Consumption of HF, highly palatable food in rodents has been shown to promote hyperphagia. The food intake in response to such diets can be divided into different phases. First, exposure to high calorie diets leads to immediate overconsumption during the first few days of exposure which is believed to be driven by the rewarding value of the palatable food [64]. Then rats and mice appeared to control their energy intake until the appearance of a hyperphagic phase after 4–8 weeks on the diet [13, 65, 66] which is associated with a decrease in peripheral, including vagal, satiety signaling [61, 66, 67]. We have observed marked changes in the microbiota composition after only 1 week on the LF/HSD and HF/HSD; therefore it is possible that the initial hyperphagia may be a contributing factor in modulating the gut microbiome in the HF/HSD. However as previously described [13, 65, 66] after this first phase, the animals were able to control their energy intake. Changes in microbiota composition have been shown to be very dynamic and detectable as early as 1 to 2 weeks following changes in diet composition [68, 69] with some studies suggesting that a single meal could trigger compositional changes and increase endotoxemia [70, 71]. Therefore, it appears unlikely that the initial hyperphagia would have a lasting influence on the microbiota composition at week 4. If hyperphagia was the main driver of the week 1 changes, one should expect that these alterations would be corrected by week 4, however in our study differences observed at week 1 were exacerbated at week 4. Furthermore, the LF/LSD displayed the same microbiota dysbiosis in the absence of hyperphagia. Therefore, the vagal remodeling we observed in this study seems to happen prior to hyperphagia and may be a necessary step in the development of obesity. Additionally, the vagus innervates most visceral organs bi-directionally and vagal efferent neurons located in the DMV can send motor information from the brain to the gastrointestinal tract [72, 73]. Therefore, it is possible that descending brain-to-gut communication is also compromised by dysbiosis of the gut microbiota impairing vagal efferent output and gut motility [74]. Because gut motility affects microbiota composition, alteration in vagal efferent output may play a role and/or worsen diet-driven dysbiosis. Remodeling of the vagal pathway may be directly related to the observed increase in fat storage. Earlier studies demonstrated that vagal pathways innervating the gastrointestinal tract, pancreas, and liver are involved in the control of assimilation, storage, mobilization, conversion, and oxidation of macronutrients [75, 76]. Lactobacillus has been hypothesized to modulate fat metabolism via a vagal-dependent pathway [77] and vagal ablation abolished -ornithine positive effects on lipid metabolism [78]. PPARγ signaling in NG has notably been hypothesized to regulate diet-driven thermogenesis [79].
Collectively, our study indicates that consumption of HSD, regardless of fat contents, induces microbiota dysbiosis, induces gut inflammation and alters vagal gut-brain communication. These changes are associated with an increase in body fat mass, independently of hyperphagia. Further studies are warranted to understand the precise mechanisms by which this chronic inflammation and altered gut-brain vagal pathway may lead to obesity.
4. CONCLUSION
Summarizing the present data and considering our previous observations, we propose that ingestion of an HSD leads to changes in gut microbiota, which, possibly via an increase in LPS and inflammatory cytokines leads to withdrawal of vagal innervation in the gut and hindbrain. Dysbiosis-driven gastrointestinal inflammation could lead to an increase in gut permeability allowing passage of LPS and other pro-inflammatory signals from the lumen to the lamina propria. These pro-inflammatory products could trigger an inflammatory response in different tissues including microglia activation in the NG leading to vagal remodeling. We showed that increases in body fat mass are consistently correlated with microbiota shifts and altered gut-brain communication, however, the exact pathways remain unknown. Additionally, due to the presence of specific members of the microbial community (such as the bacterial family Sutterellaceae), HSD consumption may be a risk factor for non-alcoholic fatty liver disease (NAFLD).
Research Highlights.
High sugar diets induce gut microbiota dysbiosis.
High sugar diets induce gut inflammation.
High sugar diets trigger remodeling of gut-brain axis.
High sugar diets lead to an increase in body fat mass.
Acknowledgments
This research is supported by grant 5R01DC013904 from the National Institute of Health. The authors thank Brent Joseph Gawey, Mariam Ahmed, Jeremy Alan Long, and Rebecca Kirkland for their valuable time and useful contribution to complete this manuscript.
Abbreviations
- NTS
nucleus of the solitary tract
- NG
nodose ganglion
- HF/HSD
high-fat/high sugar diet
- LF/HSD
low-fat/high sugar diet
- LF/LSD
low fat/low sugar control diet
- PCR
polymerase chain reaction
- cDNA
complementary DNA
- mRNA
messenger RNA
- qPCR
quantitative PCR
- PPARγ
Peroxisome proliferator-activated receptor gamma
Footnotes
Publisher's Disclaimer: This is a PDF file of an unedited manuscript that has been accepted for publication. As a service to our customers we are providing this early version of the manuscript. The manuscript will undergo copyediting, typesetting, and review of the resulting proof before it is published in its final citable form. Please note that during the production process errors may be discovered which could affect the content, and all legal disclaimers that apply to the journal pertain.
Conflict of Interest Statement
All authors declare that there are no conflicts of interest.
References
- 1.Finkelstein EA, Trogdon JG, Cohen JW, Dietz W. Annual medical spending attributable to obesity: payer-and service-specific estimates. Health Aff (Millwood) 2009;28:w822–31. doi: 10.1377/hlthaff.28.5.w822. [DOI] [PubMed] [Google Scholar]
- 2.Golay A, Bobbioni E. The role of dietary fat in obesity. Int J Obes Relat Metab Disord. 1997;21(Suppl 3):S2–11. [PubMed] [Google Scholar]
- 3.Melanson EL, Astrup A, Donahoo WT. The relationship between dietary fat and fatty acid intake and body weight, diabetes, and the metabolic syndrome. Ann Nutr Metab. 2009;55:229–43. doi: 10.1159/000229004. [DOI] [PubMed] [Google Scholar]
- 4.Howard BV, Manson JE, Stefanick ML, Beresford SA, Frank G, Jones B, et al. Low-fat dietary pattern and weight change over 7 years: the Women’s Health Initiative Dietary Modification Trial. JAMA. 2006;295:39–49. doi: 10.1001/jama.295.1.39. [DOI] [PubMed] [Google Scholar]
- 5.Rolls BJ, Miller DL. Is the low-fat message giving people a license to eat more? J Am Coll Nutr. 1997;16:535–43. [PubMed] [Google Scholar]
- 6.DiNicolantonio JJ, Berger A. Added sugars drive nutrient and energy deficit in obesity: a new paradigm. Open Heart. 2016;3:e000469. doi: 10.1136/openhrt-2016-000469. [DOI] [PMC free article] [PubMed] [Google Scholar]
- 7.Cani PD, Bibiloni R, Knauf C, Waget A, Neyrinck AM, Delzenne NM, et al. Changes in gut microbiota control metabolic endotoxemia-induced inflammation in high-fat diet-induced obesity and diabetes in mice. Diabetes. 2008;57:1470–81. doi: 10.2337/db07-1403. [DOI] [PubMed] [Google Scholar]
- 8.Turnbaugh PJ, Ley RE, Mahowald MA, Magrini V, Mardis ER, Gordon JI. An obesity-associated gut microbiome with increased capacity for energy harvest. Nature. 2006;444:1024–31. doi: 10.1038/nature05414. [DOI] [PubMed] [Google Scholar]
- 9.David LA, Maurice CF, Carmody RN, Gootenberg DB, Button JE, Wolfe BE, et al. Diet rapidly and reproducibly alters the human gut microbiome. Nature. 2014;505:559–63. doi: 10.1038/nature12820. [DOI] [PMC free article] [PubMed] [Google Scholar]
- 10.Backhed F, Ding H, Wang T, Hooper LV, Koh GY, Nagy A, et al. The gut microbiota as an environmental factor that regulates fat storage. Proc Natl Acad Sci U S A. 2004;101:15718–23. doi: 10.1073/pnas.0407076101. [DOI] [PMC free article] [PubMed] [Google Scholar]
- 11.Cani PD, Amar J, Iglesias MA, Poggi M, Knauf C, Bastelica D, et al. Metabolic endotoxemia initiates obesity and insulin resistance. Diabetes. 2007;56:1761–72. doi: 10.2337/db06-1491. [DOI] [PubMed] [Google Scholar]
- 12.de La Serre CB, de Lartigue G, Raybould HE. Chronic exposure to low dose bacterial lipopolysaccharide inhibits leptin signaling in vagal afferent neurons. Physiol Behav. 2015;139:188–94. doi: 10.1016/j.physbeh.2014.10.032. [DOI] [PMC free article] [PubMed] [Google Scholar]
- 13.de Lartigue G, Barbier de la Serre C, Espero E, Lee J, Raybould HE. Leptin resistance in vagal afferent neurons inhibits cholecystokinin signaling and satiation in diet induced obese rats. PLoS One. 2012;7:e32967. doi: 10.1371/journal.pone.0032967. [DOI] [PMC free article] [PubMed] [Google Scholar]
- 14.Campos CA, Wright JS, Czaja K, Ritter RC. CCK-induced reduction of food intake and hindbrain MAPK signaling are mediated by NMDA receptor activation. Endocrinology. 2012;153:2633–46. doi: 10.1210/en.2012-1025. [DOI] [PMC free article] [PubMed] [Google Scholar]
- 15.Date Y, Murakami N, Toshinai K, Matsukura S, Niijima A, Matsuo H, et al. The role of the gastric afferent vagal nerve in ghrelin-induced feeding and growth hormone secretion in rats. Gastroenterology. 2002;123:1120–8. doi: 10.1053/gast.2002.35954. [DOI] [PubMed] [Google Scholar]
- 16.Kunnecke B, Verry P, Benardeau A, von Kienlin M. Quantitative body composition analysis in awake mice and rats by magnetic resonance relaxometry. Obes Res. 2004;12:1604–15. doi: 10.1038/oby.2004.200. [DOI] [PubMed] [Google Scholar]
- 17.Arndt D, Xia J, Liu Y, Zhou Y, Guo AC, Cruz JA, et al. METAGENassist: a comprehensive web server for comparative metagenomics. Nucleic Acids Research. 2012;40:W88–W95. doi: 10.1093/nar/gks497. [DOI] [PMC free article] [PubMed] [Google Scholar]
- 18.Segata N, Huttenhower C. Toward an efficient method of identifying core genes for evolutionary and functional microbial phylogenies. PLoS One. 2011;6:e24704. doi: 10.1371/journal.pone.0024704. [DOI] [PMC free article] [PubMed] [Google Scholar]
- 19.Segata N, Izard J, Waldron L, Gevers D, Miropolsky L, Garrett WS, et al. Metagenomic biomarker discovery and explanation. Genome Biol. 2011;12:R60. doi: 10.1186/gb-2011-12-6-r60. [DOI] [PMC free article] [PubMed] [Google Scholar]
- 20.Gallaher ZR, Ryu V, Herzog T, Ritter RC, Czaja K. Changes in microglial activation within the hindbrain, nodose ganglia, and the spinal cord following subdiaphragmatic vagotomy. Neurosci Lett. 2012;513:31–6. doi: 10.1016/j.neulet.2012.01.079. [DOI] [PMC free article] [PubMed] [Google Scholar]
- 21.Shehab SA. Acute and chronic sectioning of fifth lumbar spinal nerve has equivalent effects on the primary afferents of sciatic nerve in rat spinal cord. J Comp Neurol. 2009;517:481–92. doi: 10.1002/cne.22163. [DOI] [PubMed] [Google Scholar]
- 22.Peters JH, Gallaher ZR, Ryu V, Czaja K. Withdrawal and restoration of central vagal afferents within the dorsal vagal complex following subdiaphragmatic vagotomy. J Comp Neurol. 2013;521:3584–99. doi: 10.1002/cne.23374. [DOI] [PMC free article] [PubMed] [Google Scholar]
- 23.Hunter DA, Moradzadeh A, Whitlock EL, Brenner MJ, Myckatyn TM, Wei CH, et al. Binary imaging analysis for comprehensive quantitative histomorphometry of peripheral nerve. J Neurosci Methods. 2007;166:116–24. doi: 10.1016/j.jneumeth.2007.06.018. [DOI] [PMC free article] [PubMed] [Google Scholar]
- 24.Lin Z, Dodd CA, Filipov NM. Short-term atrazine exposure causes behavioral deficits and disrupts monoaminergic systems in male C57BL/6 mice. Neurotoxicol Teratol. 2013;39:26–35. doi: 10.1016/j.ntt.2013.06.002. [DOI] [PubMed] [Google Scholar]
- 25.Levin BE, Dunn-Meynell AA, Balkan B, Keesey RE. Selective breeding for diet-induced obesity and resistance in Sprague-Dawley rats. Am J Physiol. 1997;273:R725–30. doi: 10.1152/ajpregu.1997.273.2.R725. [DOI] [PubMed] [Google Scholar]
- 26.Fabbrini E, Magkos F, Mohammed BS, Pietka T, Abumrad NA, Patterson BW, et al. Intrahepatic fat, not visceral fat, is linked with metabolic complications of obesity. Proc Natl Acad Sci U S A. 2009;106:15430–5. doi: 10.1073/pnas.0904944106. [DOI] [PMC free article] [PubMed] [Google Scholar]
- 27.Miele L, Valenza V, La Torre G, Montalto M, Cammarota G, Ricci R, et al. Increased intestinal permeability and tight junction alterations in nonalcoholic fatty liver disease. Hepatology. 2009;49:1877–87. doi: 10.1002/hep.22848. [DOI] [PubMed] [Google Scholar]
- 28.Hudgins LC, Hellerstein M, Seidman C, Neese R, Diakun J, Hirsch J. Human fatty acid synthesis is stimulated by a eucaloric low fat, high carbohydrate diet. J Clin Invest. 1996;97:2081–91. doi: 10.1172/JCI118645. [DOI] [PMC free article] [PubMed] [Google Scholar]
- 29.Ouyang X, Cirillo P, Sautin Y, McCall S, Bruchette JL, Diehl AM, et al. Fructose consumption as a risk factor for non-alcoholic fatty liver disease. J Hepatol. 2008;48:993–9. doi: 10.1016/j.jhep.2008.02.011. [DOI] [PMC free article] [PubMed] [Google Scholar]
- 30.Musselman LP, Fink JL, Narzinski K, Ramachandran PV, Hathiramani SS, Cagan RL, et al. A high-sugar diet produces obesity and insulin resistance in wild-type Drosophila. Dis Model Mech. 2011;4:842–9. doi: 10.1242/dmm.007948. [DOI] [PMC free article] [PubMed] [Google Scholar]
- 31.Abbott WG, Howard BV, Ruotolo G, Ravussin E. Energy expenditure in humans: effects of dietary fat and carbohydrate. Am J Physiol. 1990;258:E347–51. doi: 10.1152/ajpendo.1990.258.2.E347. [DOI] [PubMed] [Google Scholar]
- 32.Turnbaugh PJ, Backhed F, Fulton L, Gordon JI. Diet-induced obesity is linked to marked but reversible alterations in the mouse distal gut microbiome. Cell Host Microbe. 2008;3:213–23. doi: 10.1016/j.chom.2008.02.015. [DOI] [PMC free article] [PubMed] [Google Scholar]
- 33.Turnbaugh PJ, Gordon JI. An invitation to the marriage of metagenomics and metabolomics. Cell. 2008;134:708–13. doi: 10.1016/j.cell.2008.08.025. [DOI] [PubMed] [Google Scholar]
- 34.Hamilton MK, Boudry G, Lemay DG, Raybould HE. Changes in intestinal barrier function and gut microbiota in high-fat diet-fed rats are dynamic and region dependent. Am J Physiol Gastrointest Liver Physiol. 2015;308:G840–51. doi: 10.1152/ajpgi.00029.2015. [DOI] [PMC free article] [PubMed] [Google Scholar]
- 35.Chassaing B, Miles-Brown J, Pellizzon M, Ulman E, Ricci M, Zhang L, et al. Lack of soluble fiber drives diet-induced adiposity in mice. Am J Physiol Gastrointest Liver Physiol. 2015;309:G528–41. doi: 10.1152/ajpgi.00172.2015. [DOI] [PMC free article] [PubMed] [Google Scholar]
- 36.Mosca A, Leclerc M, Hugot JP. Gut Microbiota Diversity and Human Diseases: Should We Reintroduce Key Predators in Our Ecosystem? Front Microbiol. 2016;7:455. doi: 10.3389/fmicb.2016.00455. [DOI] [PMC free article] [PubMed] [Google Scholar]
- 37.Cotillard A, Kennedy SP, Kong LC, Prifti E, Pons N, Le Chatelier E, et al. Dietary intervention impact on gut microbial gene richness. Nature. 2013;500:585–8. doi: 10.1038/nature12480. [DOI] [PubMed] [Google Scholar]
- 38.de La Serre CB, Ellis CL, Lee J, Hartman AL, Rutledge JC, Raybould HE. Propensity to high-fat diet-induced obesity in rats is associated with changes in the gut microbiota and gut inflammation. Am J Physiol Gastrointest Liver Physiol. 2010;299:G440–8. doi: 10.1152/ajpgi.00098.2010. [DOI] [PMC free article] [PubMed] [Google Scholar]
- 39.Annuk H, Shchepetova J, Kullisaar T, Songisepp E, Zilmer M, Mikelsaar M. Characterization of intestinal lactobacilli as putative probiotic candidates. J Appl Microbiol. 2003;94:403–12. doi: 10.1046/j.1365-2672.2003.01847.x. [DOI] [PubMed] [Google Scholar]
- 40.Kim KA, Gu W, Lee IA, Joh EH, Kim DH. High fat diet-induced gut microbiota exacerbates inflammation and obesity in mice via the TLR4 signaling pathway. PLoS One. 2012;7:e47713. doi: 10.1371/journal.pone.0047713. [DOI] [PMC free article] [PubMed] [Google Scholar]
- 41.Cho I, Yamanishi S, Cox L, Methe BA, Zavadil J, Li K, et al. Antibiotics in early life alter the murine colonic microbiome and adiposity. Nature. 2012;488:621–6. doi: 10.1038/nature11400. [DOI] [PMC free article] [PubMed] [Google Scholar]
- 42.Gomez-Arango LF, Barrett HL, McIntyre HD, Callaway LK, Morrison M, Dekker Nitert M, et al. Connections Between the Gut Microbiome and Metabolic Hormones in Early Pregnancy in Overweight and Obese Women. Diabetes. 2016;65:2214–23. doi: 10.2337/db16-0278. [DOI] [PubMed] [Google Scholar]
- 43.Duca FA, Sakar Y, Lepage P, Devime F, Langelier B, Dore J, et al. Replication of obesity and associated signaling pathways through transfer of microbiota from obese-prone rats. Diabetes. 2014;63:1624–36. doi: 10.2337/db13-1526. [DOI] [PubMed] [Google Scholar]
- 44.Kirpich IA, Petrosino J, Ajami N, Feng W, Wang Y, Liu Y, et al. Saturated and Unsaturated Dietary Fats Differentially Modulate Ethanol-Induced Changes in Gut Microbiome and Metabolome in a Mouse Model of Alcoholic Liver Disease. Am J Pathol. 2016;186:765–76. doi: 10.1016/j.ajpath.2015.11.017. [DOI] [PMC free article] [PubMed] [Google Scholar]
- 45.Hakansson A, Molin G. Gut microbiota and inflammation. Nutrients. 2011;3:637–82. doi: 10.3390/nu3060637. [DOI] [PMC free article] [PubMed] [Google Scholar]
- 46.Jin Y, Zeng Z, Wu Y, Zhang S, Fu Z. Oral Exposure of Mice to Carbendazim Induces Hepatic Lipid Metabolism Disorder and Gut Microbiota Dysbiosis. Toxicol Sci. 2015;147:116–26. doi: 10.1093/toxsci/kfv115. [DOI] [PubMed] [Google Scholar]
- 47.Kelder T, Stroeve JH, Bijlsma S, Radonjic M, Roeselers G. Correlation network analysis reveals relationships between diet-induced changes in human gut microbiota and metabolic health. Nutr Diabetes. 2014;4:e122. doi: 10.1038/nutd.2014.18. [DOI] [PMC free article] [PubMed] [Google Scholar]
- 48.Canfora EE, Jocken JW, Blaak EE. Short-chain fatty acids in control of body weight and insulin sensitivity. Nat Rev Endocrinol. 2015;11:577–91. doi: 10.1038/nrendo.2015.128. [DOI] [PubMed] [Google Scholar]
- 49.Baldwin J, Collins B, Wolf PG, Martinez K, Shen W, Chuang CC, et al. Table grape consumption reduces adiposity and markers of hepatic lipogenesis and alters gut microbiota in butter fat-fed mice. J Nutr Biochem. 2016;27:123–35. doi: 10.1016/j.jnutbio.2015.08.027. [DOI] [PMC free article] [PubMed] [Google Scholar]
- 50.Zhong W, Li Q, Xie G, Sun X, Tan X, Sun X, et al. Dietary fat sources differentially modulate intestinal barrier and hepatic inflammation in alcohol-induced liver injury in rats. Am J Physiol Gastrointest Liver Physiol. 2013;305:G919–32. doi: 10.1152/ajpgi.00226.2013. [DOI] [PMC free article] [PubMed] [Google Scholar]
- 51.Noth R, Lange-Grumfeld J, Stuber E, Kruse ML, Ellrichmann M, Hasler R, et al. Increased intestinal permeability and tight junction disruption by altered expression and localization of occludin in a murine graft versus host disease model. BMC Gastroenterol. 2011;11:109. doi: 10.1186/1471-230X-11-109. [DOI] [PMC free article] [PubMed] [Google Scholar]
- 52.Caccamo D, Katsetos CD, Herman MM, Frankfurter A, Collins VP, Rubinstein LJ. Immunohistochemistry of a spontaneous murine ovarian teratoma with neuroepithelial differentiation. Neuron-associated beta-tubulin as a marker for primitive neuroepithelium. Lab Invest. 1989;60:390–8. [PubMed] [Google Scholar]
- 53.Li H, Nomura S, Mizuno N. Binding of the isolectin I-B4 from Griffonia simplicifolia to the general visceral afferents in the vagus nerve: a light- and electron-microscope study in the rat. Neurosci Lett. 1997;222:53–6. doi: 10.1016/s0304-3940(97)13341-9. [DOI] [PubMed] [Google Scholar]
- 54.Wang H, Rivero-Melian C, Robertson B, Grant G. Transganglionic transport and binding of the isolectin B4 from Griffonia simplicifolia I in rat primary sensory neurons. Neuroscience. 1994;62:539–51. doi: 10.1016/0306-4522(94)90387-5. [DOI] [PubMed] [Google Scholar]
- 55.Covasa M, Ritter RC. Rats maintained on high-fat diets exhibit reduced satiety in response to CCK and bombesin. Peptides. 1998;19:1407–15. doi: 10.1016/s0196-9781(98)00096-5. [DOI] [PubMed] [Google Scholar]
- 56.Little TJ, Horowitz M, Feinle-Bisset C. Modulation by high-fat diets of gastrointestinal function and hormones associated with the regulation of energy intake: implications for the pathophysiology of obesity. Am J Clin Nutr. 2007;86:531–41. doi: 10.1093/ajcn/86.3.531. [DOI] [PubMed] [Google Scholar]
- 57.Qin L, Wu X, Block ML, Liu Y, Breese GR, Hong JS, et al. Systemic LPS causes chronic neuroinflammation and progressive neurodegeneration. Glia. 2007;55:453–62. doi: 10.1002/glia.20467. [DOI] [PMC free article] [PubMed] [Google Scholar]
- 58.Alexandra C, Vaughna EMC, DiLorenzob Patricia M, O’Loughlinc Levi J, Konkelc Michael E, Petersa James H, Hajnald Andras, Sene Tanusree, Leef Sun Hye, Claire B, Serref de La, Krzysztof Czaja. Energy-dense diet triggers changes in gut microbiota, reorganization of gut-brain vagal communication and increased body fat accumulation. Acta Neurob Exp. 2017;77 doi: 10.21307/ane-2017-033. in press. [DOI] [PMC free article] [PubMed] [Google Scholar]
- 59.Qin L, Li G, Qian X, Liu Y, Wu X, Liu B, et al. Interactive role of the toll-like receptor 4 and reactive oxygen species in LPS-induced microglia activation. Glia. 2005;52:78–84. doi: 10.1002/glia.20225. [DOI] [PubMed] [Google Scholar]
- 60.Henry CJ, Huang Y, Wynne AM, Godbout JP. Peripheral lipopolysaccharide (LPS) challenge promotes microglial hyperactivity in aged mice that is associated with exaggerated induction of both pro-inflammatory IL-1beta and anti-inflammatory IL-10 cytokines. Brain Behav Immun. 2009;23:309–17. doi: 10.1016/j.bbi.2008.09.002. [DOI] [PMC free article] [PubMed] [Google Scholar]
- 61.de Lartigue G, Barbier de la Serre C, Espero E, Lee J, Raybould HE. Diet-induced obesity leads to the development of leptin resistance in vagal afferent neurons. Am J Physiol Endocrinol Metab. 2011;301:E187–95. doi: 10.1152/ajpendo.00056.2011. [DOI] [PMC free article] [PubMed] [Google Scholar]
- 62.Laskiewicz J, Krolczyk G, Zurowski G, Sobocki J, Matyja A, Thor PJ. Effects of vagal neuromodulation and vagotomy on control of food intake and body weight in rats. J Physiol Pharmacol. 2003;54:603–10. [PubMed] [Google Scholar]
- 63.Ballsmider LA, Vaughn AC, David M, Hajnal A, Di Lorenzo PM, Czaja K. Sleeve gastrectomy and Roux-en-Y gastric bypass alter the gut-brain communication. Neural Plast. 2015;2015:601985. doi: 10.1155/2015/601985. [DOI] [PMC free article] [PubMed] [Google Scholar]
- 64.Valdivia S, Patrone A, Reynaldo M, Perello M. Acute High Fat Diet Consumption Activates the Mesolimbic Circuit and Requires Orexin Signaling in a Mouse Model. PLoS ONE. 2014;9:e87478. doi: 10.1371/journal.pone.0087478. [DOI] [PMC free article] [PubMed] [Google Scholar]
- 65.Paulino G, Darcel N, Tome D, Raybould H. Adaptation of lipid-induced satiation is not dependent on caloric density in rats. Physiol Behav. 2008;93:930–6. doi: 10.1016/j.physbeh.2007.12.015. [DOI] [PMC free article] [PubMed] [Google Scholar]
- 66.El-Haschimi K, Pierroz DD, Hileman SM, Bjorbaek C, Flier JS. Two defects contribute to hypothalamic leptin resistance in mice with diet-induced obesity. J Clin Invest. 2000;105:1827–32. doi: 10.1172/JCI9842. [DOI] [PMC free article] [PubMed] [Google Scholar]
- 67.Nefti W, Chaumontet C, Fromentin G, Tome D, Darcel N. A high-fat diet attenuates the central response to within-meal satiation signals and modifies the receptor expression of vagal afferents in mice. Am J Physiol Regul Integr Comp Physiol. 2009;296:R1681–6. doi: 10.1152/ajpregu.90733.2008. [DOI] [PubMed] [Google Scholar]
- 68.Beilharz JE, Kaakoush NO, Maniam J, Morris MJ. The effect of short-term exposure to energy-matched diets enriched in fat or sugar on memory, gut microbiota and markers of brain inflammation and plasticity. Brain, Behavior, and Immunity. 2016;57:304–13. doi: 10.1016/j.bbi.2016.07.151. [DOI] [PubMed] [Google Scholar]
- 69.Hamilton MK, Boudry G, Lemay DG, Raybould HE. Changes in intestinal barrier function and gut microbiota in high-fat diet-fed rats are dynamic and region dependent. American Journal of Physiology - Gastrointestinal and Liver Physiology. 2015;308:G840–G51. doi: 10.1152/ajpgi.00029.2015. [DOI] [PMC free article] [PubMed] [Google Scholar]
- 70.Erridge C, Attina T, Spickett CM, Webb DJ. A high-fat meal induces low-grade endotoxemia: evidence of a novel mechanism of postprandial inflammation. Am J Clin Nutr. 2007;86:1286–92. doi: 10.1093/ajcn/86.5.1286. [DOI] [PubMed] [Google Scholar]
- 71.Ghanim H, Abuaysheh S, Sia CL, Korzeniewski K, Chaudhuri A, Fernandez-Real JM, et al. Increase in Plasma Endotoxin Concentrations and the Expression of Toll-Like Receptors and Suppressor of Cytokine Signaling-3 in Mononuclear Cells After a High-Fat, High-Carbohydrate Meal: Implications for insulin resistance. Diabetes Care. 2009;32:2281–7. doi: 10.2337/dc09-0979. [DOI] [PMC free article] [PubMed] [Google Scholar]
- 72.Kalia M, Sullivan JM. Brainstem projections of sensory and motor components of the vagus nerve in the rat. J Comp Neurol. 1982;211:248–65. doi: 10.1002/cne.902110304. [DOI] [PubMed] [Google Scholar]
- 73.Shapiro RE, Miselis RR. The central organization of the vagus nerve innervating the stomach of the rat. J Comp Neurol. 1985;238:473–88. doi: 10.1002/cne.902380411. [DOI] [PubMed] [Google Scholar]
- 74.Kashyap PC, Marcobal A, Ursell LK, Larauche M, Duboc H, Earle KA, et al. Complex interactions among diet, gastrointestinal transit, and gut microbiota in humanized mice. Gastroenterology. 2013;144:967–77. doi: 10.1053/j.gastro.2013.01.047. [DOI] [PMC free article] [PubMed] [Google Scholar]
- 75.Uno K, Katagiri H, Yamada T, Ishigaki Y, Ogihara T, Imai J, et al. Neuronal pathway from the liver modulates energy expenditure and systemic insulin sensitivity. Science. 2006;312:1656–9. doi: 10.1126/science.1126010. [DOI] [PubMed] [Google Scholar]
- 76.Horn CC, Tordoff MG, Friedman MI. Role of vagal afferent innervation in feeding and brain Fos expression produced by metabolic inhibitors. Brain Res. 2001;919:198–206. doi: 10.1016/s0006-8993(01)02963-8. [DOI] [PubMed] [Google Scholar]
- 77.Tanida M, Imanishi K, Akashi H, Kurata Y, Chonan O, Naito E, et al. Injection of Lactobacillus casei strain Shirota affects autonomic nerve activities in a tissue-specific manner, and regulates glucose and lipid metabolism in rats. J Diabetes Investig. 2014;5:153–61. doi: 10.1111/jdi.12141. [DOI] [PMC free article] [PubMed] [Google Scholar]
- 78.Konishi Y, Koosaka Y, Maruyama R, Imanishi K, Kasahara K, Matsuda A, et al. L-Ornithine intake affects sympathetic nerve outflows and reduces body weight and food intake in rats. Brain Res Bull. 2015;111:48–52. doi: 10.1016/j.brainresbull.2014.11.004. [DOI] [PubMed] [Google Scholar]
- 79.Liu C, Bookout AL, Lee S, Sun K, Jia L, Lee C, et al. PPARgamma in vagal neurons regulates high-fat diet induced thermogenesis. Cell Metab. 2014;19:722–30. doi: 10.1016/j.cmet.2014.01.021. [DOI] [PMC free article] [PubMed] [Google Scholar]