Abstract
We examine the broadband behavior of complex electrical properties of glycerin and water mixtures over the frequency range of 0.1 – 25.0 GHz, especially as they relate to using these liquids as coupling media for microwave tomographic imaging. Their combination is unique in that they are mutually miscible over the full range of concentrations which allows them to be tailored to dielectric property matching for biological tissues. While the resultant mixture properties are partially driven by differences in the inherent low frequency permittivity of each constituent, relaxation frequency shifts play a disproportionately larger role in increasing the permittivity dispersion while also dramatically increasing the effective conductivity over the frequency range of 1 to 3 GHz. For the full range of mixture ratios, the relaxation frequency shifts from 17.5 GHz for 0% glycerin to less than 0.1 GHz for 100% glycerin. Of particular interest is the fact that the conductivity stays above 1.0 S/m over the 1–3 GHz range for glycerin mixture ratios (70–90% glycerin) we use for microwave breast tomography. The high level of attenuation is critical for suppressing unwanted multipath signals. This paper presents a full characterization of these liquids along with a discussion of their benefits and limitations in the context of microwave tomography.
Index Terms: microwave tomography, coupling liquid, glycerin, relaxation frequency, bound water
I. Introduction
Microwave imaging generally requires some form of medium to couple the electromagnetic signals to and from the tissue being interrogated. These media have ostensibly ranged from air [1] to oils – especially canola oil [2], all the way to water [3],[4] and saline [5],[6] at the high end of the dielectric constant spectrum. Contacting approaches have also been investigated where surrounding spaces are filled with a matching medium or 2% saline to ensure good electrical contact and suppression of multi-path signals [7],[8]. The motivation has typically been to match the properties of the coupling medium closely with the target to minimize signal reflections at their interface. The lower permittivity liquids such as oils have been intended for coupling to lower water content tissues such as the breast while water and saline are utilized for higher property tissues. Over time, appreciation of the impact of multi-path signals and their ability to corrupt desired measurements has increased [9],[10]. One approach has fabricated a miniature anechoic chamber around the target zone and antennas to suppress the unwanted reflections [1]. Another low loss, oil based approach implemented by the team at the University of Calgary utilized a single antenna in a sufficiently large bath to ensure adequate decay of multi-path signals [11]. A lossy coupling liquid such as glycerin and water would not be well suited to a backscatter technique such as the Calgary system. Alternatives have also included wide-band, time-domain strategies that allow time-gating as a way to filter the stray signals [12].
We have used a lossy coupling bath to suppress multi-path signals while still capturing the desired response [10]. The approach is advantageous for transmission systems. For example, antenna bandwidth is broadened considerably because of the resistive loading [13]; however, large dynamic range is needed in the measurement system [14],[15].
Glycerin is extremely versatile as a coupling fluid because it is completely miscible in water allowing permittivity to be tailored to a wide range of tissue properties, which is especially important in breast imaging where values can vary considerably depending on radiographic density [16]-[18]. Glycerin is ideal from a human safety perspective because it is non-toxic and bacteria-static, and is used in many soaps, hand creams and foodstuffs. It also becomes lossy over the frequency range of 1 – 2.5 GHz making it suitable for suppressing unwanted multi-path signals [9],[10] and reducing antenna-antenna mutual coupling [19].
Glycerin is a three-carbon hydrocarbon with one hydroxyl group attached to each carbon atom, and is highly soluble in water [20]. The density of glycerin is 1.261 g/cm3, which makes accurate measurements of its concentration possible with simple hydrometer techniques. Glycerin, by itself, does not exhibit relaxation within UHF and microwave frequency ranges – 0.3 – 3.0 GHz and 3.0 – 25 GHz, respectively. However, when mixed with water it does influence the observed relaxation behavior. In this paper, we measure the properties of glycerin:water mixtures over a wide frequency range, and illustrate the effects on the resulting permittivity and conductivity values (Section III.A). We also show that the results mirror data from earlier reports by Schepps and Foster [21] in terms of the effects of bound water on mixture dielectric properties, and demonstrate they are consistent with similar compound:water mixtures (Sections III.B-F).
II. Methods
A. Dielectric relaxation theory for liquid mixtures
Glycerin (or glycerol) is categorized as an acyclic aliphatic alcohol containing three carbon atoms attached in a line with each containing one hydroxyl group (OH) and hydrogen atoms attached to the remainder of the carbon binding sites [22]. Glycerin by itself exhibits a single, low frequency, Debye-type relaxation in the UHF to microwave frequency range. The process is more complex for mixtures of glycerin with water, and is typically modeled by the Havriliak-Negami (HN) equation [23], and or the Debye and Cole-Cole equations [24]. The HN equation gives the complex permittivity as:
| (1) |
where ε∞ is the high frequency permittivity, ε0 is the low frequency permittivity, ω is the angular frequency, α is the shape function used to express the asymmetric relaxation curve broadness and β is the same except for the symmetric curve. When α = β =1, the relationship reverts to the Debye equation whereas setting α = 1 and letting β range from 0 to 1 becomes the Cole-Cole equation. When using these liquids as tomography coupling fluids, the relaxation frequency becomes important because of its associated impact on the mixture’s overall permittivity and conductivity. For this purpose, these three models are sufficient; however, a minor weakness does occur when describing the broadness of the dielectric loss for some aliphatic alcohols – especially for longer carbon chain compounds. In these instances, the Kohlrausch-Williams-Watts (KWW) function has been used successfully [25].
For room temperatures and for a range comfortably above the associated glass formation temperatures for each of these liquids [26], the full range of glycerin and water mixtures exhibit a single relaxation frequency within the UHF and microwave range, although with significant temperature dependence [22], [26]. For supercooled liquids, the dielectric loss often exhibits two relaxation peaks (alpha and beta processes) corresponding to an actual separation of the respective individual peaks of the alcohol and water. This phenomenon has been described in detail in Sudo et al. [26]. For room temperatures, the notion of cooperative domains (CD) has been introduced as a way of describing the hybrid relationship of the mixture constituents [27]. The CD is defined as a domain in which reorientation of molecules cooperatively occurs with dipole correlations. For the binary mixtures of glycerin and water, we assume three types of active environments simultaneously co-existing: CDW which contains only water, CDG which contains only glycerin, and CDW-G which includes both water and glycerin, respectively. The dielectric behavior of these mixtures depends considerably on the bulk fraction of the CDW-G which in turn is directly related to the mixture ratio of the two liquids. This construct effectively describes how the glycerin molecules cooperatively align with the water molecules to produce a single, composite dielectric relaxation time.
Sudo et al. [22] has presented a comprehensive summary of the relaxation behavior of a range of aliphatic alcohol – water mixtures at room temperature. As will be summarized below, the broadly shifting relaxation frequency shows a distinct pattern with respect to frequency along with the associated dielectric loss broadening. These published results are an important starting point for appreciating the general nature of these liquids and are consistent with our findings. They directly impact our understanding of how glycerin-water mixtures can be employed as a coupling fluid in a tomographic imaging setting.
B. Measurement techniques
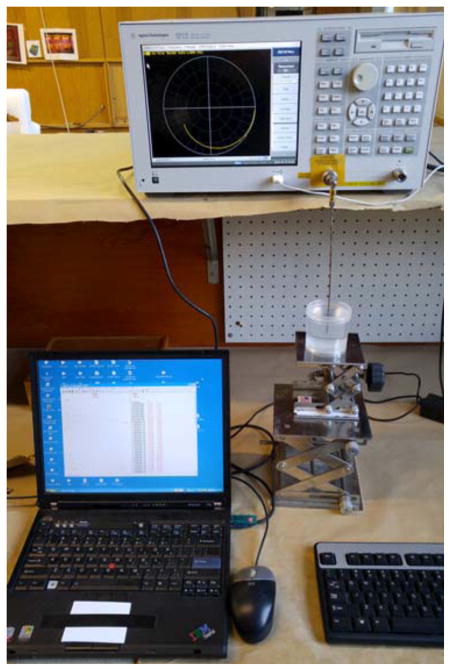
All measurements were made with a Keysight (Santa Clara, CA) E4440A Vector Network Analyzer (VNA) operating to 26.5 GHz coupled with the Agilent 85070E Dielectric Probe Kit and the Slim Form probe (Figure 1). The probe kit presents data in terms of complex permittivity:
| (2) |
where εr is the real permittivity (also referred to as the relative permittivity) and ε″ is the imaginary permittivity. The electrical conductivity, σ, is related to ε″ by
Fig. 1.
Photograph of a representative dielectric measurement system showing the probe, vector network analyzer, controlling computer and the liquid sample.
| (3) |
where ω is the frequency in radians and εo is the free space permittivity.
We deliberately eliminated a flexible coaxial cable from the measurement configuration to recover more consistent and reliable results by minimizing the distance between the VNA port and the probe tip. Data was acquired from 100 MHz to 25 GHz in 100 MHz increments. The calibration process utilized a standard open/short/water reference (the water was de-ionized) and the temperature was 21°C. The mixture ratios of water and glycerin were determined by weight and were prepared 5 days before the experiment to ensure complete mixing. Each was shaken vigorously 30 minutes before the testing. The mixtures were allowed to equilibrate to room temperature for over 4 hours. The mixtures exhibited minimal air bubbles, and we carefully watched for any air bubbles near the probe tip at the time of measurements. Each measurement was recorded three times and averages are presented. The standard deviation was less than 1% for all samples across the frequency band; therefore, error bars have not been included in the plots to simplify the presentation.
C. Dartmouth microwave tomography system
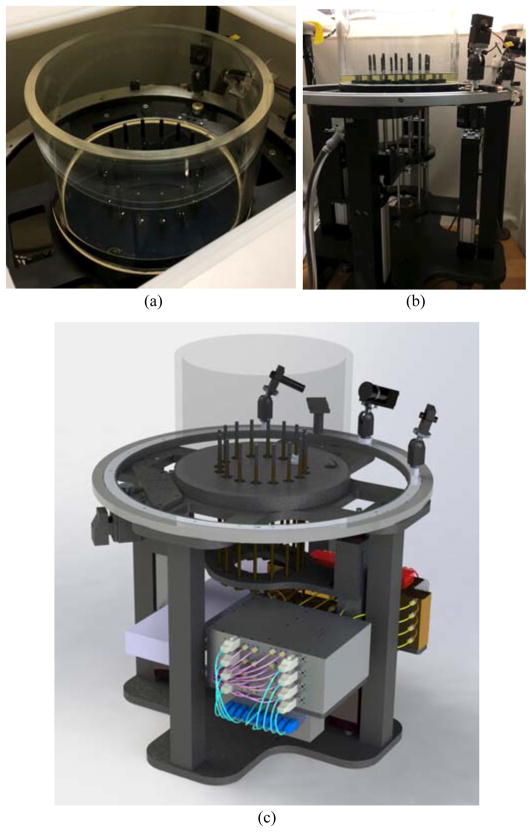
Figures 2a and b show photographs of the existing illumination tank, 16 monopole antennas and the motion system for controlling the antenna position. Figure 2c shows a SolidWorks (Waltham, MA) rendering of our new microwave tomography imaging system. The primary features in the view are the imaging tank, array of 16 monopole antennas and the aperture in the top cover through which the target (e.g., breast) is pendant into the liquid. The active portion of the antennas is 3.5 mm long and the array is configured on a 15.2 cm diameter circle. The antenna array is moved vertically to acquire data at multiple planes of the object. Each antenna operates as both as transmitter and receiver, and data are typically collected at seven frequencies from 700 to 1900 MHz in 200 MHz increments [15]. In terms of patient imaging, glycerin is ideal as a potential coupling fluid because it is non-toxic and bacteria static, and presents no health risks.
Fig. 2.
Photographs of the existing tank:antenna system: (a) top view, and (b) side view showing the antenna mounting plate and associated motors for moving the antennas vertically. (c) 3D rendering of the illumination tank of the new microwave breast tomography system. The ends of the rods inside the tank comprise the active portions of the antennas. The microwave electronics are located in the space below the tank and are attached to the antenna mounting plate.
As described in subsequent sections, glycerin:water mixtures are well suited to microwave tomographic imaging – especially breast imaging. Because glycerin and water are completely miscible with each other, they can be combined in different ratios to tailor the mixture properties to match approximately the averages of those of patients with different breast densities [28]. Equally important, the conductivity and subsequently the associated signal attenuation, is high for these glycerin:water combinations. The implications of high loss are largely positive: (1) the bath suppresses potentially confounding multi-path signals [10]; (2) the liquid resistive loads the antennas so that they can operate effectively over a broad frequency range (0.5 – 3 GHz); (3) the loss allows the illumination chamber to be relatively small [29], and (4) the attenuation facilitates use of the discrete dipole approximation (DDA) as the forward solver in the iterative image reconstruction process which dramatically reduces computation time [30]. These characteristics contribute to realization of a compact and effective imaging system with the caveat that the desired signals are also attenuated much more than in a low loss coupling bath.
To accommodate extra signal loss, we developed a custom measurement system which has a noise floor of -140 dBm for a 0 dBm transmit signal and channel-to-channel isolation also on the order of 140 dB [15]. At our highest frequency of operation (~1900 MHz), measured signals range from -50 to -120 dBm during a typical breast exam, which implies the signal to noise ratio (SNR) ranges from 90 dB for antennas closest to the transmitter to 20 dB for those furthest away (and on the opposite side of the breast from the transmitter). Previous studies have indicated that we can reconstruct good quality images if the SNR is at least 10 dB for all measurements [31]. Therefore, the measurement system described is the adequate for the task.
Equally important to our approach is an imaging algorithm that utilizes a Gauss-Newton iterative scheme with log transformation [31]. The log transform recovers images without a priori information, and demonstrates excellent convergence behavior relative to comparable algorithms based directly on complex-valued electric fields. It operates directly on phase terms, which add some complexity because of the potential for phase wrapping [32], [33], but also introduces phase projection as a way to gauge quantitatively the level of dielectric property match between the coupling bath and actual breast [28] in which the phase projection for a single transmitter is defined as the difference in the phases when the target is and is not present. Thus, at one extreme of a perfect match between the breast and bath, the phase projection would be zero. At a very high contrast between the two, the phase projection could easily rise to several multiples of pi. In practice, we strive to keep the phase projection within a range of +/− 2π. As a result, we tailor the coupling bath properties to different patients, and have found two or three different glycerin:water ratio baths are sufficient to accommodate most every case.
The Dartmouth microwave imaging system has been used in a range of experiments and clinical exams with success [28], [34], [35]. Our image reconstruction has been shown to have excellent convergence behavior with respect to conventional L2 norm metrics, and also when comparing the measured and computed amplitude and phase projections at the completion of the reconstruction process [36]. Antennas are packed into a tight arrangement surrounding the target, but are relatively long in the vertical direction which effectively mimics the 2D case of a long cylindrical geometry and provides a modest amount of directivity along that axis. The lossy coupling bath also plays a role by attenuating signals propagating out of the imaging plane before they have a chance to re-appear in the measured data. Reports by Meaney et al. showed the approach and configuration was capable of recovering quantitative images of targets that varied geometrically in 3D [37]. Phase and amplitude projection comparisons between the simulated and measured values also confirm that the 2D model accurately matches the measured response despite all of its inherent 3D wave propagation [36].
III. Results
A. Dielectric properties as a function of mixture ratio
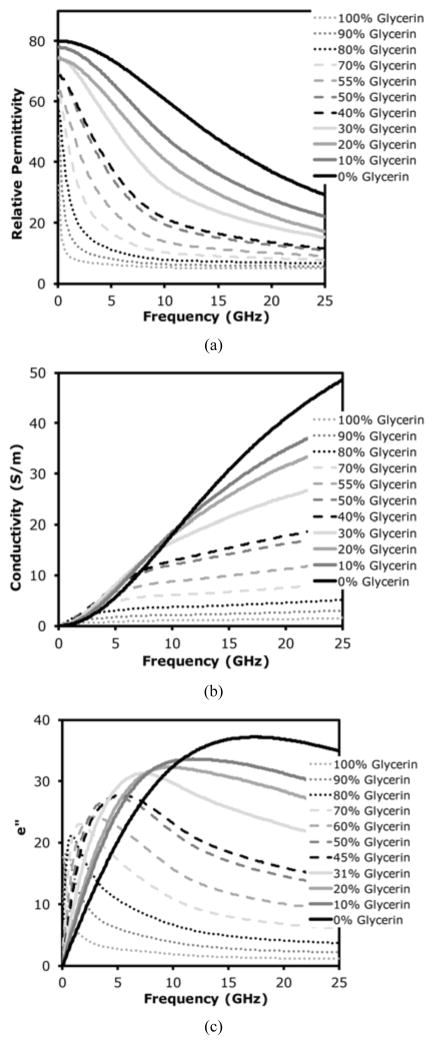
Figures 3a, b and c show plots of the real permittivity (εr), conductivity (σ) imaginary permittivity (ε″), respectively, over the range of 100 MHz to 25 GHz. We compared the measured values for pure water with computed values from Kaatze [38] and found RMS errors between the two for the real and imaginary permittivities were 0.30 and 0.16, respectively. By comparing the associated relaxation frequencies, the actual temperature was likely closer to 20.6°C than the measured 21.0°C, although the difference is within our measurement error. The real permittivity exhibits a monotonic decrease with increasing glycerin concentration over all frequencies. In addition, a pronounced steepening of the dispersion occurs with increasing glycerin:water ratio. For frequencies above 10 GHz, the conductivity increases monotonically with frequency and with water concentration. In addition, the slope of the conductivity variation with frequency decreases markedly with the increasing glycerin:water ratio. The plots become more complicated to interpret at lower frequencies and conductivity curves exhibit significant cross over as they approach zero at 100 MHz. The ε″ plots are descriptive of the underlying mechanisms, especially with respect to relaxation frequency. As expected, water presents an easily identifiable relaxation frequency at 17.45 GHz [38]. Interestingly, relaxation frequency decreases dramatically with increased glycerin concentration, and a peak is no longer detectable in the 100% glycerin case. For each peak, the rise from the lower frequency side is relatively steep and much more gradual for the higher frequency side. The steepness of the peaks increases with increasing glycerin:water ratio.
Fig. 3.
Measured dielectric properties of different glycerin concentrations as a function of frequency: (a) real permittivity, (b) electrical conductivity, and (c) imaginary permittivity.
B. Relaxation time as a function of water content
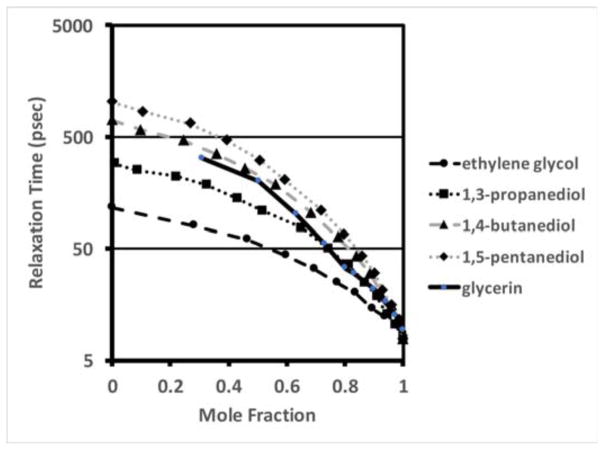
Figure 4 shows a plot of relaxation time of the glycerin:water mixtures as a function of mole fraction, and is compared with published values [22] for four representative aliphatic alcohols – ethylene glycol, 1,3-propanediol, 1,4-butanediol, and 1,5-pentanediol, respectively. As can be seen, the relaxation times vary from 1 to 2 orders of magnitude over this concentration range. At the high water content extreme, the relaxation times approach those of pure water, while at the lower water content bound, they approach values of the respective pure alcohols. Our measured values are consistent with the corresponding similar alcohols.
Fig. 4.
Plots of the measured glycerin relaxation time as a function of molar fraction compared with corresponding plots of associated, short carbon chain alcohols – ethylene glycol, 1,3-propanediol, 1,4-butanediol, 1,5-pentanediol, respectively.
C. Relative permittivity over the range of 0.1–3 GHz
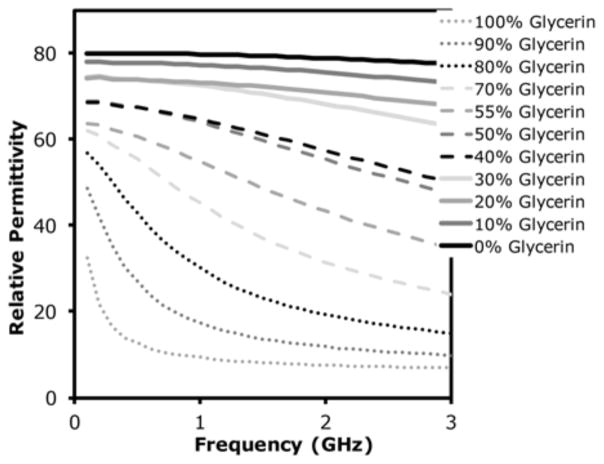
Figure 5 shows a plot of real permittivity as a function of frequency from 0.1 to 3 GHz for a range of glycerin concentrations. Here, the slope of the curves steepens within the 1–2 GHz band for increasing glycerin concentration until about 80%, after which it flattens out and steeper slopes shift towards lower frequencies.
Fig. 5.
Measured relative permittivity of glycerin:water mixtures as a function of frequency over the range 0.1–3 GHz.
D. Conductivity over the range of 0.1–3 GHz
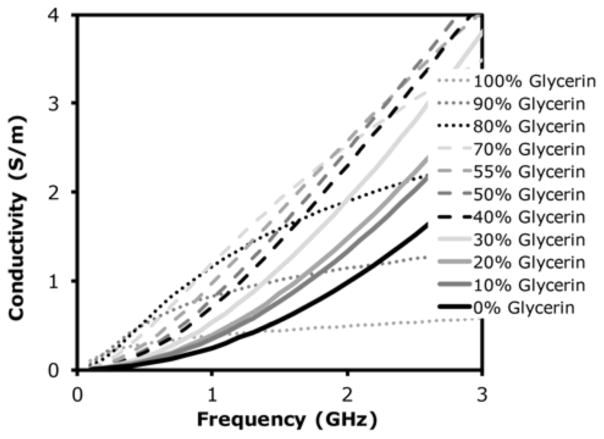
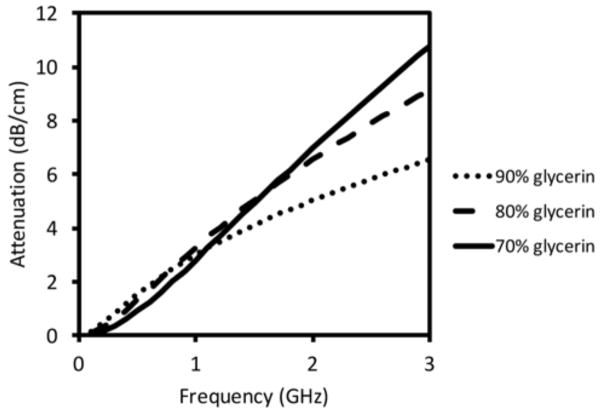
Figure 6 shows conductivity as a function of frequency from 0.1 to 3 GHz for the full range of glycerin concentrations. Both pure water and pure glycerin exhibit relatively low conductivity with the former starting to increase rapidly above 2 GHz. For glycerin concentrations between 70% and 90%, the curves are essentially concave downwards while they are concave upwards for lower concentrations. The behavior is directly related to the distinct shifting of relaxation frequency discussed in Section III.A. In this case, the curves are concave upwards for cases where the ε″ peak is above 3 GHz and concave downwards as the ε″ peak shifts below 3 GHz, corresponding to whether the curve is on the rising or falling edge of the ε″ plot. For glycerin concentrations in the range of 70–90%, conductivity remains mostly above 1 S/m from 1–2 GHz, which is quite lossy and allows antennas to operate over the broad bandwidth [13], but at the expense of high attenuation. Figure 7 presents the theoretical plane wave attenuation per centimeter as a function of frequency for glycerin concentrations of 70%, 80% and 90%, respectively. For distances between antennas of up to 15.2 cm in our imaging array, the attenuation is considerable, especially with increasing frequency.
Fig. 6.
Measured electrical conductivity of glycerin:water mixtures as a function of frequency over the range 0.1–3 GHz.
Fig. 7.
Plane wave attenuation as a function of frequency for three commonly used glycerin:water mixtures in tomographic imaging: 70%, 80%, and 90%, respectively.
E. Sugitani data comparison
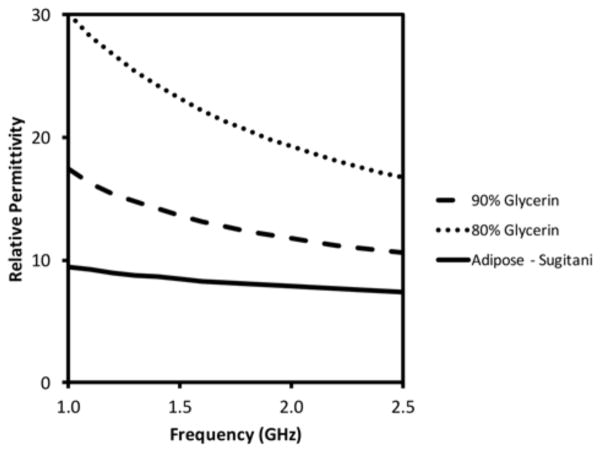
Figure 8 shows relative permittivity plotted over the imaging frequency range of interest for two glycerin concentrations relative to the fitted properties for breast adipose tissue reported in Sugitani et al. [18]. While the properties decline monotonically with frequency, the slope is less steep in the tissue case, and therefore, the contrast ratio with tissue also decreases – from 79% to 43% for the 90% glycerin and from 216% to 151% for 80% glycerin, respectively, from 1 to 2.5 GHz. The net effect of the contrast decrease is moderation of the phase projection increase with frequency [39].
Fig. 8.
Measured relative permittivity of two glycerin concentrations (80% and 90%) plotted as a function of frequency compared to published values for breast adipose tissue in [18].
F. Bound water effects
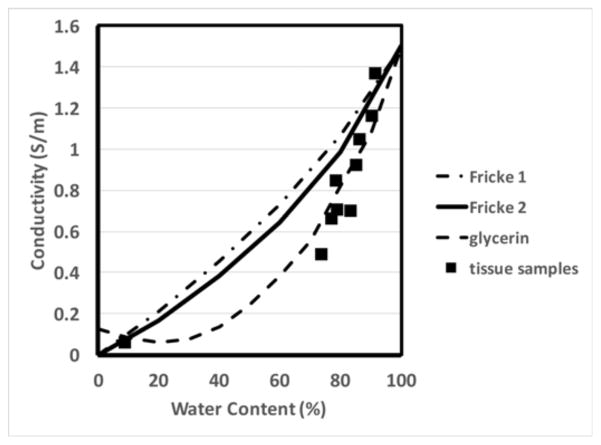
Figure 9 shows a plot of conductivity at 0.5, 2.0 and 5.0 GHz, respectively, for glycerin mixed with water and 0.9% saline as a function of concentration. Conductivity of the water mixtures increases from low values to a peak and then decreases to lower values as water content increases. The location of each peak is directly related to the shifting of relaxation frequency of the glycerin-water mixtures. Deviations between the water and saline cases begin to appear for concentrations above 30%, and widen for contents above 60%. This behavior is similar to observations that conductivity can only increase at relatively high saline concentrations described by Schepps and Foster [21] while testing tissue properties at 100 MHz. The response was attributed to the fact that water is almost entirely bound to proteins and long chain molecules at lower water content, hence restricting the ion mobility required for electrical conductivity. Only at higher water content do sufficient free water molecules exist to allow ion motion. The same effect appears in Figure 9, but with the added complication of a shifting relaxation frequency. For completeness, we also plotted the measured conductivity for saline mixtures with glycerin as a function of water content with results reported in Schepps and Foster [21] (Figure 10) at 100 MHz (the only frequency reported in the paper). The tissue sample measurement points deviate from the well-known Maxwell-Fricke mixture relationships at higher water contents, an effect that was primarily attributed to bound water contributions (Note that the two different Fricke curves in the plot relate to slightly different assumptions of the prolate ellipsoid axial ratios in the model.) The plot from the glycerin:water mixtures follows a similar pattern; however, the curve turns upward at the lowest water content levels, a consequence of the fact that the relaxation frequency for the lowest water content glycerin:water mixture has shifted below 100 MHz.
Fig. 9.
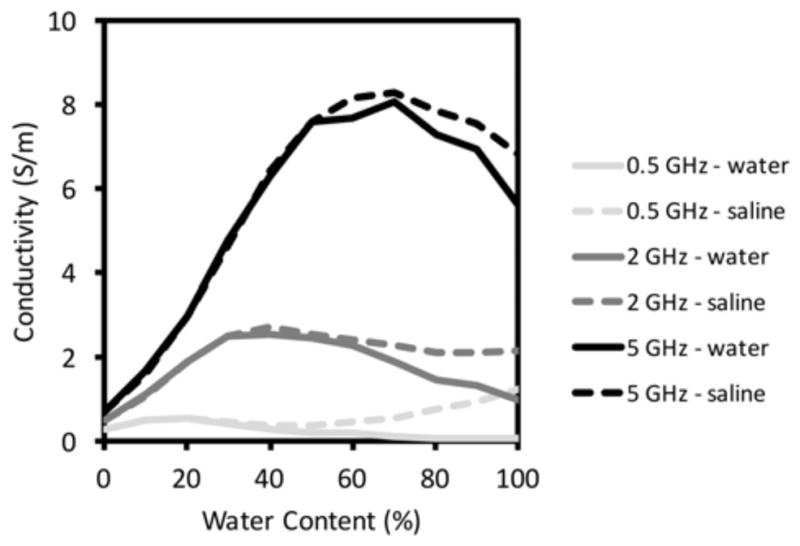
Measured electrical conductivity of glycerin:water and glycerin:saline mixtures as a function of glycerin concentration for three representative frequencies: 0.5, 2.0 and 5.0 GHz, respectively.
Fig. 10.
Comparison of measured glycerin:saline mixture conductivities at 100 MHz as a function of water content with plots of two possible theoretical Maxwell-Fricke mixture conditions and measured data for different water content animal tissue samples from Schepps and Foster [21].
IV. Conclusion
While the relative permittivity of glycerin:water solutions can be increased or decreased by changing their mixture ratio, changes in the dielectric relaxation frequency also have a dramatic effect on the resulting permittivity and conductivity. The relaxation frequency decreases from 17.45 GHz for pure water to less than 800 MHz for glycerin concentrations above 90% at 21°C, and significantly increases the negative slope of permittivity as a function of frequency. Conductivity increases dramatically, especially over the range of 1–3 GHz for most glycerin-water mixture ratios, even though the inherent conductivities of water and glycerin are quite low on their own.
The lossiness of glycerin:water coupling fluids has important implications for tomographic imaging. On the plus side, it reduces multi-path signals and eliminates antenna-antenna mutual coupling effects. It also resistively loads associated antennas to sufficiently large degree to broaden the potential operating bandwidth. The degree of lossiness makes possible a discrete dipole approximation (DDA) as a forward solver in the iterative reconstruction process which offers computational acceleration greater than an order of magnitude. However, the increased attenuation places demands on the measurement equipment. For example, the plane wave attenuation across an array diameter of 15 cm can result in signal strength drops of over 100 dB in the frequency span of 1–2 GHz. Thus, larger dynamic ranges and higher levels of channel-to-channel isolation are required than is available from many commercially-available vector network analyzers (VNAs). While the technical performance of VNAs is improving, suppressing or accounting for unwanted multi-path signals remains a formidable challenge. Nonetheless, glycerin offers practical benefits that make it well-suited to patient use.
Acknowledgments
This work was supported by the National Institutes of Health under Grant RO1-CA191227-01. Special thanks to Paul Siqueira at the University of Massachusetts for allowing us to use their network analyzer.
This work was supported by NIH/NCI Grant # RO1-CA191227. Drs. Meaney and Paulsen are co-owners of Microwave Imaging System Technologies, Inc. in Hanover, NH. They are co-inventors on several US patents related to microwave tomography for medical applications.
Biographies
Paul M. Meaney (M’91–SM’11) received AB’s in Electrical Engineering and Computer Science from Brown University in 1982. He earned his Masters Degree in Microwave Engineering from the University of Massachusetts in 1985 and worked in the millimeter-wave industry at companies including Millitech and Alpha Industries. He received his PhD from Dartmouth College in 1995 and spent two years as a postdoctoral fellow including one year at the Royal Marsden Hospital in Sutton, England. His research has focused mainly on microwave tomography which exploits the many facets of dielectric properties in tissue and other media. His principle interest over the last decade has been in the area of breast cancer imaging where his group was the first to translate an actual system into the clinic. The Dartmouth group has published several clinical studies in various settings including: (a) breast cancer diagnosis, (b) breast cancer chemotherapy monitoring, (c) bone density imaging, and (d) temperature monitoring during thermal therapy. He has also explored various commercial spin-off concepts such as detecting explosive liquids and non-invasively testing whether a bottle of wine has gone bad. He has been a Professor at Dartmouth College since 1997 and is also President of Microwave Imaging System Technologies, Inc. which he co-founded with Dr. Keith Paulsen in 1995. Dr. Meaney holds 10 patents, has co-authored over 60 peer-reviewed journal articles, co-written one textbook and presented numerous invited papers related to microwave imaging. He is also a professor in the Signals and Systems Division at Chalmers University of Technology in Gothenburg, Sweden.
Colleen J. Fox is currently the Assistant Chief Clinical Physicist in Radiation Oncology at the Dartmouth Hitchcock Medical Center and serves as an Associate Professor at the Geisel School of Medicine. Dr. Fox received her B.S. in Electrical Engineering from W.P.I. She worked as an electrical design engineer and as a product manager for W. L. Gore & Associates as well as 3M. She earned her Ph.D. from Dartmouth’s Thayer School of Engineering where she researched microwave and terahertz frequency antennas and signal propagation. After completing an academic clinical medical physics residency at the University of Michigan in 2012 Dr. Fox joined Dartmouth Hitchcock Medical Center. She currently instructs Radiation Therapy Physics through the Thayer School of Engineering as part of Dartmouth’s Medical Physics PhD Student Education Program.
Shireen D. Geimer received the B.S. degree in physics from Purdue University, Ft. Wayne, IN, in 1991, and the M.S. degree in engineering (specializing in space physics) from Dartmouth College, Hanover, NH, in 1995. Since the fall of 1994, she has been a Research Engineer with the Numerical Methods Laboratory, Thayer School of Engineering, Dartmouth College. Her current work includes mesh generation in two and three dimensions for remote sensing and biomedical applications, as well as execution of simulations and processing of modeling solutions.
Keith D. Paulsen (M’88 - SM’13) is the Pritzker Professor of Biomedical Engineering at the Thayer School of Engineering at Dartmouth College. He received his B.S. from Duke University and M.S. and Ph.D. degrees from Dartmouth College. Prior to joining the Dartmouth Faculty in 1988, he was an assistant professor in electrical and computer engineering at the University of Arizona and jointly, an assistant professor in radiation oncology at the University of Arizona Health Sciences Center. A recipient of numerous academic and research awards and fellowships, he has carried out sponsored research for the National Science Foundation, the Whitaker Foundation, and the National Institutes of Health through the National Cancer Institute and the National Institute on Neurological Disorders and Stroke. At Thayer School, Professor Paulsen teaches courses in computational methods for engineering and scientific problems, and biomedical engineering.
Dr. Paulsen has developed a significant interest in investigating breast cancer detection methods that could complement or compete with conventional x-ray mammography. He is studying near-infrared (NIR) optical interrogation of breast tissue, working to improve on previous experiments with simple transillumination techniques by utilizing recent developments in optical spectroscopy and imaging. Another important area of Dr. Paulsen’s research involves image-guided neurosurgery. A recognized limitation of image-guided systems is the misregistration of images arising from deformation of the brain subsequent to the preoperative imaging studies upon which guidance is based.
Dr. Paulsen has served on numerous national advisory committees for the National Cancer Institute, including membership on the Radiation Study Section and the Diagnostic Imaging Study Section. He has published more than 400 journal articles and nearly 100 conference papers and presentations including over 35 invited talks.
Contributor Information
Paul M. Meaney, Thayer School of Engineering at Dartmouth College, Hanover, NH 03755 USA and the Chalmers University of Technology, Gothenburg 41296 SE.
Colleen J. Fox, Deparetment of Radiology at the Dartmouth-Hitchcock Medical Center, Lebanon, NH 03766 USA
Shireen D. Geimer, Thayer School of Engineering at Dartmouth College, Hanover, NH 03755 USA
Keith D. Paulsen, Thayer School of Engineering at Dartmouth College, Hanover, NH 03755 USA.
References
- 1.Ostadrahimi M, Zakaria A, LoVetri J, Shafai L. A near-field dual polarized (TE-TM) microwave imaging system. IEEE Trans Microw Theory Tech. 2013 Mar;61(3):1376–1384. [Google Scholar]
- 2.Sill JM, Fear EC. Tissue sensing adaptive radar for breast cancer detection – experimental investigation of simple tumor models. IEEE Trans Microw Theory Tech. 2005 Nov;53(11):3312–3319. [Google Scholar]
- 3.Semenov SY, Svenson RH, Bulyshev AE, Souvorov AE, Nazarov AG, Sizov YE, Pavlovsky AV, Borisov VY, Voinov BA, Simonova GI, Starostin AN, Posukh VG, Tatsis GP, Baranov VY. Three-dimensional microwave tomography: experimental prototype of the system and vector Born reconstruction method. IEEE Trans Biomed Eng. 1999 Aug;46(8):937–946. doi: 10.1109/10.775403. [DOI] [PubMed] [Google Scholar]
- 4.Yu C, Yuan M, Stang J, Bresslour E, George RT, Ybarra GA, Joines WT, Liu QH. Active microwave imaging II: 3-D system prototype and image reconstruction from experimental data. IEEE Trans Microw Theory Tech. 2008 Apr;56(4):991–1000. [Google Scholar]
- 5.Meaney PM, Paulsen KD, Hartov A, Crane RK. An active microwave imaging system for reconstruction of 2-D electrical property distributions. IEEE Trans Biomed Eng. 1995 Oct;42(10):1017–1026. doi: 10.1109/10.464376. [DOI] [PubMed] [Google Scholar]
- 6.Meaney PM, Paulsen KD, Chang JT. Near-field microwave imaging of biologically based materials using a monopole transceiver system. IEEE Trans Microw Theory Tech. 1998 Jan;46(1):31–45. [Google Scholar]
- 7.Klemm M, Craddock I, Leendertz J, Preece A, Benjamin R. Experimental and clinical results of breast cancer detection using UWB microwave radar. IEEE Antennas Propagat. Soc. Int. Symp; San Diego, CA. 2008. [Google Scholar]
- 8.Bourqui J, Garrett J, Fear EC. Measurement and analysis of microwave frequency signals transmitted through the breast. Int J Biomed Imaging. 2012 Jan;2012(1):1–11. doi: 10.1155/2012/562563. paper ID # 562563. [DOI] [PMC free article] [PubMed] [Google Scholar]
- 9.Meaney PM, Fanning MW, Paulsen KD. Microwave imaging in MR for improved property recovery. Int. Appl. Comput. Electrom. Soc. Symp; Tampere, Finland. April 2010. [Google Scholar]
- 10.Meaney PM, Schubitidze F, Fanning MW, Kmiec M, Epstein NR, Paulsen KD. Surface wave multi-path signals in near-field microwave imaging. Int J Biomed Imaging. 2012 Jan;2012(1):1–11. doi: 10.1155/2012/697253. article #697253. [DOI] [PMC free article] [PubMed] [Google Scholar]
- 11.Bourqui J, Campbell MA, Williams T, Fear EC. Antenna evaluation for ultra-wideband microwave imaging. Int J Antenn Propagat. 2010 Mar;2010(3):1–8. article ID # 850149. [Google Scholar]
- 12.Jin T, Linxi Z, Nanjing L, Weijun C. Time-gating method for V/UHF antenna pattern measurement inside an anechoic chamber. Int. Conf. Mat. Manuf. Tech; Nanjing, China. 2008.pp. 942–945. [Google Scholar]
- 13.Fox CJ, Meaney PM, Shubitidze F, Potwin L, Paulsen KD. Characterization of a monopole antenna in a lossy medium for microwave breast computed tomography. In: Ibrahim TS, Crozier S, Fear E, editors. Int J Antenn Propagat. Vol. 2008. 2008. pp. 1–9. New Electromagnetic Methods and Applications of Antennas in Biomedicine. paper #5. [DOI] [PMC free article] [PubMed] [Google Scholar]
- 14.Li D, Meaney PM, Raynolds T, Pendergrass SA, Fanning MW, Paulsen KD. A parallel-detection microwave spectroscopy system for breast imaging. Rev Sci Instrum. 2004 Jul;75(7):2305–2313. [Google Scholar]
- 15.Epstein NR, Meaney PM, Paulsen KD. 3D parallel-detection microwave tomography for clinical breast imaging. Rev Sci Instrum. 2014 Dec;85(12):124704-1–124704-12. doi: 10.1063/1.4901936. paper #124704. [DOI] [PMC free article] [PubMed] [Google Scholar]
- 16.Poplack SP, Paulsen KD, Hartov A, Meaney PM, Pogue BW, Tosteson TD, Grove M, Soho S, Wells W. Electromagnetic breast imaging – average tissue property values in women with negative clinical findings. Radiology. 2004 May;231(2):571–580. doi: 10.1148/radiol.2312030606. [DOI] [PubMed] [Google Scholar]
- 17.Lazebnik M, McCartney L, Popovic D, Watkins CB, Lindstrom MJ, Harter J, Sewall S, Magliocco A, Booske JH, Okoniewski M, Hagness SC. A large-scale study of the ultrawideband microwave dielectric properties of normal breast tissue obtained from reduction surgeries. Phys Med Biol. 2007 Oct;52(20):2637–2656. doi: 10.1088/0031-9155/52/10/001. [DOI] [PubMed] [Google Scholar]
- 18.Sugitani T, Kubota SI, Kuroki SI, Sogo K, Arihiro K, Okada M, Kadoya T, Michihiro H, Oda M, Kikkawa T. Complex permittivities of breast tumor tissues obtained from cancer surgeries. Appl Phys Lett. 2014 Jun;104(25):253702-1–253702-5. [Google Scholar]
- 19.Meaney PM, Geimer SD, Paulsen KD. Mutual coupling in a tomographic imaging system. Eur. Conf. Antenn. Propagat; Berlin, Germany. Mar., 2009.pp. 2948–2949. [Google Scholar]
- 20.Lide DR. CRC handbook of chemistry and physics. 88. CRC Press, Taylor & Francis; Boca Raton, FL: pp. 2007–2008. [Google Scholar]
- 21.Schepps JL, Foster KR. UHF and microwave dielectric properties of normal and tumour tissues: variation in dielectric properties with tissue water content. Phys Med Biol. 1980 Jun;25(6):1149–1159. doi: 10.1088/0031-9155/25/6/012. [DOI] [PubMed] [Google Scholar]
- 22.Sudo S, Shinyashiki N, Kitsuki Y, Yagihara S. Dielectric relaxation time and relaxation time distribution of alcohol-water mixtures. J Phys Chem A. 2002;106(3):458–464. [Google Scholar]
- 23.Sato T, Niwa H, Chiba A, Nozaki R. Dynamical structure of oligo (ethylene glycol) s-water solutions studied by time domain reflectometry. J Chem Phys. 1998 Oct;108(10):4138–4147. [Google Scholar]
- 24.Foster KR, Schwan HP. Dielectric properties of tissues and biological materials: a critical review. Crit Rev Biomed Eng. 1989;17:25–104. [PubMed] [Google Scholar]
- 25.Shinyashiki N, Sudo S, Abe W, Yagihara S. Shape of dielectric relaxation curves of ethylene glycol oligomer-water mixtures. J Chem Phys. 1998 Dec;109(22):9843–9847. [Google Scholar]
- 26.Sudo S, Shimomura M, Shinyashiki N, Yagihara S. Broadband dielectric study of α-β separation for supercooled glycerol-water mixtures. J Non-Cryst Solids. 2002 Sep;307–310:356–363. [Google Scholar]
- 27.Matsuoka S. Entropy, free volume, and cooperative relaxation. J Res Natl Inst Stan. 1997 Mar-Apr;102(2):213–228. doi: 10.6028/jres.102.017. [DOI] [PMC free article] [PubMed] [Google Scholar]
- 28.Meaney PM, Fanning MW, Raynolds T, Fox CJ, Fang Q, Kogel CA, Poplack SP, Paulsen KD. Initial clinical experience with microwave breast imaging in women with normal mammography. Acad Radiol. 2007 Feb;14(2):207–218. doi: 10.1016/j.acra.2006.10.016. [DOI] [PMC free article] [PubMed] [Google Scholar]
- 29.Meaney PM, Golnabi AH, Epstein NR, Geimer SD, Fanning MW, Paulsen KD. Integration of a microwave tomographic imaging system with MR for improved breast imaging. Med Phys. 2013 Sep;40(10):103101-1–103101-13. doi: 10.1118/1.4820361. [DOI] [PMC free article] [PubMed] [Google Scholar]
- 30.Grzegorczyk TM, Meaney PM, Kaufman PA, diFlorio-Alexander RM, Paulsen KD. Fast 3-D tomographic microwave imaging for breast cancer detection. IEEE Trans Med Imag. 2012 Aug;31(8):1584–1592. doi: 10.1109/TMI.2012.2197218. [DOI] [PMC free article] [PubMed] [Google Scholar]
- 31.Meaney PM, Fang Q, Rubaek T, Demidenko E, Paulsen KD. Log transformation benefits parameter estimation in microwave tomographic imaging. Med Phys. 2007 Jun;34(6):2014–2023. doi: 10.1118/1.2737264. [DOI] [PubMed] [Google Scholar]
- 32.Meaney PM, Paulsen KD, Pogue BW, Miga MI. Microwave image reconstruction utilizing log-magnitude and unwrapped phase to improve high-contrast object recovery. IEEE Trans Med Imag. 2001 Feb;20(2):104–116. doi: 10.1109/42.913177. [DOI] [PubMed] [Google Scholar]
- 33.Fang Q, Meaney PM, Paulsen KD. The multidimensional phase unwrapping integral and applications to microwave tomographical image reconstruction. IEEE Trans Image Process. 2006 Nov;15(11):3311–3324. doi: 10.1109/tip.2006.881999. [DOI] [PubMed] [Google Scholar]
- 34.Poplack SP, Paulsen KD, Hartov A, Meaney PM, Pogue BW, Tosteson TD, Grove M, Soho S, Wells W. Electromagnetic breast imaging: pilot results in women with abnormal mammography. Radiology. 2007 May;243(2):350–359. doi: 10.1148/radiol.2432060286. [DOI] [PubMed] [Google Scholar]
- 35.Meaney PM, Kaufman PA, Muffly LS, Click M, Wells WA, Schwartz GN, di Florio-Alexander RM, Tosteson TD, Li Z, Poplack SP, Geimer SD, Fanning MW, Zhou T, Epstein NR, Paulsen KD. Microwave imaging for neoadjuvant chemotherapy monitoring: initial clinical experience. Breast Cancer Research. 2013 Apr;15(2):1–16. doi: 10.1186/bcr3418. paper #35. [DOI] [PMC free article] [PubMed] [Google Scholar]
- 36.Meaney PM, Richter S, Geimer SD, Paulsen KD. Interplay between iteration step size and spatial filtering in microwave tomography. International Symposium on Antenna Technology and Applied Electromagnetics; Montreal, Canada. 2016. [Google Scholar]
- 37.Meaney PM, Paulsen KD, Geimer SD, Haider S, Fanning MW. Quantification of 3D field effects during 2D microwave imaging. IEEE Trans Biomed Eng. 2002 Jul;49(7):708–720. doi: 10.1109/TBME.2002.1010855. [DOI] [PubMed] [Google Scholar]
- 38.Kaatze U. Complex permittivity of water as a function of frequency and temperature. J Chem Eng Data. 1989 Apr;34(4):371–374. [Google Scholar]
- 39.Meaney PM, Pendergrass SA, Fanning MW, Li D, Paulsen KD. Importance of using a reduced contrast coupling medium in 2D microwave breast imaging. J Electromagnet Wave. 2003 Apr;17(2):333–355. [Google Scholar]


