



Abstract
Background
In SPRINT (Systolic blood PRessure INtervention Trial), patients with hypertension and high cardiovascular risk treated with intensive blood pressure (BP) control (< 120mmHg) had fewer major adverse cardiovascular events (MACE) and deaths, but higher rates of treatment-related serious adverse events (SAE), than patients randomized to standard BP control (<140mmHg). However, the degree of benefit or harm for an individual patient could vary due to heterogeneity in treatment effect.
Methods and Results
Using patient-level data from 9361 randomized patients in SPRINT, we developed models to predict risk for MACE or death and treatment-related SAE to allow for individualized BP treatment goals based on each patient’s projected risk and benefit of intensive vs. standard BP control. Models were internally validated using bootstrap resampling and externally validated on 4741 patients from the ACCORD-BP trial. Among 9361 SPRINT patients, 755 (8.1%) patients had a MACE or death event and 338 (3.6%) had a treatment-related SAE over a median follow-up of 3.3 years. The MACE/death and the SAE model had c-statistics of 0.72 and 0.70 respectively in the derivation cohort and 0.69 and 0.65 in ACCORD. The MACE/death model had 10 variables including treatment interactions with age, baseline SBP and DBP and the SAE model had 8 variables including treatment interaction with number of BP medications. Intensive BP treatment was associated with a mean 2.2% ± 2.6% lower risk of MACE/death compared with standard treatment (range = 20.7% lower risk to 19.6% greater risk among individual patients) and a mean 2.2% ± 1.2% higher risk for SAEs (range = 0.5% to 15.8% more harm in individual patients).
Conclusions
To translate the findings from SPRINT to clinical practice, we developed prediction models to tailor the intensity of BP control based on the projected risk and benefit for each unique patient. This approach should be prospectively tested to better engage patients in shared medical decision-making and to improve outcomes.
Keywords: hypertension, blood pressure treatment, risk prediction models
Although an estimated 68.5 million US adults have hypertension,1 the intensity of blood pressure (BP) control has been a subject of ongoing debate. The Systolic blood PRessure INtervention Trial (SPRINT) trial recently demonstrated a 25% relative (0.5% absolute annual) reduction in cardiovascular morbidity and mortality with intensive (<120 mmHg) as compared with standard (<140 mmHg) blood pressure control in patients with hypertension and high cardiovascular risk.2 Offsetting these impressive benefits was an 88% relative (0.7% absolute) increased risk per year for serious adverse events (SAE) attributed to treatment in the intensive strategy, including hypotension, syncope, electrolyte abnormalities, and acute kidney injury. Importantly, however, these results represent the average differences in event rates for the entire population and may not apply to individual patients whose risks and benefits vary based on their unique clinical characteristics. Congruent with prior calls in the literature,3, 4 what is needed is a strategy to translate the results of clinical trials into tools that can predict clinical outcomes for individual patients and support personalized treatment recommendations.
To better inform the decision between choosing an intensive or standard blood pressure (BP) control strategy, we leveraged data from the SPRINT trial to develop risk prediction models for major adverse cardiovascular events (MACE) or death and any treatment-related SAEs, as a function of alternative BP strategies. Not only could these models better translate the SPRINT results into clinical practice by describing the range of benefits and risks with each BP treatment strategy across the population, they could also estimate the benefits and risks for individual patients and serve as tools for patient engagement and shared decision making.4
Methods
Study Cohort
Details of the SPRINT study have been described.2, 5 Briefly, SPRINT was a multi-center, randomized trial comparing intensive (target systolic BP (SBP) <120 mmHg) versus standard (target SBP <140 mmHg) BP control strategies in 9361 patients aged ≥50 years with hypertension at high cardiovascular risk. High cardiovascular risk was defined as one or more of the following: clinical or subclinical cardiovascular disease, chronic kidney disease, 10-year risk of cardiovascular disease of 15% or greater (per Framingham risk score), or age ≥75 years. Key exclusion criteria included a diagnosis of diabetes, prior stroke, systolic heart failure (ejection fraction <35%), or end-stage renal disease. All patients provided written informed consent for baseline and follow-up assessment, and the study was approved by Institutional Review Boards at each participating site. The trial was stopped early, after a median follow-up of 3.26 years, based on statistically significant and clinically relevant benefits from intensive treatment.2 Access to the patient-level data was obtained through National Heart, Lung and Blood Institute BioLINCC data repository (https://biolincc.nhlbi.nih.gov/studies/sprint_pop/) after approval from the Institutional Review Board at Saint Luke’s Hospital.
Outcomes
For the present analysis, we constructed 2 models, one modeling the risk of MACE or death and the other modeling the risk of treatment-related SAEs for intensive compared with standard BP treatment. Our outcome for the MACE/death model was a composite outcome of all-cause death or MACE, which included myocardial infarction, acute coronary syndrome, stroke, or acute decompensated heart failure. Treatment-related SAEs were defined as events that were fatal or life-threatening, resulted in clinically significant or persistent disability, required or prolonged a hospitalization, or were judged by the investigator to represent a clinically significant hazard or harm to the participant. We chose to focus upon treatment-related adverse events as these were determined by the study leadership to represent the negative consequences of pursing a more aggressive treatment strategy and were deemed to be most relevant to the decision facing patients who are considering alternative intensities of BP control. All SAEs were reviewed by the trial safety officer to assess whether or not it was related to treatment, which was further reviewed monthly by the safety committee. An independent adjudication committee, blinded to the treatment assignment, adjudicated each component of these endpoints.2
Statistical analyses
Baseline demographic, comorbidity, laboratory, and other clinical data were compared between patients with versus without MACE/death and those with versus without treatment-related SAE. Continuous variables were compared using Student’s t-test and categorical variables were compared using chi-square tests.
Model construction
We developed separate models using logistic regression to estimate patients’ probability of MACE/death and treatment-related SAEs. We excluded patients with any missing data (n=486 [5.25%] for the MACE/death model and n=538 [5.6%] for the SAE model). The highest missing rate was for urine albumin/creatinine ratio (n=448, 4.8%). Candidate variables were selected a priori on the basis of published literature and clinical experience and included only variables available at the time of randomization (Online Data Supplement Table 1). Given the purpose of these models to project the outcomes with either treatment strategy, we specifically examined interactions between each candidate variable and treatment assignment. Then, to increase the feasibility of using these models in routine clinical care, Harrell’s backward selection strategy was used to select parsimonious sets of variables for both models.6 We started with full models that included all pre-specified candidate variables and interactions. We calculated the predicted outcome (on the linear predictor scale) for each patient. We then fit a linear model predicting these predicted outcomes on the basis of all model terms; by construction the R2 for this model is 100%. We then ranked all variables by F-value within this model, and removed variables sequentially until removing another variable would reduce the R2 below 95%. With this approach, the reduced model accounts for >95% of the variability in predicted values from the full model (Online Data Supplement Figures 1 and 2). Ultimately, we retained 10 variables in the reduced MACE/death model and 8 variables in the SAE model, which accounted for > 95% of the predictive capacity of the full models, respectively. All continuous effects were assessed for linearity using LOESS plots, no significant nonlinearity was found in the final model. Model discrimination was assessed with c-statistics.
Internal model validation
Both the MACE/death and SAE models were internally validated using bootstrap resampling for 200 replications.7, 8 For each step of resampling, the model was refit as described above, and performance (calibration slope and c-statistic) was assessed on the bootstrapped data and “validated” on the original dataset. The difference in performance between the two data sets was calculated and averaged over the 200 replications. The average differences estimates due to overfitting were then subtracted from the final reported performance of the full and reduced models.
External validation
Both the risk models were externally validated within the BP arm of the ACCORD trial, conducted from January 2003 through June 2009.9 The trial enrolled 4741 patients with diabetes at high cardiovascular risk, randomized to receive intensive (< 120mmHg) vs. standard BP (<140mmHg) treatment, followed over a mean duration of 4.7 years. Important differences in the derivation and validation cohorts included the following: All patients in ACCORD had diabetes, as compared with none in SPRINT; ACCORD included patients with a history of stroke and congestive heart failure, all of whom were excluded from the SPRINT trial; patients with chronic kidney disease and eGFR between 20–60 ml/min/m2 were included in SPRINT, whereas patients with serum creatinine >1.5 mg/dL were excluded from the ACCORD trial. There were also important differences in the definition of outcomes between the 2 trials. The primary outcome for validation of MACE/death model included a combination of the primary and secondary endpoints to ensure comparability with the endpoints used in the SPRINT risk prediction model: non fatal MI, non fatal stroke, CHF hospitalization and all-cause death. Importantly, ACCORD did not include non-MI acute coronary syndrome and ER visits related to CHF in their primary endpoints, while SPRINT did. Similarly, the outcome for SAE model was anti-hypertensive treatment-related serious adverse events. Using data from the BP arm of the ACCORD trial, we validated our MACE/death and SAE models by calculating c-statistics and plotting calibration curves after applying the risk prediction equations derived from the SPRINT trial. Because of differences in the event rates between ACCORD and SPRINT populations, we recalibrated the SPRINT prediction formulas by adjusting the intercepts to match the overall event rates in ACCORD.10 We then plotted the observed event rates in ACCORD within each decile of predicted risk using the recalibrated models. Recalibrating the intercept does not affect the risk associated with each factor or the model discrimination.
Access to the patient-level data for the ACCORD trial was obtained through National Heart, Lung and Blood Institute BioLINCC data repository (https://biolincc.nhlbi.nih.gov/studies/accord/) after approval from the Institutional Review Board at Saint Luke’s Hospital.
Describing Heterogeneity of Treatment Effect
To understand the degree of variability in SPRINT patients’ probabilities of MACE/death and SAE from the 2 alternative BP control strategies, we calculated each participant’s predicted probability of both outcomes (MACE/death and treatment-related SAE) twice, first assuming treatment with intensive BP control and second assuming treatment with standard BP control. We identified the range of predicted absolute risks of both outcomes between the 2 treatment strategies by calculating the difference in absolute risks of MACE or death and treatment-related SAE, respectively, for each SPRINT patient if treated with intensive and standard BP control. The distribution of absolute predicted risk of benefit (MACE/death) and harm (SAE) between intensive and standard BP control across the SPRINT population was presented graphically with histograms. All analyses were conducted using SAS version 9.4 and R version 3.3.1.11
Results
Study Cohort
Among 9361 patients enrolled in SPRINT, 755 (8.1%) patients had MACE or death (intensive BP control: 332/4678 [7.1%]; standard BP control 423/4683 [9.0%]), and 338 (3.6%) had a treatment-related SAE (intensive BP control: 220/4678 [4.7%]; standard BP control 118/4683 [2.5%]) over a median follow-up of 3.26 years. Patients who had MACE/death were more likely to be older, male, white, and current smokers; to have higher SBP but lower diastolic BP (DBP) at baseline, have clinical or subclinical cardiovascular disease, be on higher number of anti-hypertensive agents, higher 10-year Framingham cardiovascular risk, and poor renal function; and to be assigned to standard treatment arm (Table 1). Patients with a treatment-related SAE were more likely to be older; to have lower DBP, poor renal function, subclinical and clinical cardiovascular disease, be on higher number of anti-hypertensive agents and higher 10-year Framingham cardiovascular risk; and to be randomized to intensive BP treatment (Table 1).
Table 1.
Baseline characteristics of patients in the study population (N= 9361)
| Major Adverse Cardiovascular Events or Death, N (%) | Treatment related Serious Adverse Events N(%) |
|||||
|---|---|---|---|---|---|---|
| Yes N = 755 |
No N= 8606 |
p-value | Yes N=338 |
No N=9023 |
p-value | |
| Assigned to intensive BP arm | 332 (44.0%) | 4346 (50.5%) | < 0.001 | 220 (65.1%) | 4458 (49.4%) | < 0.001 |
| Age, Mean ± SD | 71.9 ± 10.0 | 67.6 ± 9.3 | < 0.001 | 71.5 ± 9.6 | 67.8 ± 9.4 | < 0.001 |
| Male gender | 532 (70.5%) | 5497 (63.9%) | < 0.001 | 211 (62.4%) | 5818 (64.5%) | 0.438 |
| Black race | 201 (26.6%) | 2746 (31.9%) | 0.002 | 108 (32.0%) | 2839 (31.5%) | 0.849 |
| BMI (kg/m2), Mean ± SD | 29.3 ± 5.8 | 29.9 ± 5.8 | 0.009 | 29.4 ± 5.7 | 29.9 ± 5.8 | 0.169 |
| Systolic Blood Pressure (mm Hg), Mean ± SD | 141.3 ± 16.4 | 139.5 ± 15.5 | 0.002 | 141.1 ± 16.2 | 139.6 ± 15.6 | 0.078 |
| Diastolic Blood Pressure (mm Hg), Mean ± SD | 75.9 ± 12.9 | 78.3 ± 11.8 | < 0.001 | 76.0 ± 12.2 | 78.2 ± 11.9 | < 0.001 |
| Current smoker | 132 (17.6%) | 1108 (12.9%) | < 0.001 | 53 (15.7%) | 1187 (13.2%) | 0.185 |
| Serum creatinine (mg/dL), Mean ± SD | 1.2 ± 0.5 | 1.1 ± 0.3 | < 0.001 | 1.2 ± 0.4 | 1.1 ± 0.3 | < 0.001 |
| eGFR MDRD (mL/min/1.73m2), Mean ± SD | 65.7 ± 22.8 | 72.3 ± 20.3 | < 0.001 | 63.2 ± 20.5 | 72.1 ± 20.5 | < 0.001 |
| Urine Albumin/Creatinine ratio (mg/gCr), Median (IQR) | 17.0 (7.8,53.5) | 9.2 (5.5,19.8) | < 0.001 | 13.7 (6.7, 41.6) | 9.4 (5.6, 21.0) | < 0.001 |
| History of clinical CVD | 244 (32.3%) | 1318 (15.3%) | < 0.001 | 77 (22.8%) | 1485 (16.5%) | 0.002 |
| History of subclinical CVD | 55 (7.3%) | 438 (5.1%) | 0.009 | 26 (7.7%) | 467 (5.2%) | 0.041 |
| 10-year CVD risk (Framingham equation), Mean ± SD | 24.9 ± 13.2 | 19.7 ± 10.5 | < 0.001 | 21.9 ± 12.2 | 20.0 ± 10.8 | 0.001 |
| Total Cholesterol (mg/dL), Mean ± SD | 185.6 ± 43.0 | 190.5 ± 41.0 | 0.001 | 187.0 ± 43.5 | 190.2 ± 41.1 | 0.151 |
| HDL-cholesterol (mg/dL), Mean ± SD | 51.5 ± 14.7 | 53.0 ± 14.4 | 0.006 | 55.5 ± 16.0 | 52.8 ± 14.4 | < 0.001 |
| Fasting Triglycerides (mg/dL), Mean ± SD | 130.7 ± 76.7 | 125.5 ± 91.6 | 0.131 | 116.3 ± 58.4 | 126.3 ± 91.5 | 0.046 |
| Fasting Plasma Glucose (mg/dL), Mean ± SD | 99.2 ± 13.5 | 98.8 ± 13.6 | 0.393 | 99.3 ± 14.0 | 98.8 ± 13.5 | 0.534 |
| Statin Use | 379 (50.5%) | 3675 (43.1%) | < 0.001 | 165 (49.4%) | 3889 (43.4%) | 0.031 |
| Daily Aspirin Use | 443 (58.8%) | 4313 (50.3%) | < 0.001 | 204 (60.4%) | 4552 (50.6%) | < 0.001 |
| Number of anti-hypertensive agents | 2.0 ± 1.1 | 1.8 ± 1.0 | < 0.001 | 2.2 ± 1.0 | 1.8 ± 1.0 | < 0.001 |
Abbreviations: BMI= body mass index; eGFR MDRD= Glomerular filtration rate calculated using Modification of Diet in Renal Disease study equation; CVD= cardiovascular disease, clinical CVD includes one or more of myocardial infarction, acute coronary syndrome, > 50% coronary/carotid/peripheral artery stenosis or revascularization; or abdominal aortic aneurysm ≥5 mm; subclinical CVD includes one or more of coronary artery calcium score ≥400, ankle-brachial index ≤0.90, or left ventricular hypertrophy.
Risk Prediction Models
The prediction models for MACE/death and treatment-related SAE are shown in Figures 1 and 2 and Online Data Supplement Tables 2, 3, 4 and 5 respectively. The final model for MACE/death included 13 covariates and interactions of treatment with age, baseline SBP, and baseline diastolic BP. There was noted to be a lower risk of MACE or death from intensive BP treatment in patients with increasing age and higher baseline DBP. However, intensive BP treatment was noted to have a higher risk of MACE or death compared with standard BP treatment in patients with higher baseline SBP. The parsimonious prediction model for treatment-related SAE included 9 covariates and interaction of treatment with number of antihypertensive agents. Older age, current smoking, higher creatinine, higher urine albumin/creatinine ratio, and increasing number of anti-hypertensive medications at baseline were in both the MACE/death and SAE models and were associated with both higher MACE/death rates and greater SAEs with both treatment strategies. The c-statistics were similar after internal bootstrap validation (c-statistic=0.72 for MACE/death model and 0.70 for the SAE model). Both models showed good calibration when observed vs. predicted risks for the outcomes were plotted (Online Data Supplement Figures 3 and 4). The MACE/death model had an intercept of −0.05 and slope of 0.98. The SAE model had an intercept of −0.14 and slope of 0.95. The SAE model over-predicted risks above 12%, however there were very few patients (n=171, 1.8%) in that category.
Figure 1.

Risk prediction model for major adverse cardiovascular events or death in patients with hypertension at high cardiovascular risk; with intensive compared to standard blood pressure control strategy. Odds Ratios (OR) are presented separately for treatment with intensive and standard blood pressure control for variables with significant interaction with blood pressure treatment strategy. MACE includes composite of myocardial infarction, acute coronary syndrome, stroke, or acute decompensated heart failure. BP= blood pressure; CVD= cardiovascular disease; clinical CVD includes one or more of MI, ACS, > 50% coronary/carotid/peripheral stenosis or revascularization or AAA ≥5 cm.
Figure 2.
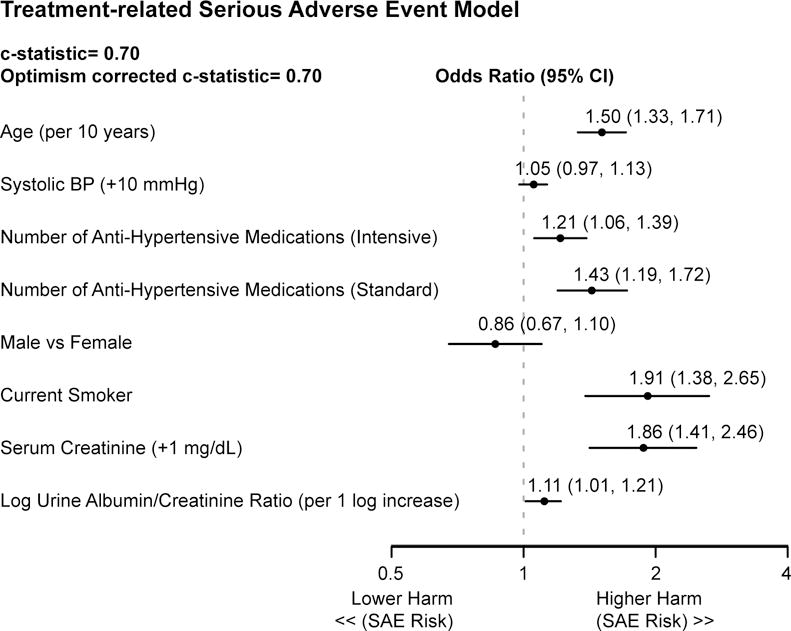
Risk prediction model for Treatment-related Serious Adverse Event in patients with hypertension at high cardiovascular risk; with intensive compared to standard blood pressure control strategy. Treatment –related serious adverse events were side effects believed to be secondary to treatment, assessed by the trial safety officer and reviewed monthly by the safety committee. BP= blood pressure
External Validation
The BP arm of ACCORD trial included 4741 diabetic patients at high cardiovascular risk (mean age 62.2 years, 52.3% male, 33.7% with CVD at baseline) followed for mean duration of 4.7 years. Among patients randomized to intensive BP treatment, 333/2368 (14.1%, 3%/year) had MACE/death and 90/2368 (3.8%) had a SAE. Among patients randomized to standard BP treatment in ACCORD, 367/2373 (15.5%, 3.3%/year) had MACE/death and 41/2373 (1.7%) had a SAE. In this cohort, the MACE/death and SAE model showed modestly reduced discrimination with c-statistics of 0.69 and 0.65 respectively. After re-calibration to the baseline event rates, both models showed good calibration (Online Data Supplement Figures 5 and 6). The MACE/death model had an intercept of 0.03 and a slope of 0.82; R2 = 96.7%, with slightly higher predicted than observed rates in only the highest decile of risk. The SAE model had an intercept of 0.002 and slope of 0.93; R2=88%.
Predicted Benefit, Harm and Heterogeneity of Treatment Effect
The mean predicted absolute reduction in risk of MACE/death with intensive BP treatment was of 2.2% ± 2.6% (median 1.6%; IQR 0.7%–3.1%) compared with standard treatment but ranged from 20.7% lower risk to 19.6% greater risk in individual patients (Figure 3 and Online Data Supplement Figure 7). The mean predicted absolute rate for treatment-related SAEs with intensive treatment was 2.2% ± 1.2% (median 1.9%; IQR 1.4%–2.7%), but ranged from 0.5% to 15.8% higher compared with standard treatment (Figure 3 and Online Data Supplement Figure 7). Online Data Supplement Figure 7 graphically represents each SPRINT patient’s predicted absolute risk of MACE or death on the y-axis against each patient’s predicted absolute harm with intensive compared to standard treatment on the x- axis. Overall, 43% of all SPRINT patients would be benefit from receiving intensive BP treatment over standard treatment if they valued avoiding MACE/death as equal to a treatment-related SAE, but this proportion increases if avoiding MACE/death was valued by a given patient as more important than avoiding a treatment-related SAE.(Online Data Supplement Figure 7).
Figure 3.
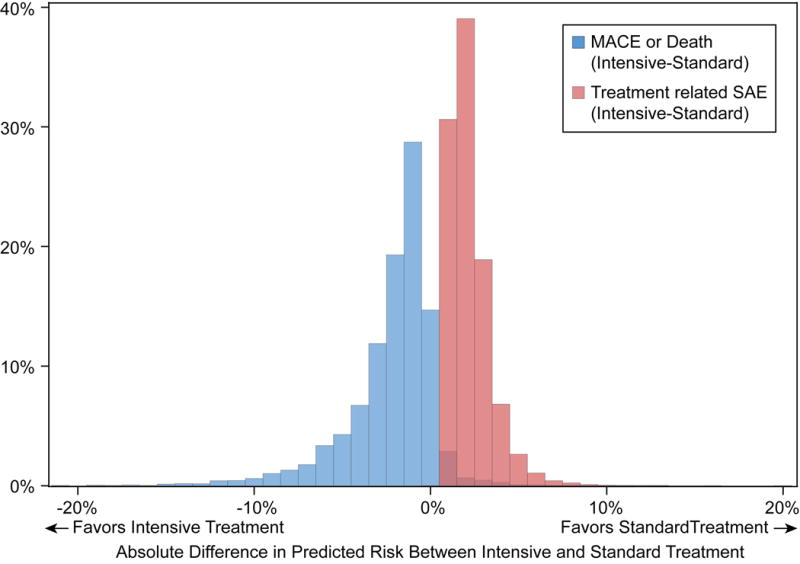
Distribution of the absolute risk difference between treatment with intensive and standard blood pressure control. Histograms demonstrating distribution of difference in risk of Major Adverse Cardiovascular Events or death (predicted probability of event treated with intensive minus predicted probability of event treated with standard blood pressure control) and difference in absolute risk of Treatment related Serious Adverse Event (SAE); (predicted probability of SAE with intensive treatment minus predicted probability of SAE with standard blood pressure control) across Systolic blood PRessure INtervention Trial (SPRINT) population.
Discussion
Translating landmark clinical trials to clinical practice has been a pressing challenge for the medical profession. While guidelines and performance measures have been the primary strategies, these have failed to insure that the Institute of Medicine’s goals for effective, safe, patient-centered care have been achieved.12, 13 An important and underused strategy to accelerate the translation of clinical trials to practice is to build models of the heterogeneity of treatment benefit in order to personalize evidence-based treatment.3, 4 The decision to treat BP aggressively is complex, with trade-offs in reduction in cardiovascular morbidity and mortality but more SAEs.2 Given these trade-offs, the SPRINT trial represents an ideal place in which to model these potential benefits and harms of intensive vs. standard BP control treatment strategies. In this study, we modeled the heterogeneity in treatment effect for both benefit and harm in SPRINT and found marked variability in the benefits of intensive BP control (range of 20% worse outcomes to 21% better outcomes) and harm (range from 0.5% to 16%), based upon patient characteristics. Application of these models could potentially be used to translate the findings of the SPRINT trial to support clinicians and patients selecting a treatment strategy based upon the patient’s specific risk factors, thereby targeting treatment to those most likely to benefit and minimizing potential risk.
A recent study using NHANES data estimated that a total of 16.8 million US patients with hypertension would potentially be eligible for intensive BP treatment according to the major eligibility criteria of SPRINT.1 Given the additional clinical burden of intensive BP treatment (e.g., more clinic visits, more medications) and the potential for SAEs,2 understanding who is estimated to benefit the most from intensive BP treatment could be exceptionally helpful to both clinicians and patients. In particular, these models may be of most benefit to patients with SBP in the gray zone between 130–139 mmHg, who are currently being treated with lifestyle changes according to the guidelines14 and account for 34.8% of all patients with hypertension in the US.1 Use of models, such as these, to personalize treatment to patients based on their unique characteristics has the ability to target treatment to those most likely to benefit, to minimize treatment-related SAEs, and ultimately to optimize patient outcomes. Moreover, directly estimating each patient’s benefits and risks may better engage patients in their treatment decision, which could potentially improve treatment adherence.15, 16
Importantly, both the models performed well on external validation in the ACCORD trial participants, who differed substantially from those in the SPRINT trial by all having diabetes and 6.5% and 4.3% having had a history of stroke and congestive heart failure, respectively. The ACCORD patients also had different rates of adverse events and there were slight differences in how these outcomes were classified (stricter definitions of endpoints in ACCORD that did not include non-MI acute coronary syndrome or ER visits due to CHF). Nevertheless, the model performed very well in this distinct cohort of patients, although the MACE/death model slightly overpredicted risk in the highest risk decile. Finding comparable performance in a cohort of patients with vastly different baseline characteristics strongly supports the external generalizability of the SPRINT models that we created.
We noted a number of interesting observations among the studied population that highlight the potential advantages of precision medicine over contemporary strategies of simple univariate classification. For example, older patients have traditionally been considered to not be candidates for more intensive BP control. For example, the most recent BP management guideline has recommended higher BP goals (<150/90 mmHg) in patients ≥60 years as compared with younger patients (<140/90 mmHg) to limit the risk of harm in older patients.14 We found a significant treatment interaction with age in our model for MACE/death, suggesting that older patients were more likely to benefit from intensive BP treatment, possibly due to them being at increased cardiovascular risk. In contrast, although we found that while older patients were more likely to have SAEs, these were not greater in those with more intensive BP control, as there was no significant treatment interaction of age with SAE. While a higher BP goal may be appropriate for some patients at advanced age, our results suggest that many of these patients may benefit from intensive treatment.
The interaction of BP treatment with patient’s baseline SBP, suggesting higher risk of MACE or death with intensive treatment in patients with higher baseline SBP may result from a larger morbidity/mortality reduction with standard BP treatment (e.g., in a patient with a baseline SBP of 180 mmHg, a reduction of 40 mmHg [standard treatment] would result in a large risk reduction and may dilute the comparison of a reduction of 60 mmHg [intensive treatment]) or might be due to difficulty in achieving intensive goal BP in these patients (i.e., difficult to get to 60 mmHg reduction). The treatment interaction of BP treatment with baseline DBP, suggesting higher risk of MACE events or death with intensive BP treatment in patients with lower baseline diastolic BP, may be explained by a previously demonstrated J-curve shaped association between diastolic BP and cardiac events and all-cause mortality, especially in patients at high risk or with known coronary artery disease.17–19 Intensive BP treatment in patients with lower baseline DBP could possibly result in very low diastolic BPs that subsequently increase patients’ risk of ischemia and death.20 Our risk prediction models can enable providers to integrate age and BP, along with multiple other risk factors, to estimate patients’ risks and benefits directly without using coarse, single-variable associations to define optimal treatment.
Our findings should be interpreted in the context of several potential limitations. As we were limited to analyzing the publicly released data, particular data elements that might be prognostically important, such as type of clinical cardiovascular disease, were not available for consideration in our models. Factors that influence medication adherence, such as socioeconomic factors, social support and depression could also potentially alter the effectiveness of intensive BP treatment and the endpoint of MACE/death. Similarly, other factors, such as frailty and specific drug classes, could also affect treatment-related SAEs. However, none of these characteristics were available and could not be used for model development. It must also be acknowledged that patients enrolled in clinical trials are generally healthier, more compliant with treatments, and better monitored for safety than patients in the real world.21 Furthermore the BPs achieved in SPRINT were under ideal trial conditions with close follow-up.22 As such, whether or not real-life practice could result in similar benefits or harms as those predicted by SPRINT will need to be tested in future studies.22 We used combined outcomes for both assessment of benefit and harm. Patients may value preventing death differently than preventing heart failure, MI or stroke; however we felt that all these outcomes are clinically important outcomes for prevention. Additionally, we chose to present the patients and clinicians with individualized risk estimates for MACE/death and SAE with different BP treatment strategies and have them make a decision regarding the choice of therapy based on their own preferences and goals, rather than making fixed assumptions regarding how they should weigh the risks vs. benefits with each strategy and providing a single treatment recommendation. Also, while we did find evidence of some treatment interactions suggesting heterogeneity in treatment effect, there might be other interactions which we did not have the power to detect.23
In conclusion, using data from a large clinical trial of patients with hypertension and high cardiovascular risk, we developed risk models that estimate a specific patient’s personal risk of benefit and harm with intensive or standard BP control. These models represent an important step forward in the field of precision medicine by enabling the results of a landmark clinical trial to be used in routine patient care to tailor the treatment approach based on the projected risk and benefit for each unique patient. Involving patients prospectively in clinical decision making using individualized risk estimates could also potentially help improve treatment adherence and outcomes. Further studies are needed to understand the clinical impact of using these models in care and defining how these models perform in low-risk, younger patients with hypertension.
Supplementary Material
WHAT IS KNOWN
The SPRINT trial suggests that, on average, hypertensive patient at high cardiovascular risk would have less cardiovascular morbidity and mortality, but higher treatment-related adverse events, with an intensive blood pressure treatment strategy as compared with a standard blood pressure treatment strategy.
Applying these population-level results to individual patients is challenging, as each patient may have different benefits and risks than the average patient in SPRINT.
WHAT THIS STUDY ADDS
Using patient-level data from SPRINT, we developed risk prediction models that estimate an individual patient’s risk of major adverse cardiovascular events or death and treatment related serious adverse events with intensive or standard BP control.
Application of these models could potentially be used to support clinicians and patients in selecting a treatment strategy based upon the patient’s specific risk factors and treatment preferences, thereby targeting treatment to those most likely to benefit and minimizing potential risk.
Acknowledgments
Sources of Funding: Drs. Patel and Pokharel are supported by the National Heart, Lung, And Blood Institute of the National Institutes of Health under Award Number T32HL110837. Dr. Chan is supported by funding (R01HL123980) from the National Heart Lung and Blood Institute. The content is solely the responsibility of the authors and does not necessarily represent the official views of the National Institutes of Health.
Footnotes
Journal Subject Terms: Hypertension
Clinical Trial Registration
clinicaltrials.gov identifier NCT01206062
Disclosures: Dr. Chan serves as a consultant for Optum Rx (significant). Dr. Spertus serves as a consultant to United Healthcare, Bayer and Novartis (modest). He has research grants from Abbott Vascular, Novarits and is the PI of an analytic center for the American College of Cardiology (significant). He has an equity interest in Health Outcomes Sciences (significant). The other authors report no conflicts.
References
- 1.Bress AP. Generalizability of SPRINT Results to the U.S. Adult Population. J Am Coll Cardiol. 2016;67:463–472. doi: 10.1016/j.jacc.2015.10.037. [DOI] [PMC free article] [PubMed] [Google Scholar]
- 2.Wright JT, Jr, Williamson JD, Whelton PK, Snyder JK, Sink KM, Rocco MV, Reboussin DM, Rahman M, Oparil S, Lewis CE, Kimmel PL, Johnson KC, Goff DC, Jr, Fine LJ, Cutler JA, Cushman WC, Cheung AK, Ambrosius WT. A Randomized Trial of Intensive versus Standard Blood-Pressure Control. N Engl J Med. 2015;373:2103–16. doi: 10.1056/NEJMoa1511939. [DOI] [PMC free article] [PubMed] [Google Scholar]
- 3.Hayward RA, Kent DM, Vijan S, Hofer TP. Multivariable risk prediction can greatly enhance the statistical power of clinical trial subgroup analysis. BMC Med Res Methodol. 2006;6:18. doi: 10.1186/1471-2288-6-18. [DOI] [PMC free article] [PubMed] [Google Scholar]
- 4.Kent DM, Rothwell PM, Ioannidis JP, Altman DG, Hayward RA. Assessing and reporting heterogeneity in treatment effects in clinical trials: a proposal. Trials. 2010;11:85. doi: 10.1186/1745-6215-11-85. [DOI] [PMC free article] [PubMed] [Google Scholar]
- 5.Ambrosius WT, Sink KM, Foy CG, Berlowitz DR, Cheung AK, Cushman WC, Fine LJ, Goff DC, Jr, Johnson KC, Killeen AA, Lewis CE, Oparil S, Reboussin DM, Rocco MV, Snyder JK, Williamson JD, Wright JT, Jr, Whelton PK. The design and rationale of a multicenter clinical trial comparing two strategies for control of systolic blood pressure: the Systolic Blood Pressure Intervention Trial (SPRINT) Clin Trials. 2014;11:532–46. doi: 10.1177/1740774514537404. [DOI] [PMC free article] [PubMed] [Google Scholar]
- 6.Harrell FE. Regression modeling strategies, with applications to linear models, survival analysis and logistic regression. Springer; 2001. [Google Scholar]
- 7.Kohavi R. A study of cross-validation and bootstrap for accuracy estimation and model selection. International Joint Conference on Artificial Intelligence. 1995;14:1137–1145. [Google Scholar]
- 8.Steyerberg EW, Harrell FE, Borsboom GJ, Eijkemans M, Vergouwe Y, Habbema JDF. Internal validation of predictive models: efficiency of some procedures for logistic regression analysis. J Clin Epidemiol. 2001;54:774–781. doi: 10.1016/s0895-4356(01)00341-9. [DOI] [PubMed] [Google Scholar]
- 9.Group TAS. Effects of Intensive Blood-Pressure Control in Type 2 Diabetes Mellitus. N Engl J Med. 2010;362:1575–1585. doi: 10.1056/NEJMoa1001286. [DOI] [PMC free article] [PubMed] [Google Scholar]
- 10.Steyerberg E. Clinical prediction models: a practical approach to development, validation, and updating. Springer Science & Business Media; 2008. [Google Scholar]
- 11.Team RC. R: A language and environment for statistical computing. R Foundation for Statistical Computing; Vienna, Austria: 2014. 2013. [Google Scholar]
- 12.Tricoci P, Allen JM, Kramer JM, Califf RM, Smith SC. Scientific evidence underlying the acc/aha clinical practice guidelines. JAMA. 2009;301:831–841. doi: 10.1001/jama.2009.205. [DOI] [PubMed] [Google Scholar]
- 13.Richardson WC, Berwick DM, Bisgard J, Bristow L, Buck C, Cassel C. Institute of Medicine Crossing the quality chasm: a new health system for the 21st century. Washington, DC: National Academy Press; 2001. [Google Scholar]
- 14.James PA, Oparil S, Carter BL, Cushman WC, Dennison-Himmelfarb C, Handler J, Lackland DT, LeFevre ML, MacKenzie TD, Ogedegbe O, Smith SC, Jr, Svetkey LP, Taler SJ, Townsend RR, Wright JT, Jr, Narva AS, Ortiz E. 2014 evidence-based guideline for the management of high blood pressure in adults: report from the panel members appointed to the Eighth Joint National Committee (JNC 8) JAMA. 2014;311:507–20. doi: 10.1001/jama.2013.284427. [DOI] [PubMed] [Google Scholar]
- 15.Weymiller AJ, Montori VM, Jones LA, Gafni A, Guyatt GH, Bryant SC, Christianson TJ, Mullan RJ, Smith SA. Helping patients with type 2 diabetes mellitus make treatment decisions: statin choice randomized trial. Arch Intern Med. 2007;167:1076–82. doi: 10.1001/archinte.167.10.1076. [DOI] [PubMed] [Google Scholar]
- 16.Oshima Lee E, Emanuel EJ. Shared Decision Making to Improve Care and Reduce Costs. N Engl J Med. 2013;368:6–8. doi: 10.1056/NEJMp1209500. [DOI] [PubMed] [Google Scholar]
- 17.Messerli FH, Panjrath GS. The J-curve between blood Pressure and coronary artery disease or essential hypertension: exactly how essential? J Am Coll Cardiol. 2009;54:1827–1834. doi: 10.1016/j.jacc.2009.05.073. [DOI] [PubMed] [Google Scholar]
- 18.Boutitie F, Gueyffier F, Pocock S, Fagard R, Boissel JP. J-shaped relationship between blood pressure and mortality in hypertensive patients: new insights from a meta-analysis of individual-patient data. Ann Intern Med. 2002;136:438–48. doi: 10.7326/0003-4819-136-6-200203190-00007. [DOI] [PubMed] [Google Scholar]
- 19.Fagard RH, Staessen JA, Thijs L, Celis H, Bulpitt CJ, de Leeuw PW, Leonetti G, Tuomilehto J, Yodfat Y. On-treatment diastolic blood pressure and prognosis in systolic hypertension. Arch Intern Med. 2007;167:1884–1891. doi: 10.1001/archinte.167.17.1884. [DOI] [PubMed] [Google Scholar]
- 20.Hansson L, Zanchetti A, Carruthers SG, Dahlöf B, Elmfeldt D, Julius S, Ménard J, Rahn KH, Wedel H, Westerling S. Effects of intensive blood-pressure lowering and low-dose aspirin in patients with hypertension: principal results of the Hypertension Optimal Treatment (HOT) randomised trial. Lancet. 1998;351:1755–1762. doi: 10.1016/s0140-6736(98)04311-6. [DOI] [PubMed] [Google Scholar]
- 21.van Onzenoort HA, Menger FE, Neef C, Verberk WJ, Kroon AA, de Leeuw PW, van der Kuy PH. Participation in a clinical trial enhances adherence and persistence to treatment: a retrospective cohort study. Hypertension. 2011;58:573–8. doi: 10.1161/HYPERTENSIONAHA.111.171074. [DOI] [PubMed] [Google Scholar]
- 22.McCormick BB, Hiremath S, Ruzicka M. A Randomized Trial of Intensive versus Standard Blood-Pressure Control. N Engl J Med. 2016;374:2291–2292. doi: 10.1056/NEJMc1602668. [DOI] [PubMed] [Google Scholar]
- 23.Basu S, Sussman JB, Hayward RA. Detecting heterogeneous treatment effects to guide personalized blood pressure treatment: A modeling study of randomized clinical trials. Ann Intern Med. 2017 doi: 10.7326/M16-1756. [DOI] [PMC free article] [PubMed] [Google Scholar]
Associated Data
This section collects any data citations, data availability statements, or supplementary materials included in this article.