Abstract
This work demonstrates determination of lead (Pb) in surface water samples using a low-cost copper (Cu)-based electrochemical sensor. Heavy metals require careful monitoring due to their toxicity, yet current methods are too complex or bulky for point-of-care (POC) use. Electrochemistry offers a convenient alternative for metal determination, but the traditional electrodes, such as carbon or gold/platinum, are costly and difficult to microfabricate. Our Cu-based sensor features a low-cost electrode material – copper – that offers simple fabrication and competitive performance in electrochemical detection. For anodic stripping voltammetry (ASV) of Pb, our sensor shows 21 nM (4.4 ppb) limit of detection, resistance to interfering metals such as cadmium (Cd) and zinc (Zn), and stable response in natural water samples with minimum sample pretreatment. These results suggest this electrochemical sensor is suitable for environmental and potentially biological applications, where accurate and rapid, yet inexpensive on-site monitoring is necessary.
Keywords: Copper-based sensor, electrochemical sensor, determination of lead, anodic stripping voltammetry
Graphical Abstract
1. Introduction
The determination of trace heavy metals is important due to adverse impacts on the environment and human health. Lead (Pb) is one of the highly poisonous metals that affects human soft tissues and organs, causing cancer in kidneys, lung, or brain, and acts synergistically with other carcinogens.1 Blood lead levels of 10–15 μg/dL (483–724 nM) in newborns and very young infants result in cognitive and behavioral deficits.2–4 The sources of Pb exposure include mining, smelting, Pb-containing gasoline and Pb paint.5 It can enter the body through hand-to-mouth contact or through contaminated food or water. The World Health Organization (WHO) guideline for the safe limit for Pb in drinking water is 10 ppb (48 nM).6 The high toxicity and common occurrence of Pb necessitates the need for careful monitoring.
Conventional methods for Pb determination include atomic absorption spectroscopy (AAS)7 and inductively coupled plasma mass spectrometry (ICP-MS).8 While both of these methods provide accurate measurements in any matrices even as complex as serum or blood, they require expensive and bulky instrumentation and highly-trained operators. Furthermore, significant time delays due to shipping of samples to centralized labs make these approaches less desirable or even unsuitable for point-of-care use. Electrochemical techniques for determination of heavy metals require relatively simple instruments and allow for miniaturization. Although ion selective electrodes (ISEs) are useful for many ions, such as sodium and calcium, and are available for Pb, the most common commercial ISEs for Pb are not capable of determining samples in the single/low ppb range, with their working range in the ~0.2 ppm to thousands of ppm Pb.9–11 Particularly, anodic stripping voltammetry (ASV) is the most-commonly reported approach for the determination of heavy metals (Fig. 1a), and offers limit of detection (LOD) as low as 10−10 M,12 which is sufficiently low for monitoring most trace metals in a wide range of sample matrices.
Fig. 1.
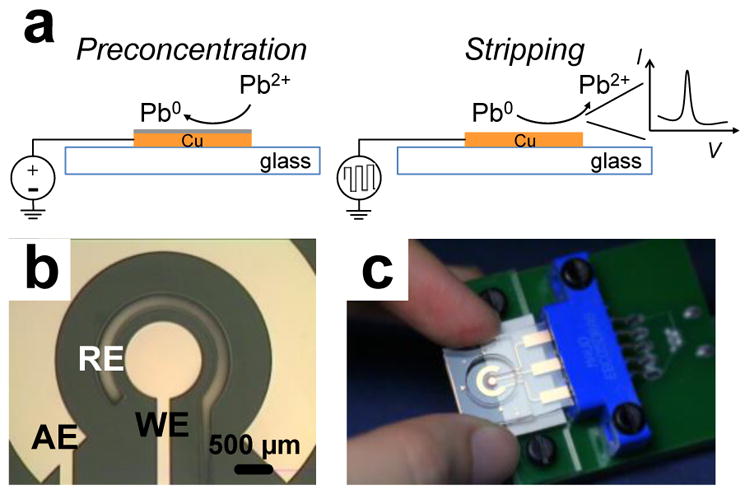
Schematics of the experiment theory and electrode configuration. (a) Illustration of ASV of Pb on Cu working electrode. (b) Close-up of the electrochemical cell, working electrode (WE), auxiliary electrode (AE), and reference electrode (RE). (c) Photograph of the sensor with an interface connecting to potentiostat.
Different types of electrodes have been reported for Pb determination using ASV, including mercury film,13 glassy carbon,13 screen printed carbon,14 graphite,15 bismuth-coated carbon,16 boron-doped diamond with or without antimony nanoparticle modification,17 and gold.18 Most of these electrodes can achieve ppb level of detection limit and the materials can be used to fabricate disposable microscale sensors for clinical or environmental applications. Several microscale sensors using different electrode materials such as carbon19 on paper and silver20 have also been reported for Pb detection with LOD < 1 ppb and sample volume of 100 μL or less. Our group21 has reported a microscale sensor with an electrodeposited bismuth film working electrode for multi-metal detection including Pb. For these disposable sensors, from the cost and fabrication perspectives, the gold or silver or carbon electrodes are not ideal.
In this paper, we demonstrate the use of sensors with a Cu working electrode for determination of Pb in environmental samples. Sensors with a Cu working electrode offer an attractive alternative in disposable sensor applications, as we22 and Xiong et al.23 discuss in recent publications. Cu is a commonly used material in electronics, is significantly lower in cost than gold or platinum, and is more compatible with microfabrication methods than carbon. For these reasons, we introduced an electrochemical sensor that consists of a Cu working electrode (WE), a Cu auxiliary electrode (AE), and a Cu/CuCl2 reference electrode (RE), fabricated in a single metal layer using a single photolithography step (Fig. 1b). The stability of these electrodes was investigated in detail in our previous work22, 24 and shows ability to perform measurements for at least 10 min, which is sufficient for disposable POC applications. Herein, by optimizing experimental parameters, our Cu-based sensor demonstrated a stable response with good sensitivity, strong linearity, and detection limits as low as 21 nM (4.4 ppb) for Pb without need for complex sample pretreatment.
2. Experimental Section
Reagents and microfabrication
Reagents used in this work and the fabrication procedures for the Cu-based sensor were the same as in our previous work22.
Electrochemical experiments
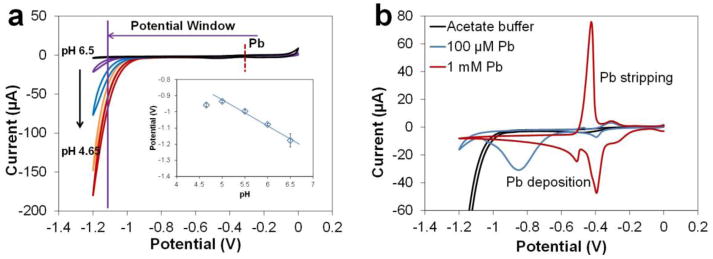
A miniature USB WaveNow Potentiostat/Galvanostat (AFTP1, Pine Instrument) with AfterMath Data Organizer software was used in all electrochemical experiments. A sensor was inserted into the interface and connected to the potentiostat using a mini USB cable (Fig. 1c). For all the experiments we used 100 μL as the sample volume. Cyclic voltammetry (CV) with scan rate of 100 mV/s was initially performed in acetate buffer (0.2 M, pH 4.65) with 1 mM Pb to determine the potential window of the Cu-based sensor for Pb detection and the position of the Pb stripping peak. ASV was performed in samples containing Pb of different concentrations in acetate buffer (0.2 M, pH 4.65). After a series of optimizations of preconcentration conditions and stripping waveform parameters, we selected −0.8 V as pre-concentration potential with 300 s time, stripping ranging from −0.8 V to 0 V, and waveform parameters of 50 mV, 50 ms, 8 mV for amplitude, period and increment, respectively. Calibration curves were constructed with 25 nM to10 μM Pb standards. For the calculation of detection limit, we repeated our lowest measurable data point – 25 nM of Pb – for 7× and obtained the standard deviation σ. We used the slope of the correlation equation and calculated the LOD as 3σ/slope. We used the method of standard addition to determine Pb in water samples with the same stripping parameters.
3. Results and Discussion
CV in acetate buffer
Performance of the Cu-based sensor for determination of Zn using ASV was discussed in detail in our previous work22. Thus we know that the Cu WE is capable of providing a suitable potential window for anodic stripping of Pb since the reduction potential for Pb is less negative than Zn. To confirm the position of the Pb stripping peak on a Cu WE, CV was performed in 0.2 M acetate buffers ranging in pH from 4.65 to 6.5. The background voltammograms for buffer at all pHs show a smooth background current from ca. 0 V to the cathodic limit where water begins to electrolyze (Fig. 2a). Addition of Pb2+ at two concentrations (100 μM and 1 mM) in the pH 5.5 buffer gives two stripping peaks for Pb as shown in the CV for pH 5.5 (Fig 2b). With the first Pb stripping peak appearing at −0.31 V vs. Cu/CuCl2, the Cu WE is able to provide a wide working window for Pb preconcentration since the negative potential limit of the Cu WE is −1.1 V (at 10 μA threshold current). The peak potential for this stripping peak is pH dependent as shown by the inset in Fig. 2a. This peak with similar amplitude (4.5 μA) could also be observed clearly when the concentration of Pb is as low as 100 μM. The second stripping peak at −0.42 V is a separate Pb peak due to high concentration where Pb has been deposited on a thin layer of Pb instead of directly on the Cu working electrode surface. The amplitudes of this peak correlate with the Pb concentrations, which are 0.8 μA and 75 μA for 100 μM and 1 mM Pb, respectively. This phenomenon is also observed in ASV analysis. After obtaining the potential window and positions of the deposition and stripping Pb peaks, we optimized ASV parameter for determination of Pb using the Cu-based sensors.
Fig. 2.
Characterization of the Cu electrode for Pb determination by CV. (a) Voltammograms in acetate buffer (0.2 M) with different pHs to demonstrate potential windows; the inset demonstrates the relationship between Pb stripping peak potential and variation in buffer pH. (b) CV of 100 μM and 1 mM Pb in acetate buffer (0.2 M, pH 5.5). Scan rate = 100 mV/s.
Optimization of ASV parameters
Before we constructed a calibration curve and determined the LOD of the Cu-based sensor for Pb detection, experimental parameters (buffer pH, preconcentration potential, preconcentration time and stripping waveform parameters) were optimized for good repeatability, maximum stripping peak current and peak sharpness. For all experiments, 100 μL samples containing 10 μM of Pb in acetate buffer (0.1 M) were used. For each parameter, experiments were performed in triplicate.
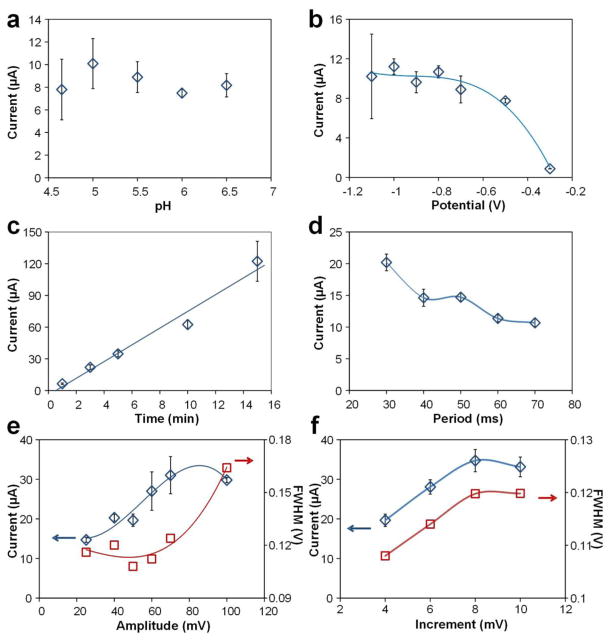
For pH optimization, ASV was performed in acetate buffers with pHs in the 4.65–6.5 range, the same as when we investigated potential windows for the Cu WE by CV. As results in Fig. 3a show, signal variability was significant for buffers with acidic pH, exhibiting coefficients of variation of 22% and 34% for pH 5 and 4.65, respectively. Less acidic acetate buffer provided more stable response, yet the peak currents were relatively small, exhibiting peak currents of 7.5 μA and 8.2 μA for pH 6 and 6.5, respectively. Voltammograms at pH 5.5 showed the second largest peak current of 8.9 μA with a coefficient of variation (C. V.) of 15%. Thus, pH 5.5 was selected for the following experiments.
Fig. 3.
Optimization of experimental parameters. (a) pH of acetate buffer, preconcentration (b) potential and (c) time, square wave (d) period, (e) amplitude and (f) increment. ASV performed in 10 μM Pb acetate buffer (0.2 M). The optimal parameters we selected are as follows: pH 5.5 acetate buffer, −0.8 V and 5 min for preconcentration, and 50 ms, 50 mV and 8 mV for period, amplitude and increment, respectively.
Preconcentration potential is a critical parameter for ASV, thus different potentials from −0.3 to −1.1 V were tested to select the most suitable value (Fig. 3b). With potentials more positive than −0.8 V, peak currents decreased from approximately 90% (at −0.7 V) to 8% (at −0.3 V) of the average peak current (10.4 μA) with potentials from −0.8 V to −1.1 V. With potentials of −0.8 V and more negative, the peak current levelled off at 10.4 ± 0.7 μA. When the potential was more negative than −0.8 V, the formation of hydrogen from H+ reduction reduced efficiency of deposition and affected repeatability of experiments, which brought a large variation in peak currents with coefficients as large as 42% at −1.1 V; thus, a less negative preconcentration potential is preferable for better precision. ASV with a preconcentration potential of −0.8 V provided a peak current of 10.7 μA with variation of 5.8%; thus, −0.8 V was selected as the optimal deposition potential.
Preconcentration time is another critical parameter for ASV as it directly influences the limit of detection of the sensors and the overall time of analysis. Preconcentration times in the 1–15 min range were investigated (Fig. 3c). In this range, peak current increased approximately linearly with deposition time with no evidence for saturation. However, the Cu-based sensor was obviously degraded with 15 min preconcentration time that resulted in a large variation of peak currents with a coefficient of 15%. We selected a preconcentration time of 5 min. While 10 min deposition yielded a higher current signal (Fig. 3c), the variability was still too high.
For real-world applications, there are trade-offs between shorter preconcentration time (faster process) and lower LOD. The threshold preconcentration time for our Cu-based sensor is ~10 min for most ASV (current below 10 μA) which is limited by deterioration of the Cu AE. If more robust electrodes are needed for applications with longer preconcentration time for lower LOD or in more acidic electrolyte, we can deposit a thicker layer of Cu for the AE, design a larger AE or deposit another layer of noble metal on top of the AE. Overall, we selected pH 5.5 acetate buffer of 100 μL, −0.8 V and 5 min for the preconcentration step of Pb ASV.
The waveform parameters for the stripping step were also optimized as shown in Fig. 3d–f. By decreasing the period and increasing amplitude and increment of the square wave, the peak current kept increasing. However, the purpose of optimization was not only to increase peak current which represents high sensitivity, but also to obtain sharp peaks for the accurate measurement of different metals in mixtures, and to reduce the device-to-device variation to obtain low LOD. Therefore, another characteristic - full width at half maximum (FWHM) - was considered as a secondary factor to distinguish peak sharpness straightforwardly and select the proper parameters. The larger FWHM indicates the peak begins to lose its resolution even though its peak current is increasing, which makes it challenging to quantify certain metals if their peaks overlap. Therefore, instead of using extreme parameters for the square wave just to increase the peak amplitude, we carefully optimized the values to achieve sharp peak for better resolution. We selected 50 ms, 50 mV and 8 mV for period, amplitude and increment values, respectively. Overall, the resulting signal current was amplified from 8 μA when using default parameters of 70 ms, 25 mV and 4 mV, respectively, to 35 μA for the optimized values.
Effect of deoxygenation
For Pb concentrations below 0.5 μM, we observed a constant 1.6-μA peak at −0.36 V (Fig. 4). Our immediate concern was a potential contamination of Pb from buffer solutions. However, after testing the commercial buffer with ICP-MS, we found that it contained <0.2 μg/L (ppb) Pb which can be considered as Pb-free in our application. The peak was unaffected by acid cleaning of the sensor using hydrochloric acid prior to the experiments, ruling out contamination from the surface or in the bulk of the electrodes. We also examined the experimental factors related to the sensor and stripping waveform (including AE and RE, buffer ion strength, preconcentration parameters, square wave waveform parameters), and were able to rule them all out as they showed little influence on the peak. Thus, we concluded that the peak arises mainly from the WE or electrolyte composition.
Fig. 4.
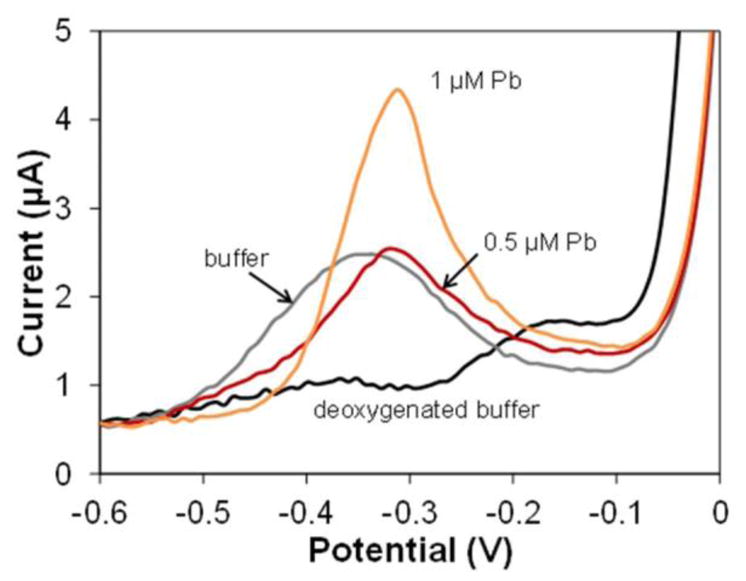
ASV of acetate buffer background (0.2 M, pH 5.5) before (grey) and after (black) de-oxygenating. The peak amplitudes are compared with deoxygenated 0.5 and 1 μM Pb.
During pH optimization we found that buffer pH affected the shape and size of the peak. We observed a huge 25 μA peak at −0.2 V in borate buffer with basic pH, while in acetate buffer with more acidic pH or nitric acid, the peak shrunk or disappeared. This observation led us to suspect that the peak was related to oxygen since the solutions were not deoxygenated. We found that deoxygenating buffer before experiments and sealing the PDMS well during experiments, caused the peak to disappear. Based on these observations, the peak is most likely a copper oxide stripping peak, which can be dissolved by acid or formed in basic environment if sensors are exposed to oxygen. To eliminate the effect of this peak, but not affect the sensor’s performance, we deoxygenated the sample by bubbling nitrogen for 5 min to acquire a flat background voltammogram, and to make the Pb peak observable at lower concentrations. Fig. 4 demonstrated the necessity and effect of this procedure. The peak for the buffer (grey) is similar to that for 0.5 μM Pb, and disappears after deoxygenating, giving a mostly flat background (black). Consequently, all of the following experiments were conducted on deoxygenated samples.
Calibration in acetate buffer
A calibration curve was constructed by performing ASV in 25 nM–10 μM Pb in deoxygenated acetate buffer (0.2 M, pH 5.5) using the optimal conditions described above. For most concentrations, we repeated experiments three times (n = 3) using a new disposable device each time to obtain standard deviation. It is possible to choose a smaller volume and obtain the same signal (minimum 35 μL with preconcentration time of 5 min), due to the mass-transport limitation of our system,25 however, since it is not critical to use the minimum sample volume in water analysis where sample is plentiful, we chose 100 μL for convenience.
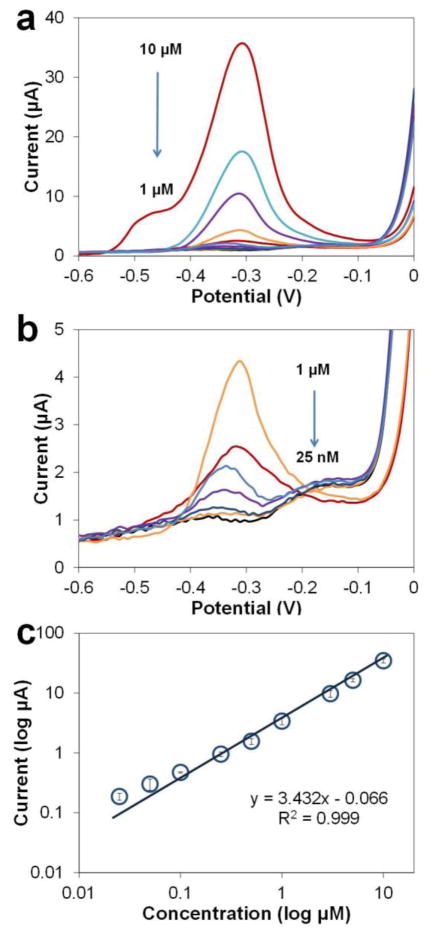
As our results in Fig. 5 show, when the Pb concentration is below 10 μM, ASV yields a single stripping peak. When the Pb concentration is as high as 10 μM, a small shoulder appears at −0.5 V. The possible reason is that Pb starts to be deposited on top of Pb instead of Cu, which requires a lower potential to strip off. With Pb concentrations below 0.5 μM, the Pb stripping peak shifts from −0.31 V to −0.34 V. The 30 mV shifting results from the buffer de-oxygenation, as the voltammograms shift as a whole indicating the Cu/CuCl2 RE is affected by oxygen as well. This shift did not affect the measurements of peak amplitude or the calibration curve.
Fig. 5.
Calibration of Pb using ASV in (a) 25 nM - 10 μM range and (b) 25 nM - 1 μM range. Analyses performed in acetate buffer (0.2 M, pH 5.5). Preconcentration potential −0.8 V and time 300 s, amplitude 50 mV, period 50 ms, increment 8 mV. (c) Calibration curve for Pb in buffer.
The calibration curve in Fig. 5c indicates the sensitivity of the Cu-based sensor for Pb in acetate buffer is 3.43 μA/μM (normalized sensitivity 180.53 uA/uM/cm2), with good linearity (R2=0.999), compared to the previously reported sensitivity22 of the Cu sensor for Zn ASV measurements which is 57.95 uA/uM/cm2. The correlation equation is I(μA)=3.43 ×[Pb(μM)]−0.066 (R2=0.999 for n = 9). The coefficient of variation is from 2% (at 0.1 μM) to 20 % (at 0.05 μM) with an average of 10% (n = 9). Seven measurements of 25 nM Pb were performed for calculating the LOD, which was 21 nM or 4.4 ppb (3σ/slope method, n = 7). For most carbon-based sensors, LOD for Pb is usually in the range of 0.03–2 ppb even with shorter preconcentration time due to larger sample volume and better agitation. Several microscale sensors using materials like carbon19 and bismuth20 have been reported for Pb determination with LODs of ~1 ppb and 8 ppb, respectively; and when using a silver electrode, the LOD can be as low as 0.5 ppb.26 The LOD of the Cu-based sensor for Pb is comparable to these previously reported sensors and is sufficiently low to determine whether the Pb in environmental samples exceeds the safe level in drinking water.
Interference study
We studied Cd and Zn as potential interferences for the ASV determination of Pb, due to the close proximity of their stripping peaks to that of Pb, and also due to the common coexistence in real-world samples such as surface waters. According to the toxicological profiles from the US Agency for Toxic Substances and Disease Registry (ATSDR), the common ranges for these metals in surface waters are: 5–30 μg/L (ppb) for Pb, <1 μg/L for Cd, and <50 μg/L for Zn.27–29 Thus, we selected the concentration ranges of 0–1 μM (0–112 ppb) Cd and 0–10 μM (0–650 ppb) Zn in the presence of Pb in two fixed concentrations – 0.5 μM or 1 μM. Since Cd2+ and Zn2+ might interfere with Pb2+ differently, we tested their influences on Pb separately.
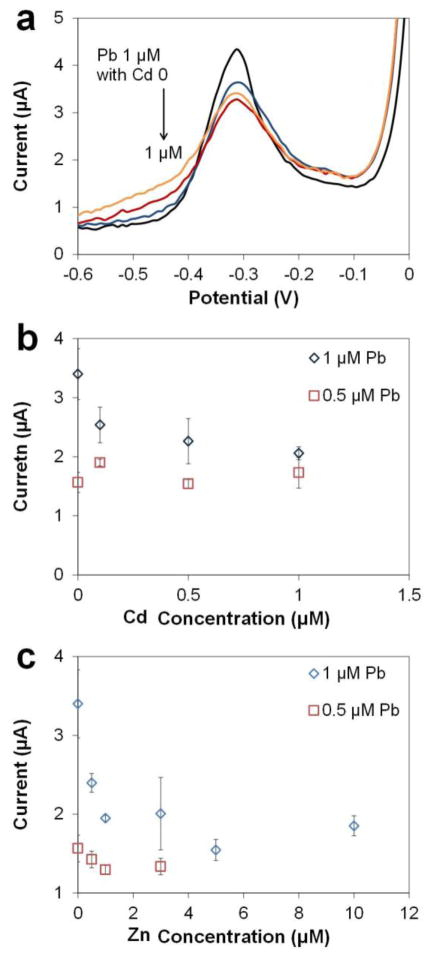
In the interference study of Cd, we examined the voltammograms of 0.5 μM and 1 μM Pb with 0–1 μM (0–112 ppb) Cd. The preconcentration potential was chosen as −0.8 V to avoid the Cd peak and only show the influenced Pb peak (Fig. 6a). In addition, only Pb peaks appeared since the sensitivity of the Cu-based sensors is not low enough for Cd below 1 μM. The stripping peak for 1 μM Pb with 1 μM Cd shrank by 40% compared to the amplitude of the 1 μM Pb alone, while the peak only shrank by 25% when the concentration of Cd was reduced to 0.1 μM (Fig. 6b). More importantly, at lower Pb concentrations such as 0.5 μM (104 ppb), which is still a relatively high level for real world samples, the Pb peaks with or without Cd addition overlap. This suggests that the Pb peaks are not affected by the presence of Cd or the different levels of Cd. Regarding the coefficient of variation, the Pb peak amplitude of 1 μM and 0.5 μM exhibited comparable C.V. values of 5–17% and 3–15% with 0.1–1 μM Cd, respectively. Therefore, we conclude that for real world samples with concentrations of Cd <1 μM, the interference will not be an issue for Pb determination using the Cu-based sensors.
Fig. 6.
ASV of fixed concentrations of Pb (0.5 μM and 1 μM) with increasing concentrations of Cd and Zn in acetate buffer (0.1 M, pH 5.5), 100 μL sample. (a) Voltammograms of 1 μM Pb with increasing Cd. (b) Pb peak currents of 0.5 μM and 1 μM Pb in the presence of different concentrations of Cd. (c) Pb peak currents of 0.5 μM and 1 μM Pb in the presence of different concentrations of Zn. (Preconcentration potential −0.8 V and time 300 s, amplitude 50 mV, period 50 ms, increment 8 mV.)
In the interference study of Zn, we performed ASV of 0.5 μM and 1 μM Pb with 0–10 μM Zn using parameters for Pb determination. Although the optimized preconcentration potential for Zn is 0.2 V more negative than Pb, a fraction of Zn would co-deposit with Pb at −0.8 V due to underpotential deposition.30 We do not expect to see a Zn peak and only observed the Pb peak since the stripping step started at −0.8 V, which did not have enough potential window for the stripping of Zn. For 1 μM Pb, the amplitude of the Pb stripping peak with Zn concentrations of 0.5 and 1 μM (Fig. 6c) decreased rapidly to the 57% of that without Zn. Then the peak amplitude became more consistent at approximately 50% when the concentration of Zn was higher than 3 μM. For 0.5 μM Pb, however, the peak amplitude only decreased to 85% of the original value and stabilized. On the other hand, the coefficient of variation of Pb peak amplitude was also affected by the additions of Zn. Comparing to the measurements of Pb alone, the coefficients of variation of Pb peaks with Zn are similar for most Zn concentrations: 2–13% for 1 μM Pb, while being as large as 23% with a Zn concentration of 3 μM; and 4–8% for 0.5 μM Pb. Thus, we conclude that at levels higher than 1 μM Pb, the presence of Zn tends to affect Pb ASV in the form of broadening and diminishing of Pb peaks, ultimately reducing sensitivity and LOD for Pb determination. However, at lower concentrations such as the typical levels observed in surface water and in our target samples, the influence of Zn could be neglected.
Analysis of water samples
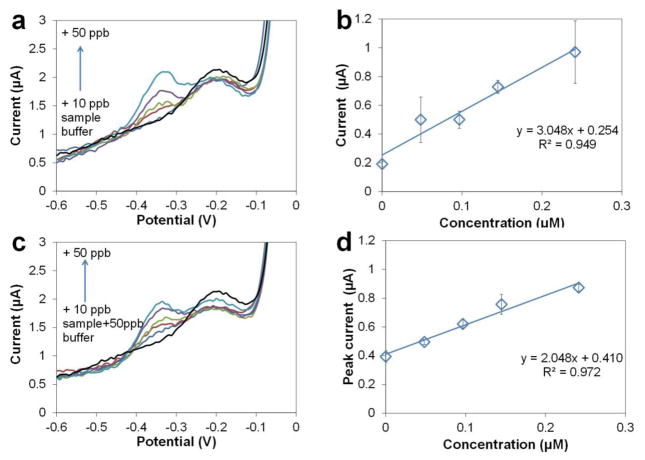
To demonstrate the capability of the Cu-based sensors for Pb determination in environmental matrices, we collected water from a local pond (Burnet Woods, Cincinnati, OH, August 9th, 2013) and determined Pb using Cu-based sensors. The sample was diluted 2× with acetate buffer (0.2 M, pH 5.5) and spiked with additional Pb to test the recovery using the method of standard additions. ASV (Fig. 7a) was performed in the original sample and with additional Pb from 10–50 ppb with the same parameters as in buffer. In this range of Pb concentration, the small slope of the low background current may affect the determination of the baselines and thus the quantification of the Pb peaks. Therefore, baseline subtraction was applied to all voltammograms by mathematically subtracting the background waveform. The potential of the Pb peak is −0.34 V, which is comparable to that in buffer. The calibration curve (Fig. 7b) indicates the sensitivity (3.05 μA/μM) and linearity (R2 = 0.949). The sensitivity is slightly smaller than, but comparable to that in buffer which is 3.43 μA/μM. The concentration of Pb in the pond water is determined to be 34.5 ppb, which is higher than 10 ppb, the safety level of Pb in drinking water. Thus the local pond is polluted by Pb and needs water processing before human use. Typically, the Pb level in unpolluted water samples is at31 or below32 the single ppb level, or even undetectable when the LOD is as low as 0.01 ppb.33
Fig. 7.
Determination of Pb in pond water. (a) ASV of pond water directly diluted 1× by acetate buffer (0.2 M, pH 5.5), with additional 0–50 ppb Pb. (b) Standard addition curve for Pb in pond water. (c) ASV of pond water spiked with 50 ppb Pb and diluted 1× by acetate buffer (0.2 M, pH 5.5). (d) Standard addition curve for pond water spiked with 50 ppb Pb. Preconcentration potential −0.8 V, time 300 s, amplitude 50 mV, period 50 ms, increment 8 mV.
To further validate reliability of this method, Pb standard was spiked into the original sample making the concentrations an additional 50 ppb Pb and analyzed in order to evaluate recovery efficiency. The stripping voltammograms are shown in Fig. 7c. The calibration curve (Fig. 7d) indicates the sensitivity (2.05 μA/μM) and linearity (R2 = 0.972). We determined the concentration of Pb in the spiked sample to be 82.8 ppb, which is 48.3 ppb higher than the calculated concentration in the original sample. The recovery, 96.6%, demonstrates good reliability of Pb determination using Cu-based sensors, and also indicates that the dissolved organic matter (DOM) in the pond water that we collected was not interfering by complexing with the free Pb2+ in the sample.
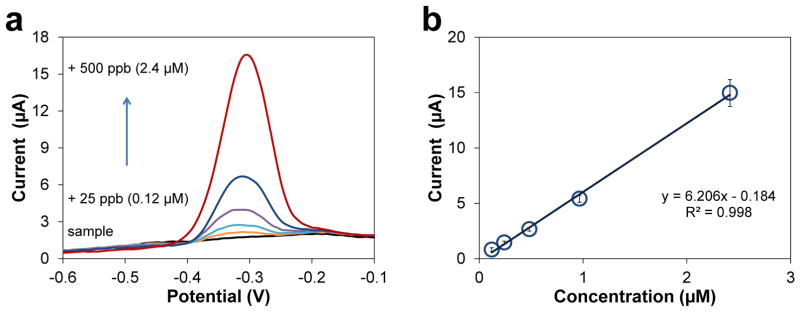
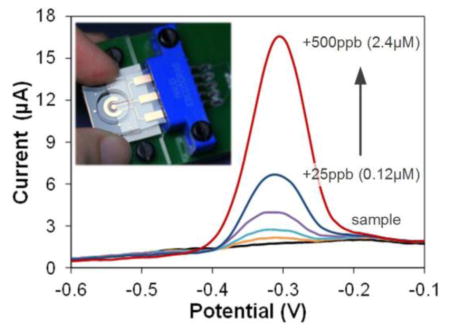
We also collected water from the Ohio River (Newport, KY shore, November 30th, 2012) and measured Pb using the Cu-based sensors as described above. Sample pH was adjusted to 5.5 using acetic acid and diluted by acetate buffer (0.1 M, pH 5.5) by 2×. Fig. 8a shows voltammograms of the original diluted river water and the water spiked with additional Pb. The Pb stripping peaks appear at the same potential of approximately −0.3 V as in buffer. The standard addition plot (Fig. 8b) shows a linear response for the 25–500 ppb additions of Pb, with the correlation equation of I(μA)=6.21×[Pb(μM)]−0.184 (R2=0.998 for n = 5). The sensitivity, 6.21 μA/μM, is two times that in acetate buffer. Since we do not observe a Pb peak in the voltammogram of the original diluted sample, we conclude that the Pb level in the diluted sample is below the LOD of our sensor. Considering the dilution factor, the Pb concentration in the water from the Ohio River (Cincinnati, OH) should be less than 2× LOD (8.8 ppb), which is below the safely limit recommended by the WHO.6
Fig. 8.
Determination of Pb in Ohio river water. (a) ASV of diluted river water sample in acetate buffer (0.2 M, pH 5.5) and water samples with additional 25–500 ppb Pb. Preconcentration potential −0.8 V, time 300 s, amplitude 50 mV, period 50 ms, increment 8 mV. (b) Standard addition curve for the calculation of Pb in river water.
4. Conclusions
We successfully demonstrated the use of our Cu-based sensor for determination of Pb in water samples. Although the LOD of the Cu-based sensor is not as good as that of the conventional electrodes or microsensors, this sensor is better suited for applications where a low cost, disposable sensor is advantageous such as measurements made in the field and point-of-care. First, Cu greatly reduces the cost for mass production of the disposable sensor compared to the noble metals in the lower material cost and simpler procedures. Second, simple fabrication also helps to reduce the physical variations among individual sensors, which improves the reproducibility of multiple measurements and thus the precision of final results. Furthermore, the Cu-based sensors exhibited LOD of 21 nM (4.4 ppb) for Pb without interference, which is low enough to determine whether the safety level of 10 ppb for drinking water has been exceeded.
By adding low concentrations of Cd and Zn to the Pb solutions, we examined interferences to Pb determination. Our findings suggest that Zn does impact the shape and amplitude of the Pb peak at concentrations above 1 μM. However, at Pb levels below 1 μM (as is the case for most surface water samples), the impact of Zn is negligible. Our results also show that concentrations of Cd <1 μM do not interfere with Pb determination using the Cu-based sensors.
For potential POC applications, some practical factors apart from the lab-based, bench-top experiments require consideration as well. We could simplify on-site sample preparation and minimize the impact of adding multiple reagents to the sample by using one addition of all required reagents either in aqueous form, or alternatively, dried and stored on a piece of filter paper as the case with microfluidic Paper Analysis Devices (uPADs) we34 and others have demonstrated in the past.35 On the other hand, the deoxygenation step applied in this work might be challenging and complicated to integrate into a POC system. If the common deoxygenation procedure of bubbling an inert gas such as nitrogen or argon from portable, hand-held containers poses a problem, more POC-friendly means of deoxygenation would need to be explored. One approach would be to remove oxygen by electrochemical reduction to water at a negative potential, as is sometimes done in thin layer electrochemistry36, 37 which might require a change in procedure (such as a smaller sample size) or cell design that would enable exhaustive electrolysis of the dissolved oxygen. Another approach would be to prepare deoxygenated acetate buffer aliquots in vacuum-sealed containers for use in the field. While this would not yield the complete deoxygenation once mixed with the sample, the resulting reduction in the dissolved oxygen level maybe sufficient to lower the LOD into the target range. Ultimately, the simplicity and low-cost of this sensing method make it possible to monitor Pb levels on-site and continuously.
Acknowledgments
We gratefully acknowledge the support by the National Institutes of Health (NIH) awards R21ES019255 and R01ES022933.
References
- 1.Steenland K, Boffetta P. Am J Ind Med. 2000;38:295–299. doi: 10.1002/1097-0274(200009)38:3<295::aid-ajim8>3.0.co;2-l. [DOI] [PubMed] [Google Scholar]
- 2.Goyer RA. Environ Health Perspect. 1993;100:177–187. doi: 10.1289/ehp.93100177. [DOI] [PMC free article] [PubMed] [Google Scholar]
- 3.Canfield RL, Henderson CR, Jr, Cory-Slechta DA, Cox C, Jusko TA, Lanphear BP. N Engl J Med. 2003;348:1517–1526. doi: 10.1056/NEJMoa022848. [DOI] [PMC free article] [PubMed] [Google Scholar]
- 4.Lanphear BP, Dietrich K, Auinger P, Cox C. Public Health Rep. 2000;115:521–529. doi: 10.1093/phr/115.6.521. [DOI] [PMC free article] [PubMed] [Google Scholar]
- 5.Settle DM, Patterson CC. Science. 1980;207:1167–1176. doi: 10.1126/science.6986654. [DOI] [PubMed] [Google Scholar]
- 6.World Health Organization (WHO) Guidelines for Drinking-Water Quality. 4. WHO Press, World Health Organization; Switzerland: 2011. [Google Scholar]
- 7.Smith JC, Butrimovitz GP, Purdy WC. Clinical Chemistry. 1979;25:1487–1491. [PubMed] [Google Scholar]
- 8.Jenner G, Longerich H, Jackson S, Fryer B. Chem Geol. 1990;83:133–148. [Google Scholar]
- 9. [accessed Jan 16, 2017];EDT DirectION Electrochemistry Products. http://www.edt.co.uk/Lead-Combination-Ion-Selective-Electrode-3231.
- 10.NICO2000. [accessed Jan 16, 2017]; http://www.nico2000.net/analytical/lead.htm.
- 11.Hanna Instruments. [accessed Jan 16, 2017]; http://hannainst.com/hi4112-lead-sulfate-combination-ion-selective-electrode.html.
- 12.Wang J. In: Analytical Electrochemistry. Wang J, editor. John Wiley & Sons, Inc; Hoboken, New Jersey, USA: 2006. pp. 85–97. [Google Scholar]
- 13.Gunasingham H, Dalangin RR. Anal Chim Acta. 1991;246:309–313. [Google Scholar]
- 14.Desmond D, Lane B, Alderman J, Hill M, Arrigan D, Glennon J. Sensors Actuators B: Chem. 1998;48:409–414. [Google Scholar]
- 15.Lu M, Toghill KE, Compton RG. Electroanal. 2011;23:1089–1094. [Google Scholar]
- 16.Wang J, Lu J, Hocevar SB, Ogorevc B. Electroanal. 2001;13:13–16. [Google Scholar]
- 17.Toghill KE, Xiao L, Wildgoose GG, Compton RG. Electroanal. 2009;21:1113–1118. [Google Scholar]
- 18.Bonfil Y, Brand M, Kirowa-Eisner E. Anal Chim Acta. 2000;424:65–76. [Google Scholar]
- 19.Nie Z, Nijhuis CA, Gong J, Chen X, Kumachev A, Martinez AW, Narovlyansky M, Whitesides GM. Lab Chip. 2010;10:477–483. doi: 10.1039/b917150a. [DOI] [PMC free article] [PubMed] [Google Scholar]
- 20.Zou Z, Jang A, MacKnight E, Wu P, Do J, Bishop PL, Ahn CH. Sensors Actuators B: Chem. 2008;134:18–24. [Google Scholar]
- 21.Jothimuthu P, Wilson RA, Herren J, Haynes EN, Heineman WR, Papautsky I. Biomed Microdevices. 2011;13:695–703. doi: 10.1007/s10544-011-9539-1. [DOI] [PMC free article] [PubMed] [Google Scholar]
- 22.Pei X, Kang W, Yue W, Bange A, Heineman WR, Papautsky Anal Chem. 2014;86:4893–4900. doi: 10.1021/ac500277j. [DOI] [PMC free article] [PubMed] [Google Scholar]
- 23.Xiong L, Goodrich P, Hardacre C, Compton RG. Sensors Actuators B: Chem. 2013;188:978–987. [Google Scholar]
- 24.Kang W, Pei X, Bange A, Haynes EN, Heineman WR, Papautsky I. Anal Chem. 2014;86:12070–12077. doi: 10.1021/ac502882s. [DOI] [PMC free article] [PubMed] [Google Scholar]
- 25.Pei X, Kang W, Yue W, Bange A, Wong HR, Heineman WR, Papautsky I. 2012:82510K–82510K-8. [Google Scholar]
- 26.Jung W, Jang A, Bishop PL, Ahn CH. Sensors Actuators B: Chem. 2011;155:145–153. [Google Scholar]
- 27.Abadin H, Ashizawa A, Stevens Y, Llados F, Diamond G, Sage G, Citra M, Quinones A, Bosch SJ, Swarts SG. Toxicological Profile for Lead. Agency for Toxic Substances and Disease Registry (ATSDR); Atlanta, GA: Aug, 2007. [PubMed] [Google Scholar]
- 28.Faroon O, Ashizawa A, Wright S, Tucker P, Jenkins K, Ingerman L, Rudisill C. Toxicological Profile for Cadmium. Agency for Toxic Substances and Disease Registry (ATSDR); Atlanta, GA: Sep, 2012. [PubMed] [Google Scholar]
- 29.Roney N, Smith CV, Williams M, Osier M, Paikoff SJ. Toxicological Profile for Zinc. Agency for Toxic Substances and Disease Registry (ATSDR); Atlanta, GA: Aug, 2005. [Google Scholar]
- 30.Herzog G, Arrigan DW. TRAC-Trend Anal Chem. 2005;24:208–217. [Google Scholar]
- 31.Herrero E, Arancibia V, Rojas–Romo C. J Electroanal Chem. 2014;729:9–14. [Google Scholar]
- 32.Monticelli D, Laglera L, Caprara S. Talanta. 2014;128:273–277. doi: 10.1016/j.talanta.2014.04.024. [DOI] [PubMed] [Google Scholar]
- 33.Ninwong B, Chuanuwatanakul S, Chailapakul O, Dungchai W, Motomizu S. Talanta. 2012;96:75–81. doi: 10.1016/j.talanta.2012.03.057. [DOI] [PubMed] [Google Scholar]
- 34.Murdock RC, Shen L, Griffin DK, Kelley-Loughnane N, Papautsky I, Hagen JA. Anal Chem. 2013;85:11634–11642. doi: 10.1021/ac403040a. [DOI] [PubMed] [Google Scholar]
- 35.Mentele MM, Cunningham J, Koehler K, Volckens J, Henry CS. Anal Chem. 2012;84:4474–4480. doi: 10.1021/ac300309c. [DOI] [PubMed] [Google Scholar]
- 36.DeAngelis TP, Heineman WR. Anal Chem. 1976;48:2262–2263. [Google Scholar]
- 37.DeAngelis TP, Bond RE, Brooks EE, Heineman WR. Anal Chem. 1977;49:1792–1797. doi: 10.1021/ac50012a025. [DOI] [PubMed] [Google Scholar]


