

Abstract
Although many advanced and sophisticated ab initio approaches for modeling protein–protein complexes have been proposed in past decades, template-based modeling (TBM) remains the most accurate and widely used approach, given a reliable template is available. However, there are many different ways to exploit template information in the modeling process. Here, we systematically evaluate and benchmark a TBM method that uses conserved interfacial residue pairs as docking distance restraints [referred to as alpha carbon–alpha carbon (CA-CA)-guided docking]. We compare it with two other template-based protein–protein modeling approaches, including a conserved non-pairwise interfacial residue restrained docking approach [referred to as the ambiguous interaction restraint (AIR)-guided docking] and a simple superposition-based modeling approach. Our results show that, for most cases, the CA-CA-guided docking method outperforms both superposition with refinement and the AIR-guided docking method. We emphasize the superiority of the CA-CA-guided docking on cases with medium to large conformational changes, and interactions mediated through loops, tails or disordered regions. Our results also underscore the importance of a proper refinement of superimposition models to reduce steric clashes. In summary, we provide a benchmarked TBM protocol that uses conserved pairwise interface distance as restraints in generating realistic 3D protein–protein interaction models, when reliable templates are available. The described CA-CA-guided docking protocol is based on the HADDOCK platform, which allows users to incorporate additional prior knowledge of the target system to further improve the quality of the resulting models.
Keywords: template-based modeling, interface restrained docking, CA-CA-guided docking, AIR-guided docking, refinement
Introduction
Computational docking is a powerful tool for modeling 3D structures of protein–protein complexes. Given available 3D structures or models of the interacting components, docking aims to generate native-like 3D models of protein–protein complexes by sampling a vast number of possible conformations and selecting those with low interaction energies (which is considered the hallmark of native-like structures). The past decades have seen considerable progress in docking methods and software [1]. Despite this, there is still considerable room for improvement in both reliability and efficiency. Template-based modeling (TBM) of structures offers a promising alternative to ab initio docking whenever 3D structures of complexes formed by homologs of the proteins to be docked are available. Recent work has demonstrated that the conservation of interfaces across homologous complexes can improve docking [2, 3].
Different strategies have been used to exploit template information to model protein complexes. The representative approaches include the following: (1) ‘(global) superimposition’ (i.e. global structure–structure alignment), generating models by superimposing unbound 3D component protein (or domain) structures onto templates [4]; (2) ‘dimeric threading’ (i.e. sequence–structure alignment), ‘threading’ the component protein sequences onto structural templates and searching for the best sequence–structure alignment based on a scoring function [5, 6]; (3) ‘direct homology modeling of the complex’, e.g. with MODELLER [7]; and (4) ‘Interface Structure Alignment’ (ISA)-based modeling, generating models by superimposing the component protein structures onto template interface structures [8, 9]. In addition, in the context of our information-driven flexible docking approach, HADDOCK [10], both template-based ambiguous interaction restraints (AIRs)-guided docking and alpha carbon–alpha carbon (CA-CA)-guided docking have been used for the prediction of some targets [11] in the CAPRI experiments [1] (see Supplementary Table S1 for summary and comparison).
All these strategies have both strengths and weaknesses, and some methods combine different strategies to achieve better modeling performance [5, 12]. Superimposition is the simplest technique. However, it requires the template structures to be highly similar to the target complex, tends to generate a large number of steric clashes and cannot account for conformational changes. Dimeric threading, which is an extension of monomer threading, is a more advanced technique. It simultaneously aligns two query protein sequences with dimeric template structures and adds interface evaluation score(s) to the threading alignment scoring function. Because the query sequences are threaded onto the structure(s) of bound homologous complex(es), dimeric threading, in principle, should be able to account for some conformational changes on binding, provided these also occur in the homologous complexes. One advantage is that dimeric threading does not require the structures of query proteins; however, this feature may impair the quality of the modeling, because structure–structure alignment is generally more accurate and sensitive than sequence–structure alignment (i.e. threading) in terms of alignment quality and detection of remote homologs. Direct homology modeling of the complex also starts from query sequences; hence, it shares similar advantages and disadvantages with the dimeric threading.
While superimposition, threading and homology modeling exploit the global structure and/or sequence similarity between the template(s) and the query proteins, the ISA-based, AIR-guided and CA-CA-guided methods exploit local structural similarity at the template interface(s). The ISA method is based on the observation that interface structures are conserved and reused among different protein–protein complexes [13]. Most ISA models are reported to be more accurate than models generated by full structural alignment methods [14]. However, like full structure superimposition, the ISA models also potentially suffer from a high number of steric clashes, and by nature, ISA is not able to model binding-induced conformational changes properly. See [15] for a recent review of superimposition, threading and ISA-based methods.
The template-based AIR-guided and CA-CA-guided docking approaches used with HADDOCK are drastically different from the TBM methods described above, in that they are essentially docking methods driven by interface restraints. These interface restraints are converted into an energy term used during sampling and scoring (for more details see Supplementary Text 1). They guide the docking process to respect the user-input potential interfacial area or distance restraints derived from templates (with the danger that the true interface might never have been sampled if the restraints are wrong). Models are generated using a combination of rigid-body docking and semi-flexible refinement, which allows explicit refinement of the backbone and side chains of the interfaces according to the template interface conformation and the underlying force field. Despite having been successfully applied in CAPRI, these approaches have not been systematically evaluated.
Here, we systematically examine template-based AIR and CA-CA-guided docking methods, comparing their performance with the commonly used superposition method (after refinement) on (1) a large and non-redundant docking benchmark data set and (2) targets from the recent CAPRI round 30. We show that CA-CA-guided docking generates better quality models than superimposition or AIR-guided docking, and we discuss the advantages of these approaches over other TBM methods.
Methods
Modeling methods
Template identification
To identify available templates for query cases, we use PS-HomPPI [16], a partner-specific homology-based protein–protein interface predictor. Given the sequences of two interacting query proteins, PS-HomPPI searches homologous interacting proteins in the Protein Data Bank (PDB, www.wwpdb.org) [17]; classifies the templates into Safe Zone (high level of interface conservation), Twilight Zone (medium level) or Dark Zone (low level); and returns the inferred interfacial residues from the templates in the best available Zone defined above. Templates sharing more than 95% sequence identity (SID) with the query proteins as well as the reference complex are removed. The same set of templates is used in all evaluated TBM methods to rule out effects of template quality on the performance of various modeling approaches.
AIR-guided docking
We use PS-HomPPI to predict interfacial residues, and input them as the so-called ‘active residues’ (residues that are believed or known to make contacts) in HADDOCK to restrain the sampling around these. The so-called ‘passive residues’ (surface neighbors of active residues) were automatically determined by HADDOCK. Active and passive residues are converted into highly ambiguous distance restraints between the defined interfaces (no pairwise residue–residue contact information from the template is used in the AIR-guided docking protocol).
The docking is performed using the HADDOCK web server [18]. To lower the risk of false interface residues, by default, HADDOCK randomly discards 50% of the active residue restraints for each docking trial; because most templates identified by PS-HomPPI are reliable, this is reduced to only 10% in these experiments. All other server settings are kept to their default values.
CA-CA-guided docking
For CA-CA-guided docking, the structural templates retrieved by PS-HomPPI are clustered, and one set of CA-CA distance restraints is calculated for each cluster from the conserved contact pairs. These restraints are used as the so-called ‘unambiguous distance restraints’ in HADDOCK (which are not subject to random removal). Details of the extraction of CA-CA restraints from templates are given in Box 1.
Box 1:
Extracting CA-CA distances from clustered templates
Superimpose unbound query PDB files onto each template.
Cluster the templates by clustering the superimposed models generated from Step 1 based on ligand RMSDs (i.e. RMSD calculation over second molecule after fitting first molecule [19]). The clustering cutoff for L-RMSD is 5 Å.
Calculate interface CA-CA distances from each cluster of ‘templates (not the superimposed models)’ and map their residue numbering to that of the query PDB files. Because the templates identified by PS-HomPPI are reliable (i.e. sharing relatively high SID with the query proteins), we use a 15 Å cutoff for defining interface CA-CA distances.
For each CA-CA restraint of each cluster, calculate the average, minimum and maximum CA-CA distance. The distance restraint interval for docking is defined by the minimum and maximum distances with an additional 0.5 Å additional error boundary on both sides.
The residues of the query that are not aligned with the templates are removed from the CA-CA restraint files.
In case of multiple clusters of templates, a docking run (using the default setting of the server) is performed for each set of CA-CA restraints. The idea behind the clustering of the templates is that templates may have different interaction modes, and discriminating between those before docking results in better and more consistent results (data not shown). The difference between the CA-CA-guided docking and the AIR-guided docking is that the CA-CA-guided docking uses interfacial residue pairs as restraints, which impose stricter restraints on the orientation of interaction components than the AIR-guided docking.
For both AIR- and CA-CA-guided docking, the number of models generated at each stage are 1000, 200 and 200 for rigid-body docking, semi-flexible refinement and final refinement in explicit water, respectively. The models were clustered and ranked according to the default HADDOCK score.
Superimposition and refinement
We use TM-align [20] to superimpose the unbound component structures onto the templates retrieved by PS-HomPPI. The superimposed models are further refined in explicit water using the refinement interface of the HADDOCK server (which performs the refinement stage only) to remove clashes.
Note that we use the word ‘superimposition’ to stand for ‘superimposition with refinement’ throughout this article, except for the Results section in Supplementary Text 2, where we evaluate the effects of refinement on the superimposed models.
Ab initio docking
To define the baseline of modeling performance, we also perform ab initio docking using center-of-mass restraints in HADDOCK. For this, the number of models generated at each stage is increased to 10 000/400/400, to allow for a more thorough sampling in the absence of template or other prior knowledge data.
Data sets
BM4 dimers
CA-CA-guided docking is applicable to an arbitrary number of interacting chains. We focus here on dimers to simplify the analysis. We compare the four docking methods described above on the dimers of the Docking Benchmark 4.0 (BM4) [21]. BM4 has 175 docking cases, 114 of which are dimers. For 78 of those cases, PS-HomPPI could identify templates from the PDB. For our analysis, we only considered the complexes for which at least one of the modeling approaches generated an acceptable top cluster (see Evaluation section below) [i.e. the average interface root mean squared deviation (i-RMSD) of top four models in the cluster 4 Å], which left us with 58 cases.
Target cases in CAPRI round 30
In 2014, the protein structure prediction and the docking communities held the first joint CASP-CAPRI experiment, with a spirit of establishing closer ties between the two communities, and an aim to evaluate the state-of-the-art approaches in modeling protein assemblies starting from sequences. This CASP-CAPRI experiment evaluated 25 targets. Because protein–protein templates are available for the majority of these, they represent perfect cases for evaluating template-based docking approaches.
For 13 targets with correctly identified template(s), we (the HADDOCK group) used template-based docking approaches as follows: (1) CA-CA-guided docking (four cases); (2) AIR-restrained docking (Target 86); (3) MODELLER-based homology modeling using a dimeric template (T82 and T92); and (4) superimposition plus water refinement (the remaining six targets). The choice of methods during the CAPRI competition was mainly driven by time pressure and other, often non-objective, criteria.
Here, for each CAPRI target, we have redone the modeling using our CA-CA-guided docking protocol, and compare the resulting models with superimposed models and our originally submitted CAPRI models. To make comparisons on the same basis, we use the same monomer structures and templates that were used in CAPRI and generate, where needed, models by superimposition or by CA-CA-guided docking.
Evaluation
We evaluate the model quality using the following three CAPRI criteria, which are widely used in the docking community:
Interface root mean squared deviation
i-RMSD measures the prediction accuracy for the 3D structure of the interface on both sides of the complex. It is calculated by fitting the backbone atoms of the interfacial residues of the experimentally determined complex onto the corresponding residues in a docked model and calculating the corresponding RMSD. Interfacial residues are defined as residues with at least one atom within 10 Å of any atom of the other molecule [19].
Fraction of native contacts
Fraction of native contacts (Fnat) is defined as the number of correctly predicted residue–residue contacts in a docked model divided by the total number of contacts in the target complex. A pair of residues from different sides of the interaction is defined as a contact if any of their atoms are within 5 Å [19].
Number of atomic clashes
Atomic clashes are defined as contacts between non-hydrogen atoms separated by < 3.0 Å [19].
For evaluation and comparison, we choose the top four models of the best cluster (based on the HADDOCK scoring function) generated by each modeling method at the water stage. HADDOCK clusters models based on the RMSD of the interface of the ligand after superimposing on the interface of the receptor. The top four models are selected as follows:
For ab initio and AIR-guided docking, we choose the best cluster, i.e. the one with the lowest average HADDOCK score of its top four models.
For CA-CA-guided docking, we follow the same procedure as for ab initio and AIR-guided docking, except for cases where several interfaces are predicted by PS-HomPPI after clustering; for those cases, multiple docking runs are performed. The best cluster from all pooled clusters from the various runs is selected. Because in such cases the CA-CA distance restraint energies are not comparable owing to different restraint sets used, this energy term is excluded from the HADDOCK score.
For superimposition with refinement, each docking case has multiple superimposed models from the multiple templates. We perform a HADDOCK refinement run on each superimposed model and choose the best cluster from the pooled set of clusters from all runs.
Results
We first verified that refinement in explicit solvent dramatically reduces clashes in the superimposed models (Supplementary Text 2). We then demonstrate the superiority of CA-CA restraint-guided docking over other methods, especially on cases with medium to large conformational changes.
CA-CA-guided docking shows the best performance, followed by superimposition with refinement, AIR-guided docking and ab initio docking
CA-CA-guided docking had the leading performance in terms of i-RMSDs and Fnat of the docked models, followed by superimposition, AIR-guided docking and ab initio docking (Figure 1). This becomes even clearer if one considers the amount of conformational changes (Sections 3.3 and 3.4). CA-CA models had the lowest median i-RMSD and the highest Fnat (medians are represented as circles with a dot at center in Figure 1) with the smallest variances (narrowest interquartile range, IQR). Also, except for ab initio models (which have zero atomic clashes), CA-CA models had the lowest number of clashes, with a median of 10 clashes per model, which is comparable with the quality of high-resolution structures in the PDB.
Figure 1.

Average i-RMSD, Fnat and number of atomic clashes of the top four models of the top-ranking cluster generated by four different modeling approaches: ab initio docking, AIR-guided docking, superimposition and CA-CA-guided docking. The lower (Q1), middle (Q2) and upper (Q3) quartiles of each thick bar are 25th, 50th and 75th percentile. IQR is Q3–Q1. Any data value that lies more than 1.5 × IQR lower than the first quartile or 1.5 × IQR higher than the third quartile is considered an outlier (empty circle). The whiskers extend to the largest and smallest values excluding outliers. The median is shown as a circle with a dot. Reference lines of i-RMSD at 1, 2 and 4 Å are drawn (green, purple and red), which correspond to the CAPRI’s standard criteria on excellent, good and acceptable models. Similarly, CAPRI reference lines for Fnat at 0.5, 0.3 and 0.1 are also drawn (green, purple and red). The lower i-RMSD, the higher Fnat and the lower number of clashes, the better a method. A colour version of this figure is available at BIB online: http://bib.oxfordjournals.org.
Different cases have different modeling difficulty levels, so it is more reasonable to compare the performance of the four modeling approaches case by case. We conducted the non-parametric Friedman test (recommended by [22] to test the null hypothesis that ‘the four modeling approaches have the same performance and their differences are merely random’. For each case, we ranked the four modeling approaches based on their performance, and assigned the best performance method a rank of 1 and the worst a rank of 4. The Friedman test compares the average ranks of the four approaches. The average ranks should be more or less equal if the four modeling approaches perform equally well. The null hypothesis is rejected at the significance level of 0.05 (data not shown). Therefore, we conclude the performances of the four modeling approaches are not the same.
Given the significant result of the Friedman test, we further used the post hoc Nemenyi test to compare all approaches with each other. Two approaches have different performance if their average ranks differ by at least the critical difference (CD) with the level of significance at 0.05. The CD is calculated based on [22]. The CA-CA-guided docking had the lowest rank averaged over the 58 cases, followed by superimposition, AIR-guided docking and ab initio docking, for both i-RMSD and Fnat (Figure 2). The CA-CA-guided docking significantly outperforms the other three methods, at a significance level of 0.05 for both i-RMSD and Fnat (Figure 2).
Figure 2.

Nemenyi test for pairwise comparison of the top four models of the top-ranking cluster generated by four different modeling approaches: ab initio docking, AIR-guided docking, superimposition and CA-CA-guided docking. For each case, the four modeling methods are ranked based on their performance, with a rank of 1 for the best performing method and 4 for the worst. The average rank of each method is shown. Two methods are significantly different from each other if their average rank difference is larger than the CD at the significance level of 0.05, which is 0.62. Methods are connected with a bar if they are not significantly different from each other.
CA-CA-guided docking outperforms superimposition, especially on cases with medium to large conformational changes
CA-CA-guided docking outperformed superimposition for most BM4 dimer cases in terms of the quality of the top four models of the top-ranking cluster after the water refinement stage of HADDOCK, especially on cases with medium to large conformational changes. For each docking case, the performance differences between the CA-CA-guided docking and superimposition were calculated and plotted into box plots in Figure 3. CA-CA-guided docking outperformed superimposition most significantly on cases with large conformational changes (three cases), followed by cases with medium conformational changes (nine cases). The differences on rigid-body cases (46 cases) were small.
Figure 3.

Performance differences between CA-CA-guided docking and superimposition over the BM4 dimer cases with rigid-body, medium, large conformational changes. A negative i-RMSD difference means that the top four CA-CA models of a docking case have a lower average i-RMSD than its top four superimposed models. Likewise, the positive difference in Fnat and the negative difference in the number of clashes mean that the top four CA-CA models are better than the top four superimposed models. ‘Rigid-body’, ‘Medium’ and ‘Difficult’ correspond to low, medium and large conformational changes, respectively [21]. The superiority of CA-CA-guided docking over superimposition becomes increasingly clear as the amount of conformational changes on binding increases.
The superiority of CA-CA-guided docking over superimposition was also observed in CAPRI targets (see Supplementary Table S3), but was not as obvious as in BM4 dimers; because the CAPRI monomer structures were modeled directly on the bound template, some binding-induced conformational changes may have been already accounted for. For 7 out of 13 cases, CA-CA-guided docking outperformed superimposition by an average of 0.34 Å in term of i-RMSDs. For the six cases where superimposition models had smaller i-RMSDs than CA-CA models, five had small differences in i-RMSD (ranging from 0.07 to 0.19 Å), and one of them (T85) was a reasonable exception with a large i-RMSD difference of 2.32 Å (discussed in Supplementary Text 3).
CA-CA-guided docking is especially well-suited for interactions mediated through loop, flexible tails or disordered regions
Protein–protein interactions mediated through regulatory loops and flexible tails are prevalent in the solved structures in the PDB. These often undergo large conformational changes on binding. Therefore, even when unbound close homologs with solved structures are available, superimposition, which keeps the input structures rigid, will not be able to generate realistic interface structures. In contrast, by deriving CA-CA restraints from the bound templates (which should have already undergone the necessary conformational changes), and allowing for flexibility in CA-CA-guided docking (as in the flexible stages of HADDOCK), the interfacial disordered regions can be remodeled to some extent to account for conformational changes.
A case study
Entry 2Z0E in the BM4 data set, the HsAtg4B-LC3 complex (human Atg4B and its conjugation system, LC3), is a tail-mediated protein–protein interaction that plays an important role in autophagy [23]. On LC3 binding, the regulatory loop of HsAtg4B undergoes large conformational changes (RMSD of 3.40 Å) [23]. We visually inspected the best from both the CA-CA and superimposed models, and compared them with the X-ray crystal structure of HsAtg4B-LC3. CA-CA-guided docking successfully induced the large conformational change of the LC3 tail and of the regulatory loop of HsArg4B (Figure 4B), whereas the superimposed model failed to do so (Figure 4A).
Figure 4.

Comparison of the best models generated by superimposition (A) and CA-CA-guided docking (B) on case HsAtg4B-LC3 (PDB ID: 2Z0E). The models are shown in green and yellow, and the experimentally determined structure in blue and pink. The CA-CA model successfully models the conformational changes of the regulatory loop of HsAtg4B and the LC3 tail on binding. Figures were generated using PYMOL [32].
Comparison with PRISM
We compared our CA-CA-guided docking with PRISM [24, 25], an ISA (interface structural alignment) modeling method. The comparison was made on 64 cases from the BM4 data set, for which both CA-CA-guided docking and PRISM were able to generate models. PRISM returns various numbers of models for each case depending on how many templates it found. For each target, we used equal numbers of top CA-CA models to make comparisons.
For each case, we calculated the average values of i-RMSD, Fnat and number of clashes for the models and compared those average values for the 64 BM4 dimers in our benchmark. For most cases, the CA-CA-guided models have lower i-RMSD and better Fnat than PRISM models (P-values < 0.001, Wilcoxon signed rank test) (Figure 5). PRISM models do not have any atomic clashes, whereas CA-CA models have an average of 12 clashes per model, which is a reasonable number as typically found in X-ray structures in the PDB (Supplementary Text 4).
Figure 5.
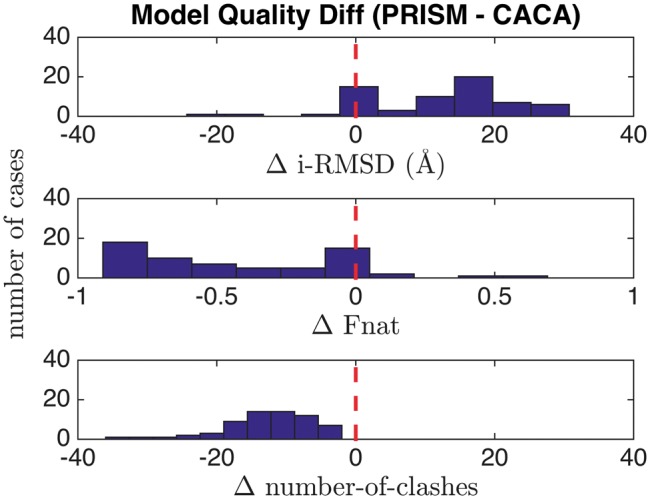
Performance differences (histograms) between CA-CA-guided docking and PRISM over 64 cases of BM4 dimers. Positive i-RMSD and negative Fnat difference mean that on average the CA-CA models are better than the PRISM models. The negative difference of number of clashes mean that the CA-CA models have more clashes per model (average of 12), whereas PRISM models do not have any.
Which template to choose?
PS-HomPPI often returns multiple templates identified from the PDB. A natural question is then which template or cluster of templates to choose? We simply performed modeling from all templates (or clusters of templates) and chose the best cluster from all pooled modeling runs based on the average HADDOCK score of the clusters. For some cases, this method incorrectly chose a cluster originating from a run with a wrong template. In fact, sometimes models from a correct template have overlapping HADDOCK scores (within the variance) with those from the chosen wrong template. The problem of selecting clusters from an incorrect template could be partly alleviated by: (1) considering top models from all clusters with comparable (i.e. overlapping) low HADDOCK scores; (2) exploiting biological knowledge of the specific targets; and (3) comparing the chosen top templates from the CA-CA-guided docking and superimposition; and if different templates are chosen, consider both templates.
By default, HADDOCK reports the energy terms and the final HADDOCK score for each model. The default HADDOCK score for the water refinement stage is calculated as follows: 1.0Evdw + 0.2Eelec + 1.0Edesolv + 0.01Eair. However, when pooling clusters from several runs, the restraint violation energy (Eair) should be excluded from the HADDOCK score.
As an example, 1D6R, a complex of Bovine trypsin and its inhibitor, has three clusters of templates. Docking with CA-CA restraints derived from the first template resulted in a correct cluster, but a cluster from docking based on the second template cluster was incorrectly chosen based on the average HADDOCK score. From Supplementary Table S5, we can see that the first template cluster has HADDOCK scores that are close to the second cluster, and it has better electrostatic energy scores. In such cases, both clusters should be considered and, ideally, additional information should be sought to discriminate between those models.
Discussion and conclusions
We systematically evaluated three TBM approaches for protein–protein complexes, including interfacial residue-guided docking (AIR-guided docking), interface CA-CA distance-guided docking and simple superimposition with refinement in explicit solvent. Our results show that CA-CA-guided docking significantly outperforms the other two template-based methods in terms of i-RMSDs, Fnat and number of clashes, when reliable templates in the bound state are available (also see Supplementary Tables S2 and S3 for the performance of the modeling approaches on each BM4 and CAPRI target).
CA-CA-guided docking can reliably model binding-induced conformational changes, provided these are also present in the selected template, and is especially suitable for interactions mediated through loop, flexible tail or disordered region, which is a prevalent interaction pattern observed in the solved structures in the PDB.
Our results also stress the importance of refinement, which is able to dramatically reduce the number of atomic clashes in the original superimposed models (also see Supplementary Table S4 for the refinement effects on superimposed models of each case in BM4).
In fact, all three stages of HADDOCK (it0, it1 and water refinement) gradually improve CA-CA model qualities (Supplementary Text 5).
Our interface CA-CA-guided docking protocol is highlighted in Box 2.
Box 2:
CA-CA-guided docking protocol
Prepare the input protein structures. If the protein structure(s) is not experimentally solved, model it using a homology modeling software, e.g. MODELLER [26] or I-TASSER [27].
Generate interface CA-CA distance restraint files using PS-HomPPI v1.3. PS-HomPPI v1.3 is an upgraded version of PS-HomPPI [16], in which the functionalities described in Box 1 have been added. Its beta server is available at http://ailab1.ist.psu.edu/PSHOMPPIv1.3/ (manuscript in preparation).
Run CA-CA-guided docking for each set of CA-CA restraints (in case of multiple templates or clusters thereof). Upload the query protein structures and the corresponding CA-CA restraint file to the HADDOCK web server, inputting the CA-CA restraints as unambiguous restraints. If additional experimental information regarding the target system is known (for example, interfacial residues determined by mutagenesis, conserved conformation of catalytic triad or conformational symmetry), define them in HADDOCK. Note: For highly intertwined targets, use small inter_rigid value, for example, 0.0001 (see discussions in Supplementary Text 3).
Select the final models. Pool all clusters from the various runs and compare their HADDOCK scores after removing the restraint energy term. Select the top-ranking cluster (the one with the lowest overall score). If several top clusters overlap within the variance of their average score, consider all of them and try finding additional information to decide on the best solution.
Visually check the final models.
We note that AIR-guided docking is still an indispensible modeling approach, although it does not outperform CA-CA-guided docking and superimposition in this study. AIR-guided docking is an especially valuable docking protocol when templates in the bound state are not available and only a few experimentally determined interfacial residues are known from the literature. The number of experimentally solved high-resolution structures of protein complexes is still limited (for BM4 dimers, templates could be found for only 68% of the cases). A variety of experimental techniques are available that allow probing or predicting protein interfaces in a relatively easy manner, e.g. mutagenesis, NMR chemical shift experiments and cross-linking mass spectrometry [28, 29]. Therefore, AIR-guided docking has a wider application range than template-based CA-CA-guided docking and superimposition; it has been frequently used by the HADDOCK group in past CAPRI competitions and proven to be successful [1].
Although threading, homology modeling and CA-CA-guided docking are all able to handle medium to large conformational changes (provided these also occurred in the template), CA-CA-guided docking has several advantages over the other two approaches. CA-CA-guided docking focuses primarily on the interface residues of the docked conformations, whereas threading and homology modeling focus on global alignment of the queries with the template. The major advantage of our protocol lies in obtaining reliable restraints to guide the flexible optimization of the interface. During CAPRI round 30, we (the HADDOCK group) in fact submitted models using homology modeling for T82 and T92. As can be seen from Supplementary Table S3, the CA-CA models consistently have better i-RMSDs than the submitted homology models. However, a more systematic analysis needs to be done to draw any concrete conclusions. Most importantly, HADDOCK-based CA-CA-guided docking is just a special case of distance-restrained docking; hence, it can be combined with any additional prior knowledge by defining other restraints, for example, to impose symmetry or to maintain the conformation of specific parts of the structure, such as a catalytic triad, cofactors and conserved interfacial water molecules, to further improve the quality of the resulting models. Recently, we applied our CA-CA-guided docking protocol to model the complex of SPINK6 with KLK4 with additional conserved catalytic triad position restraints to guide the docking. This effectively improved the conformation of the interaction loop of SPINK6 while keeping the conserved catalytic triad orientation, resulting in models satisfies the original NMR NOE restraints [30].
Finally, we note that we have been using in this work the best available templates. Systematically evaluating the impact of lower SID templates on the performance of CA-CA guided is beyond the scope of this study. Some of our predictions for CAPRI round 30 did, however, use templates with low SID ranging from 16% to 43%. For those, our CA-CA-guided docking method still outperformed other methods in most cases (Supplementary Table S3). Although the current version of PS-HomPPI uses BLASTP to retrieve templates, which, as a result, typically share high SID with the query, we plan to upgrade PS-HomPPI to exploit HHpred [31], which is able to reliably retrieve remote homologs, thus expanding the applicability of our approach.
Key Points
Superimposition often results in a large number of steric clashes, and most importantly, cannot account for conformational changes on binding.
CA-CA distances derived from the interfaces of templates can efficiently guide the docking process.
CA-CA-guided docking is superior to superimposition with refinement in terms of i-RMSD, Fnat and number of clashes.
CA-CA-guided docking is especially suitable for cases with medium to large conformational changes, whenever reliable templates are available.
Refinement of the superimposed models in explicit solvent dramatically reduced the number of steric clashes.
Supplementary Data
Supplementary data are available online at http://bib.oxfordjournals.org/. All data associated with this paper are available from the Structural Biology Data Grid with DOI: 10.15785/SBGRID/221.
Supplementary Material
Acknowledgements
The authors thank Dr Ezgi Karaca for providing the ab initio docking models on BM4, and Dr Anna Vangone for providing information about the CAPRI Round 30 HADDOCK predictions.
Funding
This work was supported by the Netherlands Organisation for Scientific Research (Veni grant 722.014.005 to L.C.X.); the National Institutes of Health [GM R33GM066387 to V.H. and D.D., UL1 TR000127 to Pennsylvania State University (PSU)]; and the Edward Frymoyer Professorship in the College of Information Sciences and Technology held by Vasant Honavar at PSU.
Li C. Xue is a postdoc fellow at Bijvoet Center for Biomolecular Research, Utrecht University, the Netherlands. Her research focuses on data mining and machine learning with an emphasis on computational structural biology, especially on predicting protein interfaces and modeling 3D macro-molecular complexes.
João P.G.L.M. Rodrigues studied Biochemistry at the University of Coimbra (PT) and obtained his PhD in Chemistry from Utrecht University (NL) in 2014. He is currently a postdoc at Stanford University.
Drena Dobbs has a PhD in Molecular Biology from the University of Oregon. She is currently a professor at the Department of Genetics, Development and Cell Biology, Iowa State University, USA.
Vasant Honavar has a PhD in Computer Science and Cognitive Science from the University of Wisconsin, Madison. He is currently a professor at College of Information Sciences and Technology, Pennsylvania State University, USA.
Alexandre M.J.J. Bonvin studied Chemistry at Lausanne University (CH) and obtained his PhD at Utrecht University (NL) in 1993. After two postdoc periods at Yale (USA) and the ETH Zurich (CH), he joined the faculty of Science of Utrecht University in 1998 where he was appointed full professor of Computational Structural Biology in 2009.
References
- 1. Lensink MF, Wodak SJ.. Docking, scoring, and affinity prediction in CAPRI. Proteins 2013;81(12):2082–95. [DOI] [PubMed] [Google Scholar]
- 2. Sinha R, Kundrotas PJ, Vakser IA.. Docking by structural similarity at protein-protein interfaces. Proteins 2010;78(15):3235–41. [DOI] [PMC free article] [PubMed] [Google Scholar]
- 3. Xue LC, Jordan RA, Yasser EM, et al. DockRank: Ranking docked conformations using partner‐specific sequence homology‐based protein interface prediction. Proteins 2014;82(2):250–67. [DOI] [PMC free article] [PubMed] [Google Scholar]
- 4. Ghoorah AW, Devignes M-D, Smaïl-Tabbone M, Ritchie DW.. Protein docking using case-based reasoning. Proteins 2013;81(12):2150–8. [DOI] [PubMed] [Google Scholar]
- 5. Mukherjee S, Zhang Y.. Protein-protein complex structure predictions by multimeric threading and template recombination. Structure 2011;19(7):955–66. [DOI] [PMC free article] [PubMed] [Google Scholar]
- 6. Lu L, Lu H, Skolnick J.. MULTIPROSPECTOR: an algorithm for the prediction of protein-protein interactions by multimeric threading. Proteins 2002;49(3):350–64. [DOI] [PubMed] [Google Scholar]
- 7. Sali A, Blundell TL.. Comparative protein modelling by satisfaction of spatial restraints. J Mol Biol 1993;234(3):779–815. [DOI] [PubMed] [Google Scholar]
- 8. Kuzu G, Gursoy A, Nussinov R, et al. Exploiting conformational ensembles in modeling protein-protein interactions on the proteome scale. J Proteome Res 2013;12(6):2641–53. [DOI] [PMC free article] [PubMed] [Google Scholar]
- 9. Aytuna AS, Gursoy A, Keskin O.. Prediction of protein-protein interactions by combining structure and sequence conservation in protein interfaces. Bioinformatics 2005;21(12):2850–5. [DOI] [PubMed] [Google Scholar]
- 10. Dominguez C, Boelens R, Bonvin A.. HADDOCK: a protein-protein docking approach based on biochemical or biophysical information. J Am Chem Soc 2003;125(7):1731–7. [DOI] [PubMed] [Google Scholar]
- 11. Rodrigues JPGLM, Melquiond ASJ, Karaca E, et al. Defining the limits of homology modeling in information‐driven protein docking. Proteins 2013;81(12):2119–28. [DOI] [PubMed] [Google Scholar]
- 12. Chen H, Skolnick J.. M-TASSER: an algorithm for protein quaternary structure prediction. Biophys J 2008;94(3):918–28. [DOI] [PMC free article] [PubMed] [Google Scholar]
- 13. Keskin O, Nussinov R.. Similar binding sites and different partners: implications to shared proteins in cellular pathways. Structure 2007;15(3):341–54. [DOI] [PubMed] [Google Scholar]
- 14. Kundrotas PJ, Vakser IA.. Global and local structural similarity in protein-protein complexes: implications for template-based docking. Proteins 2013;81(12):2137–42. [DOI] [PMC free article] [PubMed] [Google Scholar]
- 15. Szilagyi A, Zhang Y.. Template-based structure modeling of protein-protein interactions. Curr Opin Struct Biol 2014;24:10–23. [DOI] [PMC free article] [PubMed] [Google Scholar]
- 16. Xue LC, Dobbs D, Honavar V.. HomPPI: a class of sequence homology based protein-protein interface prediction methods. BMC Bioinformatics 2011;12(1):244. [DOI] [PMC free article] [PubMed] [Google Scholar]
- 17. Berman HM, Westbrook J, Feng Z, et al. The Protein Data Bank. Nucleic Acids Res 2000;28(1):235–42. [DOI] [PMC free article] [PubMed] [Google Scholar]
- 18. de Vries SJ, van Dijk M, Bonvin A.. The HADDOCK web server for data-driven biomolecular docking. Nat Protoc 2010;5(5):883–97. [DOI] [PubMed] [Google Scholar]
- 19. Méndez R, Leplae R, De Maria L, et al. Assessment of blind predictions of protein-protein interactions: current status of docking methods. Proteins 2003;52(1):51–67. [DOI] [PubMed] [Google Scholar]
- 20. Zhang Y, Skolnick J.. TM-align: a protein structure alignment algorithm based on the TM-score. Nucleic Acids Res 2005;33(7):2302–9. [DOI] [PMC free article] [PubMed] [Google Scholar]
- 21. Hwang H, Vreven T, Janin J, et al. Protein–protein docking benchmark version 4.0. Proteins 2010;78(15):3111–14. [DOI] [PMC free article] [PubMed] [Google Scholar]
- 22. Demšar J. Statistical comparisons of classifiers over multiple data sets. J Mach Learn Res 2006;7:1–30. [Google Scholar]
- 23. Satoo K, Noda NN, Kumeta H, et al. The structure of Atg4B-LC3 complex reveals the mechanism of LC3 processing and delipidation during autophagy. EMBO J 2009;28(9):1341–50. [DOI] [PMC free article] [PubMed] [Google Scholar]
- 24. Baspinar A, Cukuroglu E, Nussinov R, et al. PRISM: a web server and repository for prediction of protein-protein interactions and modeling their 3D complexes. Nucleic Acids Res 2014;42:W285–9. [DOI] [PMC free article] [PubMed] [Google Scholar]
- 25. Tuncbag N, Gursoy A, Nussinov R, et al. Predicting protein-protein interactions on a proteome scale by matching evolutionary and structural similarities at interfaces using PRISM. Nat Protoc 2011;6(9):1341–54. [DOI] [PMC free article] [PubMed] [Google Scholar]
- 26. Webb B, Šali A.. Comparative protein structure modeling using MODELLER. Curr Protoc Bioinformatics, John Wiley & Sons, Inc.2014;5.6.1–5.6.32. [DOI] [PubMed] [Google Scholar]
- 27. Zhang Y. I-TASSER server for protein 3D structure prediction. BMC Bioinformatics 2008;9(1):40. [DOI] [PMC free article] [PubMed] [Google Scholar]
- 28. Rodrigues JPGLM, Bonvin A.. Integrative computational modeling of protein interactions. Febs J 2014;281(8):1988–2003. Apr; [DOI] [PubMed] [Google Scholar]
- 29. van Ingen H, Bonvin A.. Information-driven modeling of large macromolecular assemblies using NMR data. J Magn Reson 2014;241:103–14. [DOI] [PubMed] [Google Scholar]
- 30. Jung S, Fischer J, Spudy B, et al. The solution structure of the kallikrein-related peptidases inhibitor SPINK6. Biochem Biophys Res Commun 2016;471(1):103–8. [DOI] [PMC free article] [PubMed] [Google Scholar]
- 31. Söding J, Biegert A, Lupas AN.. The HHpred interactive server for protein homology detection and structure prediction. Nucleic Acids Res 2005;33:W244–8. [DOI] [PMC free article] [PubMed] [Google Scholar]
- 32. The PyMOL Molecular Graphics System, Version 1.8 Schrödinger, LLC. [Google Scholar]
Associated Data
This section collects any data citations, data availability statements, or supplementary materials included in this article.