Abstract
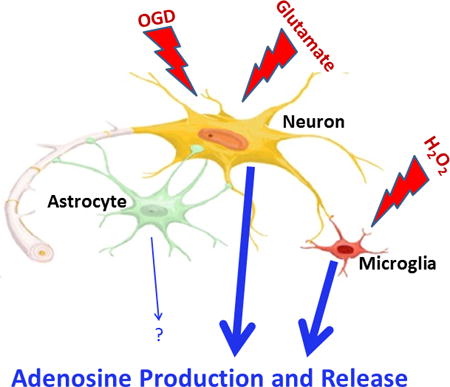
The early release of adenosine following traumatic brain injury (TBI) suppresses seizures and brain inflammation; thus, it is important to elucidate the cellular sources of adenosine following injurious stimuli triggered by TBI so that therapeutics for enhancing the early adenosine-release response can be optimized. Using mass spectrometry with 13C-labelled standards, we investigated in cultured rat neurons, astrocytes, and microglia the effects of oxygen-glucose deprivation (OGD; models energy failure), H2O2 (produces oxidative stress), and glutamate (induces excitotoxicity) on intracellular and extracellular levels of 5′-AMP (adenosine precursor), adenosine, and inosine and hypoxanthine (adenosine metabolites). In neurons, OGD triggered increases in intracellular 5′-AMP (2.8-fold), adenosine (2.6-fold), inosine (2.2-fold), and hypoxanthine (5.3-fold) and extracellular 5′-AMP (2.2-fold), adenosine (2.4-fold), and hypoxanthine (2.5-fold). In neurons, H2O2 did not affect intracellular or extracellular purines; yet glutamate increased intracellular adenosine, inosine, and hypoxanthine (1.7-fold, 1.7-fold, and 1.6-fold, respectively) and extracellular adenosine, inosine, and hypoxanthine (2.9-fold, 2.1-fold, and 1.6-fold respectively). In astrocytes, neither H2O2 nor glutamate affected intracellular or extracellular purines, and OGD only slightly increased intracellular and extracellular hypoxanthine. Microglia were unresponsive to OGD and glutamate, but were remarkably responsive to H2O2, which increased intracellular 5′-AMP (1.6-fold), adenosine (1.6-fold), inosine (2.1-fold), and hypoxanthine (1.6-fold) and extracellular 5′-AMP (5.9-fold), adenosine (4.0-fold), inosine (4.3-fold), and hypoxanthine (1.9-fold). Conclusion: Under these particular experimental conditions, cultured neurons are the main contributors to adenosine production/release in response to OGD and glutamate, whereas cultured microglia are the main contributors upon oxidative stress. Developing therapeutics that recruit astrocytes to produce/release adenosine could have beneficial effects in TBI.
Keywords: Neurons, Astrocytes, Microglia, 5′-AMP, Adenosine, Inosine, Hypoxanthine
Graphical abstract
The early release of adenosine following traumatic brain injury (TBI) suppresses seizures and brain inflammation. Using mass spectrometry we investigated in cultured neurons, astrocytes, and microglia the effects of oxygen-glucose deprivation (OGD; models energy failure), H2O2 (produces oxidative stress), and glutamate (induces excitotoxicity) on intracellular and extracellular levels of 5′-AMP (adenosine precursor), adenosine, and inosine and hypoxanthine (adenosine metabolites). Neurons responded to OGD and excitotoxicity; microglia responded to oxidative stress; and astrocytes were mostly unresponsive. Developing therapeutics that recruit astrocytes to produce/release adenosine could have beneficial effects in TBI.
Introduction
Our previous studies show that traumatic brain injury (TBI) rapidly increases extracellular adenosine levels in the central nervous system in both animals and humans (Bell et al. 1998, Bell et al. 2001, Robertson et al. 2001), and our subsequent experiments support the concept that this early adenosine-release response activates A1 receptors to suppress both seizures and brain inflammation. For example, we noted seizure activity in 83% of male and 100% of female A1 receptor knockout (A1−/−) mice in the initial 2 hours after controlled cortical impact injury (an experimental model of TBI), whereas only 33% of male and 25% of female wildtype (A1+/+) mice experienced seizures (which were brief, i.e., 1 to 2 seconds) (Kochanek et al. 2006). Moreover, we observed that controlled cortical impact injury induced sustained (>1 hour) and lethal tonic and clonic activity (i.e., status epilepticus) in 50% of male and 83% of female A1−/− mice, yet did not cause status epilepticus in A1+/+ mice, regardless of sex. Our follow-up studies showed that early activation of the adenosine-A1 receptor axis serves as a brake on the microglial response after TBI in mice (Haselkorn et al. 2010), which suggests a role for the early adenosine-release response for suppressing brain inflammation. Given the importance of rapid activation of the adenosine-A1 receptor axis in determining outcomes in TBI, it is critical to gain an in-depth understanding of the cellular sources of the adenosine produced and released soon after injurious stimuli triggered by TBI so that therapeutic approaches for enhancing and prolonging the early adenosine-release response can be optimized.
Although adenosine biosynthesis and physiology has been studied extensively in synaptosomal preparations (Cunha 2001), at present, investigators have only partially explored the role of different types of injurious stimuli related to TBI on intact brain cells to generate adenosine, and the extant published studies have limitations. In this regard, several studies used mixed cortical cells with undefined cell populations (Lobner & Choi 1994, Lynch et al. 1998, Lobner 2002), whereas only a few studies used purified neurons (Parkinson & Xiong 2004, Lu et al. 2003) or astrocytes (Parkinson & Xiong 2004). Also, most studies examined the effects of injurious stimuli on adenosine only. The most comprehensive study with respect to the number of adenosine metabolites measured, the range of injurious stimuli, and the inclusion of both neurons and astrocytes employed the semi-quantitative method of thin layer chromatography to detect a radiolabeled purine pool (Parkinson & Xiong 2004).
Given the importance of understanding which brain cells form and release adenosine and which injurious stimuli are most efficacious in this regard, we set out to improve our knowledge in this area of inquiry by investigating the effects of injurious stimuli on the production of 5′-AMP (adenosine precursor), adenosine, and inosine and hypoxanthine (adenosine metabolites) by specific brain cells. Our working hypothesis was that the production and release of 5′-AMP, adenosine, and adenosine metabolites depend on both the specific brain cell type and the specific type of injurious stimulus. In order to separate the contributions from different types of brain cells, we conducted experiments in highly enriched primary cultures of neurons, astrocytes, and microglia. We measured both extracellular and intracellular purines in order to determine to what extent changes in intracellular levels translated to changes in extracellular levels. Because energy failure (Kilbaugh et al. 2015), oxidative stress (Sparvero et al. 2010), and excitotoxicity (Ruppel et al. 2001) are key injurious stimuli triggered by TBI, we examined the effects of oxygen-glucose deprivation (OGD) to model energy failure, H2O2 to increase oxidative stress, and glutamate to induce excitotoxicity. Moreover, these experiments were performed using the most sensitivity and specific analytical technique for measuring purines, i.e., ultra-performance liquid chromatography-triple quadrupole mass spectrometry (LC-MS/MS) in which each purine of interest was quantified using selected reaction monitoring with corresponding heavy-isotope labeled internal standards.
Methods
Animals
Pregnant Sprague-Dawley rats were obtained from Charles River Laboratories (Wilmington, MA). All procedures involving animals were approved by the Institutional Animal Care and Use Committee of the University of Pittsburgh and in accordance with the National Institutes of Health Guide for the Care and Use of Laboratory Animals.
Neuronal Cultures
Cortical neurons were harvested from E16-E18 Sprague-Dawley rat embryos as previously described by us (Jackson et al. 2010). Briefly, both male and female embryonic brains were isolated, trypsinized, triturated, and seeded onto 10-cm poly-D-lysine culture plates (BD Biosciences, San Jose, CA). Neurons were grown in Neurobasal medium (Life Technologies, Grand Island, NY) containing B27 supplement, 0.5 mM glutamine, 100 U/ml of penicillin, and 100 μg/ml streptomycin. Neurons (95% pure) were maintained by one-half medium exchange three and five days after culture. Experiments were conducted on day in vitro 6 (DIV 6) for two reasons. First, although isolated embryonic neural cells quickly acquire adult morphology and functional characteristics in culture (Brewer et al. 1993, Lin et al. 2002), DIV6 neurons model the young brain (Rebola et al. 2005), which is desirable since TBI occurs frequently in the pediatric population. Second, DIV6 neurons are less likely to be contaminated by glial proliferation.
Astrocyte Cultures
Astrocytes were harvested using our previously published protocol (Verrier et al. 2011). Briefly, brains were isolated from male and female postnatal day 1–2 Sprague-Dawley rat pups. The tissue was isolated, trypsinized, triturated, and seeded onto 75 cm2 tissue culture flasks. Cells were grown to 90–95% confluence in DMEM/F12/10% fetal bovine serum, and 100 U/ml of penicillin and 100 μg/ml streptomycin. Experiments were conducted in 10-cm poly-D-lysine culture plates after several propagations to select astrocytes only.
Microglia Cultures
Primary microglial cultures were isolated from postnatal day 1–2 male and female Sprague-Dawley rat pups using a modification of the method described by Ni and Aschner (Ni & Aschner 2010). In brief, microglia cultures were harvested following the same protocol used to harvest astrocytes, except that the resulting brain cell mix was plated onto 225-cm2 flasks (about four to six brains per flask). Cells were plated and grown in DMEM/F12/10% fetal bovine serum, and 100 U/ml of penicillin and 100 μg/ml of streptomycin. The flasks were left untouched for the first week following culture, then given complete medium exchange every two to three days for two weeks. Three weeks after culture, cells were given a complete medium exchange and flasks were shaken at low speed for eight minutes resulting in the dissociation of microglia cells from the flask into the media. The media was collected and centrifuged for 5 minutes at 200 g and 4°C. Microglia were plated onto 35-mm poly-D-lysine culture plates at a density of 500,000 cells per plate. Experiments were performed one day after plating to avoid growth of astrocytes.
Validation of Cell-Type Enrichment in Primary CNS Cultures
DIV6 neurons, DIV1 microglia, and confluent monolayer astrocytes were harvested in RIPA buffer supplemented with EDTA and protease/phosphatase inhibitors. Protein concentrations were analyzed by the Pierce BCA Protein Assay Kit (ThermoFisher Scientific, Waltham, MA). Fifteen μg of protein per lane was loaded onto gradient SDS-PAGE gels and processed for western blotting, as previously described by us (Jackson et al. 2015b), using markers for neurons (NeuN rabbit monoclonal antibody, 1:5000, Cell Signaling Technology, Danvers, MA; catalogue number 12943; AB_2630395), astrocytes (GFAP mouse monoclonal antibody, 1:15,000, Cell Signaling Technology; catalogue number 3670; AB_10694390), and microglia (Iba-1 rabbit polyclonal antibody, 1:15,000, Proteintech, Rosemont, IL; catalogue number 10904-1-AP; AB_2224377). Total protein was measured across groups to control for loading error by treatment with reversible Swift-Membrane Stain (G-Biosciences, St. Louis, MO) prior to incubation with primary antibodies. We reported that protein loading controls (e.g. α-tubulin) are unreliable markers of loading error if comparing multiple CNS cell types on the same blot due to cell-type specific differences in gene expression at baseline. In contrast, total membrane stain accurately measures equal loading across wells independent of gene expression differences (Jackson et al. 2015a). In addition to validation by western blotting, each cell type was examined by immunofluorescence as previously described by us (Jackson et al. 2015a) using primary antibodies for microglia (anti-Iba-1;1:500), astrocytes (anti-GFAP; 1:5000) and neurons (anti-NeuN; 1:200). The primary antibodies were the same as described for western blotting. The secondary antibodies were Alexa Fluor 594, Goat Anti-Rabbit (1:500, signal red, ThermoFisher Scientific; catalogue number A-11037; AB_2534095) and Alexa Fluor 488, Goat Anti-Mouse (1:500, signal green, ThermoFisher Scientific; catalogue number A-11029; AB_2534088).
H2O2 Injury
On the day of the experiment, growth medium was aspirated off of the cells and pre-warmed control media (NaCl, 137 mM; KCl, 5.36 mM; CaCl2, 1.26 mM; MgCl2, 0.49 mM; MgSO4, 0.41 mM; HEPES, 10 mM; KH2PO4, 0.44 mM; NaHCO3, 4.17 mM; Na2HPO4, 0.34 mM; D-glucose, 5 mM; pH 7.4) or pre-warmed injury medium (control media plus 40 μM of H2O2) was added to the plates (3 ml of medium for 10-cm plate experiments; 1 ml of medium for 35-mm plate experiments). Plates were then placed in a 37°C/5% CO2 incubator for one hour. After one hour of incubation the control/injury medium (extracellular fraction) was collected and boiled for 90 seconds (to inactivate enzymes) and then stored at −80°C. Further processing of the cells for analysis of the intracellular fraction is described below in “Preparation of Samples for Analysis”. As quantified by Lei and coworkers (Lei et al. 1997) using microdialysis probes, the levels of H2O2 in brain tissue following ischemia-reperfusion are elevated for approximately 1 hour with (correcting for probe recoveries) time-averaged levels of H2O2 of approximately 40 to 50 μM. Also, previously we observed neuronal cell death with 40 μM H2O2 (Jackson et al. 2013), and Ma and coworkers reported that 50 μM H2O2 induces oxidative stress in DIV6 cortical neurons (Ma et al. 2014). Therefore in the current study we selected 40 μM H2O2 as the best approximation of a pathophysiological relevant and oxidative stress-inducing level of H2O2.
Glutamate Injury
On the day of the experiment, growth medium was aspirated off the cells and pre-warmed control medium (DPBS, Gibco #14287) or pre-warmed injury medium (control media plus 10 μM L-glutamate) was added to the plates (3 ml of medium for 10-cm plate experiments; 1 ml of medium for 35-mm plate experiments). Plates were then placed in a 37°C/5% CO2 incubator for one hour. After one hour of incubation the control/injury medium (extracellular fraction) was collected and boiled for 90 seconds and then stored at −80°C. Further processing of the cells for analysis of the intracellular fraction is described below in “Preparation of Samples for Analysis”. As quantified by Timofeev and coworkers (Timofeev et al. 2011) using microdialysis probes, the levels of glutamate in severe brain injury can achieve 10 μM. Therefore in the current study we chose this concentration of glutamate.
Oxygen-Glucose Deprivation (OGD) Injury
To allow for oxygen equilibration of the media, on the day before experiments, control medium (DPBS, Gibco #14287) and injury medium (DPBS, Gibco #14040 with 0.327 mM of sodium pyruvate added and no glucose) were placed in a 37°C/5% CO2 incubator and a 37°C/5% CO2/0.2% O2 incubator, respectively. On the day of the experiment, growth medium was aspirated off of the cells and the equilibrated control medium or injury medium was added to the plates (3 ml of medium for 10-cm plate experiments; 1 ml of medium for 35-mm plate experiments). Plates were then placed in their respective incubators for one hour. After one hour incubation the control/injury medium (extracellular fraction) was collected and boiled for 90 seconds and then stored at −80°C. Further processing of the cells for analysis of the intracellular fraction is described below in “Preparation of Samples for Analysis”. We chose 0.2% oxygen with no glucose as the injurious stimuli to mimic brain ischemia/anoxia in which loss of blood flow denies brain tissue of both oxygen and glucose.
Lactic Acid Dehydrogenase (LDH) Release
LDH was measured in the culture medium one hour after injurious stimuli using the Abcam LDH Cytotoxicity Kit II (Abcam, Cambridge, MA; catalogue number ab65393,) with modifications. In this regard, we obtained lyophylized LDH from EMD Millipore (Billerica, MA; catalogue number 427217-25KU) and prepared a standard curve in which LDH activity was linearly regressed against LDH protein concentrations (mg/ml). Form this standard curve, LDH protein concentrations in experimental samples were interpolated using GraphPad Prism (GraphPad Software; La Jolla, CA). This approached confirmed that the assay indeed detected LDH and did so in a linear fashion, and provided an absolute standard for future comparisons.
Preparation of Samples for Purine Analysis by LC-MS/MS
Purines (5′-AMP, adenosine, inosine, and hypoxanthine) were measured by LC-MS/MS in both the culture medium (extracellular purines) and in the extracted cells (intracellular purines). The culture medium was collected and 13C-labeled 5′-AMP, adenosine, inosine, and hypoxanthine (Medical Isotopes Inc., Pelham, NH) were directly added to the culture medium. Cell monolayers were extracted by adding a mix of ice-cold acetonitrile:methanol:water (1:2:2) (1 to 3 ml) immediately after removal of the control/injury medium. Cells were scraped, collected, sonicated, heated in a 60°C water bath for 10 minutes (to denature enzymes), and stored at −80°C for further processing. Samples were then thawed and centrifuged at 3000 g for 90 minutes and 4°C to pellet cellular debris. The supernatant was then transferred to a new tube and the cell pellet was washed with additional acetonitrile:methanol:water (0.5 to 2 ml) to further extract remaining purines. Samples were centrifuged again and the supernatant was added to the supernatant from the previous step. The supernatant containing purines was then taken to dryness and reconstituted in H2O. The reconstituted sample was passed through a 30-kDa cutoff filter, and heavy isotope internal standards were added to the collected H2O. Recovery of purines with this procedure was quantitative (approximately 96%) as assessed by examining the signal from internal standards added to samples before or after processing.
LC-MS/MS
Purines in medium and cell extracts were measured as previously described (Jackson et al. 2009) with modifications using LC-MS/MS. Purines were resolved by reversed-phase liquid chromatography (Waters UPLC BEH C18 column, 1.7 μm beads; 2.1 × 150 mm; Milford, MA) and assayed using a triple quadrupole mass spectrometer (TSQ Quantum-Ultra; ThermoFisher Scientific, San Jose, CA) operating in the selected reaction monitoring mode with a heated electrospray ionization source. The mobile phase consisted of linear gradient of 1% acetic acid in water (pH, 3; mobile phase A) and 100% methanol (mobile phase B). The mobile phase flow rate was 300 uL/minute and was delivered with a Waters Acquity ultra-performance liquid chromatographic system. The gradient (A/B) was: from 0 to 2 minutes, 99.6%/0.4%; from 2 to 3 minutes, to 98.0%/2.0%; from 3 to 4 minutes, to 85.0%/15.0%; from 4 to 6.5 minutes, to 99.6%/0.4%. Instrument settings were: sample tray temperature, 10°C; column temperature, 50°C; ion spray voltage, 4.0 kilovolts; ion transfer tube temperature, 350°C; source vaporization temperature, 320°C; Q2 CID gas, argon at 1.5 mTorr; sheath gas, nitrogen at 60 psi; auxillary gas, nitrogen at 35 psi; Q1/Q3 width, 0.7/0.7 units full-width half-maximum; scan width, 0.6 units; scan time, 0.01 seconds.
Assessment of Basal Energy Charge in Neurons, Astrocytes, and Microglia
We found that mobile phases that provided good chromatographic peak morphologies for ATP and ADP severely suppressed ionization in the ion source, and mobile phases that did not suppress ionization gave poor peak shapes for ATP and ADP (i.e., severe tailing). Therefore, to address the basal cellular energy charges [(ATP+ 1/2ADP)/(ATP+ADP+5′-AMP)] for neurons, astrocytes, and microglia, we developed a high pressure liquid chromatography-ultraviolet absorbance (HPLC-UV) assay. In this regard, aliquots of cell extracts were treated with 1-butanol, and the aqueous phase was collected, dried, and reconstituted in 0.15 M KH2PO4 (pH 6.2). Analyses of ATP, ADP and 5′-AMP were performed by HPLC with a C-18 reverse phase column (Agilent Prep-C18 Scalar, 5 μm, 100 × 4.6 mm) protected by a guard cartridge in gradient mode [buffer A: 0.15 M KH2PO4 (pH 6.2) in water; buffer B: 0.15 M KH2PO4 (pH 6.2) in 15% acetonitrile; linear gradient (%B): at 0 minutes 3.0%; from 0 to 9 minutes to 9.0%; from 9 to 25 minutes to 100.0%; from 25 to 30 minutes, 100.0%; from 30 to 31 minutes to 3.0%; from 31 to 35 minutes, 3.0%. The flow rate was 0.8 ml/minute. Adenine nucleotides in the eluate were monitored with diode array detector at 259 nm. The HPLC system was a HP Agilent Technologies 1100 series HPLC chromatograph equipped with a diode array detector (model G1315B) and autosampler (model G1313A).
Statistical Analysis
The total amount of analyte in the medium (extracellular) and total amount of analyte in the final reconstituted cell extracts (intracellular) were normalized to cell number (ng/106 cells). The analysis of purines was performed by an analytical chemist who was blinded to the treatment groups. Each sample (experimental unit) was a separate batch of cells from a batch of embryos or pups. Each experimental unit was divided into two paired plates of cells, i.e., a control plate of cells and a treated plate of cells (treatments randomly allocated). Therefore, these data were analyzed with a 2-tailed paired Student’s t-test. Sample size was selected to detect at least a 25% change induced by the stimulus with a power of >80%. We also compared the hypoxanthine-to-inosine ratios in neurons versus astrocytes and neurons versus microglia using a non-parametric Mann-Whitney U test. Statistical and power analyses were performed using the Number Cruncher Statistical Systems, Kaysville, Utah (NCSS 2004 for statistical comparisons and PASS 2005 for power analysis). The criterion of significance was p<0.05. All values in the text and figures are means ± SEM.
Results
Validation of Cell-Type Enrichment in Primary CNS Cultures
As illustrated in Figure 1, the neuronal marker NeuN was detected in DIV6 cortical neurons but was absent in microglia and astrocytes. The astrocyte marker GFAP was absent in neurons, abundant in astrocytes, and only faintly detected in microglia enriched cultures. The microglia marker Iba-1 was absent in neurons and astrocytes but abundant in microglia. The morphology and purity of our cultured neurons, astrocytes, and microglia are illustrated by the immunofluorescence images shown in Figure 2. These data indicate that cell cultures used in this study were highly enriched.
Figure 1.
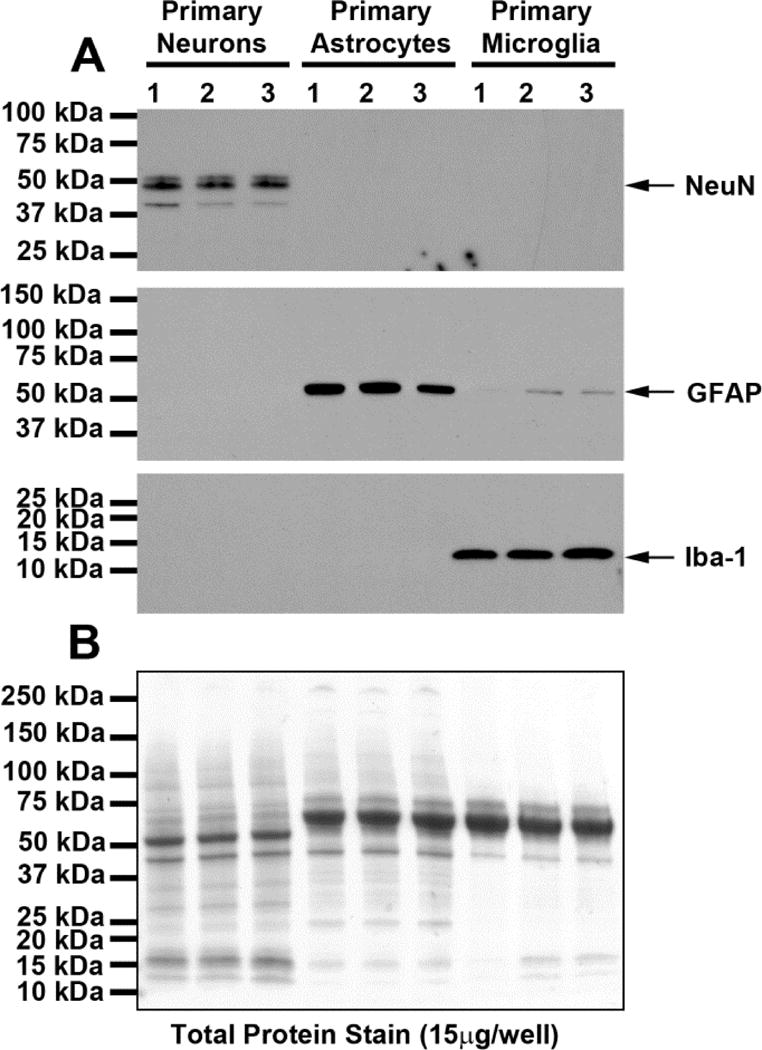
Western blots (A) show chemiluminescent signals obtained when protein extracts from neurons, astrocytes, and microglia where processed using primary antibodies against NeuN (neuronal marker), GFAP (astrocyte marker), or Iba-1 (microglia marker). The neuronal marker NeuN was detected in DIV6 cortical neurons but was absent in microglia and astrocytes. The astrocyte marker GFAP was absent in neurons, abundant in astrocytes, and only faintly detected in microglia enriched cultures. The microglia marker Iba-1 was absent in neurons and astrocytes but abundant in microglia. Total protein was measured across groups to control for loading error by treatment with reversible Swift-Membrane Stain (G-Biosciences, St. Louis, MO) prior to incubation with primary antibodies. Total protein loading was similar across all lanes (densitometry results: 2003744, 1921877, 2034817, 1777530, 1873519, 2082085, 1767081, 1594624, 1516022 for lanes left to right, respectively). These data indicate that the cell cultures used in this study were highly enriched.
Figure 2.
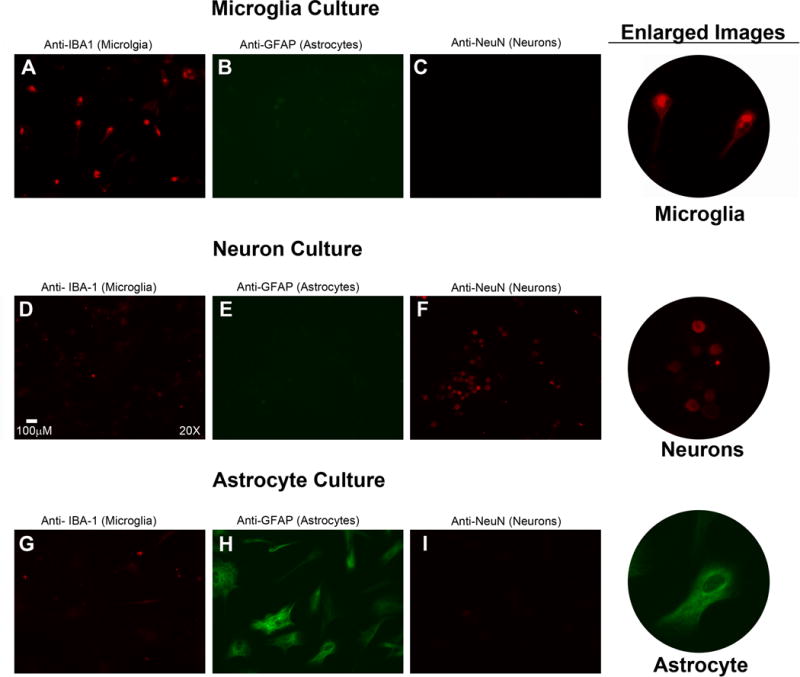
In addition to validation by western blotting, each cell type was examined by immunofluorescence as previously described by us (Jackson et al. 2015a) using primary antibodies for microglia (rabbit polyclonal anti-Iba-1), astrocytes (mouse monoclonal anti-GFAP), and neurons (rabbit monoclonal anti-NeuN). The primary antibody used (along with the cell type that this antibody detects) is listed above each panel. For panels A, C, D, F, G, and I the secondary antibody was Alexa Fluor 594, goat anti-rabbit (signal red). For panels B, E, and H the secondary antibody was Alexa Fluor 488, goat anti-mouse (signal green). Thus, the signal for microglia in panels A, D, and G is red; the signal for astrocytes in panels B, E, and H is green; and the signal for neurons in panels C, F, and I is red. Microglia (A) cultures contained many Iba-1 positive cells; whereas Iba-1 positive cells in neuron (B) and astrocyte (C) cultures were infrequent. Astrocyte (H) cultures showed many GFAP positive cells; whereas microglia (B) and neuron (E) cultures did not. Neuron (F) cultures demonstrated many NeuN positive cells; whereas microglia (C) and astrocyte (I) cultures did not. Enlarged images of Iba-1 positive microglia, NeuN positive neurons, and GFAP positive astrocytes are shown in the far right column. These data confirm that cell cultures used in this study were highly enriched.
Basal Energy Charge of Cultured Neurons, Astrocytes, and Microglia
To assess whether cultured neurons, astrocytes, and microglia were healthy and under similar energy charge conditions, we measured intracellular levels of ATP, ADP, and 5′-AMP simultaneously by HPLC-UV and calculated energy charge using the following equation: [(ATP+ 1/2ADP)/(ATP+ADP+AMP)]. Basal intracellular levels of ATP, ADP and 5′-AMP were (pmoles/106 cells): in neurons (n=4), 5055 ± 668, 455 ± 59, and 40 ± 7 pmol/106 cells, respectively; in astrocytes (n=3), 5121 ± 395, 911 ± 46, and 224 ± 14 respectively; in microglia (n=5), 1686 ± 69, 169 ± 9, and 174 ± 10 respectively. The calculated basal energy charges for all three cell types were very high and similar (95.2 ± 0.1, 89.1 ± 0.3, and 87.3 ± 0.2 % for neurons, astrocytes, and microglia, respectively).
Lactic Acid Dehydrogenase (LDH) Release
In the experiments described below we subjected cells to injurious stimuli for only one hour. As shown in Figure 3, when LDH in the medium was measured immediately after the one-hour exposure to injurious stimuli, none of the injurious stimuli increased LDH release into the medium regardless of cell type. These data indicated that cell membranes were intact at the time of assessing purine production. As a positive control to ensure that our LDH assay was working properly, we incubated neurons in medium without or with 40 μM H2O2 for 1 hour, then placed the cells in medium not containing H2O2, waited 24 hours and finally assayed for LDH. In this experiment, neurons treated with 40 μM H2O2 for 1 hour had an approximate 2.6-fold increase in LDH levels 24 hours after the 1 hour treatment compared to cells incubated for 24 hours but never treated with H2O2 (0.00105 ± 0.000007 and 0.002781 ± 0.000143 mg/ml in control versus H2O2-treated cells, respectively). These results indicated the LDH assay was functioning properly and that given sufficient time after short exposure to 40 μM H2O2 neurons ultimately demonstrated damage to cell membranes.
Figure 3.
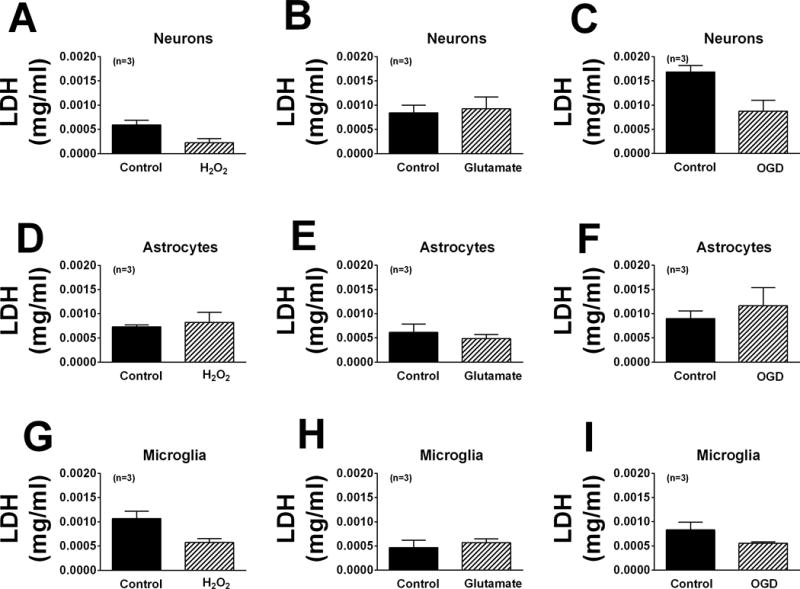
Bar graphs illustrate the amount of lactic acid dehydrogenase (LDH) in the medium of neurons (A–C), astrocytes (D–F) and microglia (G–I) treated without or with H2O2 (40 μM; A, D, G), glutamate (10 μM; B, E, H) or OGD (C, F, I). None of the injurious stimuli increased LDH release compared with untreated cells.
Studies in Neurons
In neurons, oxidative stress induced by H2O2 (40 μM for one hour) did not affect significantly extracellular or intracellular levels of 5′-AMP, adenosine, inosine, or hypoxanthine (Figure 4). However, induction of excitotoxicity with glutamate (10 μM for one hour) induced a 2.9-fold (p<0.0001), 2.1-fold (p=0.0097), and 1.6-fold (p=0.0845; near significant) increase, respectively, in extracellular adenosine, inosine, and hypoxanthine. Also glutamate induced a 1.7-fold (p=0.0325), 1.7-fold (p=0.0124), and 1.6-fold (0.0251) increase in intracellular adenosine, inosine, and hypoxanthine, respectively (Figure 5). One-hour with OGD also broadly affected purines in neurons. In this regard, OGD caused a 2.2-fold (p=0.0151) increase in extracellular 5′-AMP, a 2.4-fold (p=0.0023) increase in extracellular adenosine, and a 2.5-fold (p=0.0054) increase in extracellular hypoxanthine (Figure 6). OGD also augmented intracellular 5′-AMP by 2.8-fold (p=0.0033), intracellular adenosine by 2.6-fold (p=0.0255), intracellular inosine by 2.2-fold (p=0.0224), and intracellular hypoxanthine by 5.3-fold (p=0.0286) (Figure 6).
Figure 4.
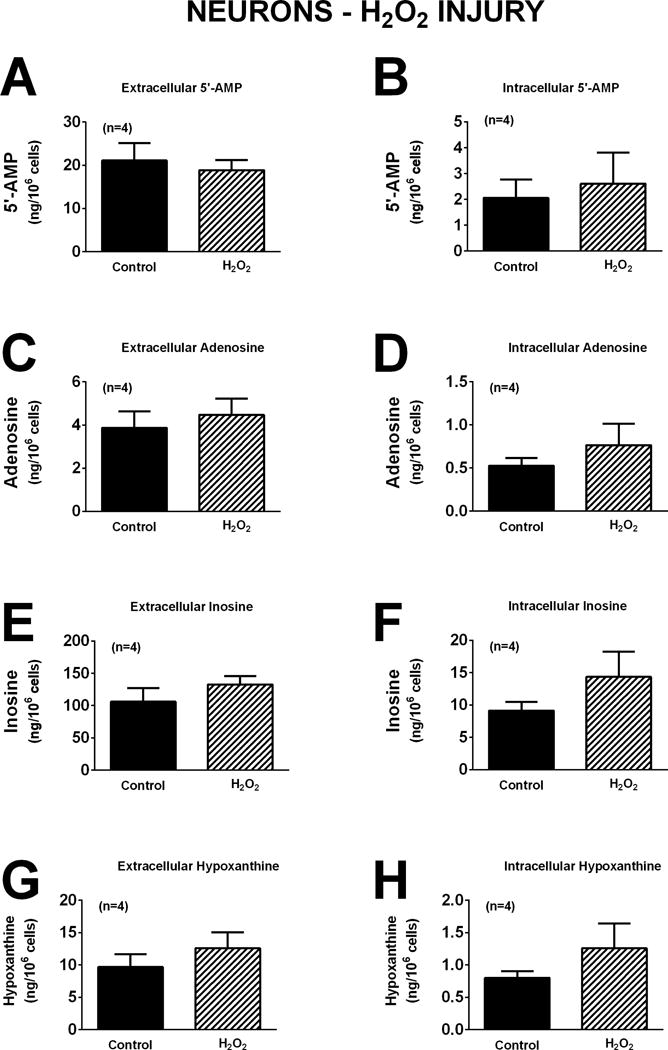
Bar graphs depict the effects of H2O2 (40 μM) for one hour on extracellular levels of 5′-AMP (A), adenosine (C), inosine (E), and hypoxanthine (G) and intracellular levels of 5′-AMP (B), adenosine (D), inosine (F), and hypoxanthine (H) in neurons. Values represent mean ± SEM.
Figure 5.
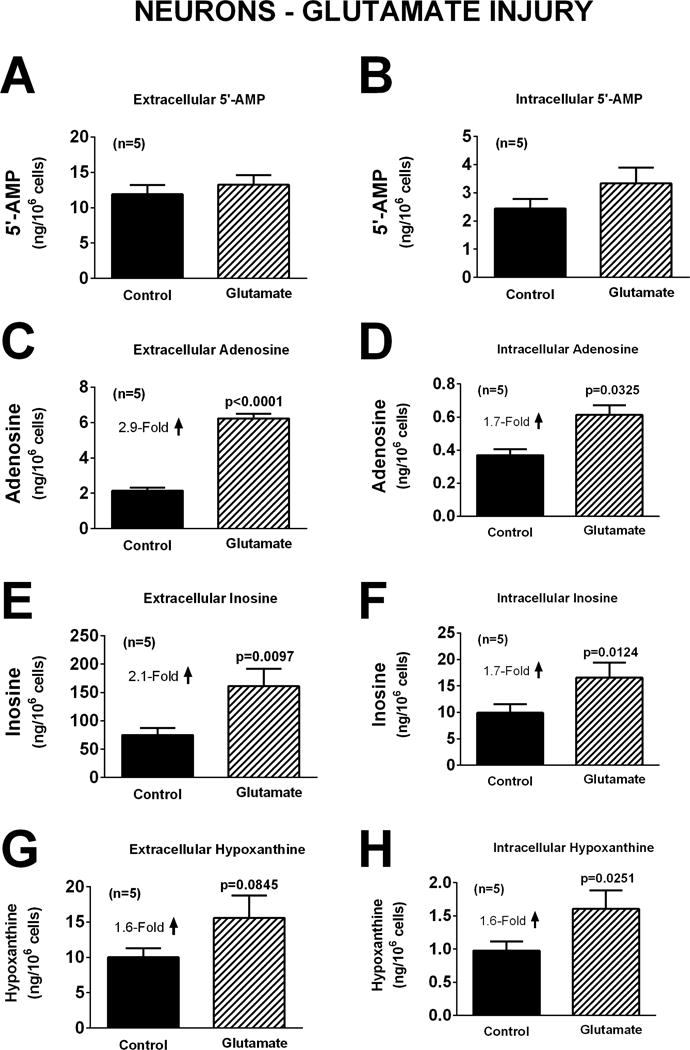
Bar graphs depict the effects of glutamate (10 μM) for one hour on extracellular levels of 5′-AMP (A), adenosine (C), inosine (E), and hypoxanthine (G) and intracellular levels of 5′-AMP (B), adenosine (D), inosine (F), and hypoxanthine (H) in neurons. Values represent mean ± SEM.
Figure 6.
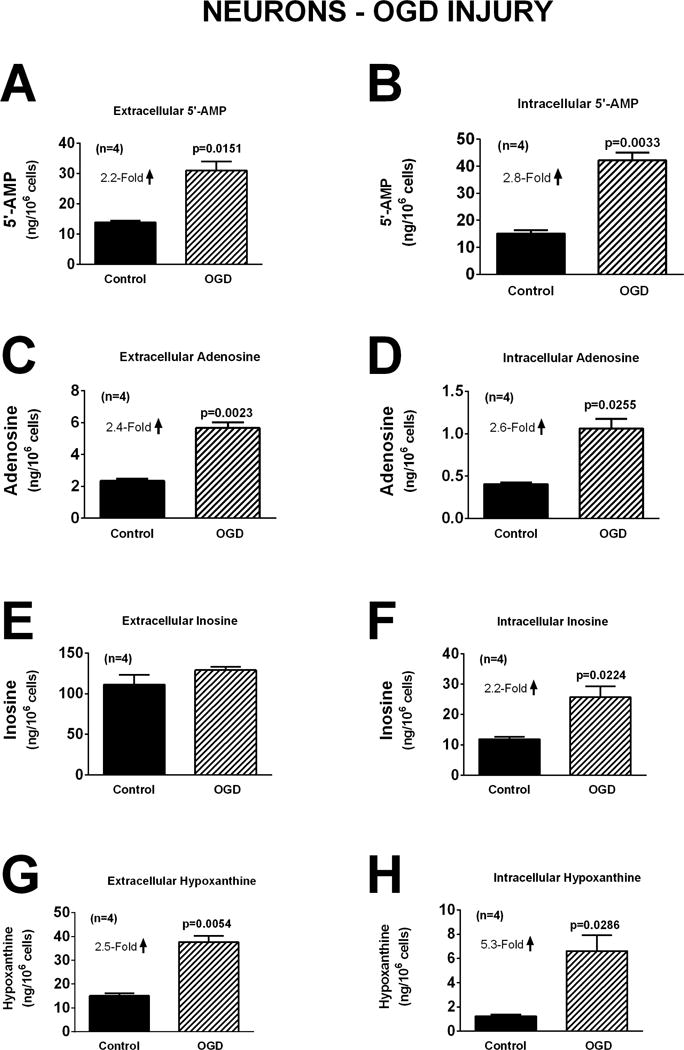
Bar graphs depict the effects of oxygen and glucose deprivation (OGD; 0.2% oxygen with zero glucose) for one hour on extracellular levels of 5′-AMP (A), adenosine (C), inosine (E), and hypoxanthine (G) and intracellular levels of 5′-AMP (B), adenosine (D), inosine (F), and hypoxanthine (H) in neurons. Values represent mean ± SEM.
Studies in Astrocytes
As in neurons, oxidative stress induced by H2O2 did not affect significantly either extracellular or intracellular levels of 5′-AMP, adenosine, inosine, or hypoxanthine (Figure 7). Although glutamate increased extracellular adenosine, inosine and hypoxanthine in neurons (Figure 5), in astrocytes glutamate had no significant effect on either extracellular or intracellular 5′-AMP, adenosine, inosine, or hypoxanthine (Figure 8). In astrocytes OGD did not affect extracellular or intracellular 5′-AMP, adenosine, or inosine (Figure 9). OGD did, however, cause a small, but statistically significant, increase in extracellular [1.7-fold (p=0.0298)] and intracellular [1.4-fold (p=0.0232)] hypoxanthine (Figure 9).
Figure 7.
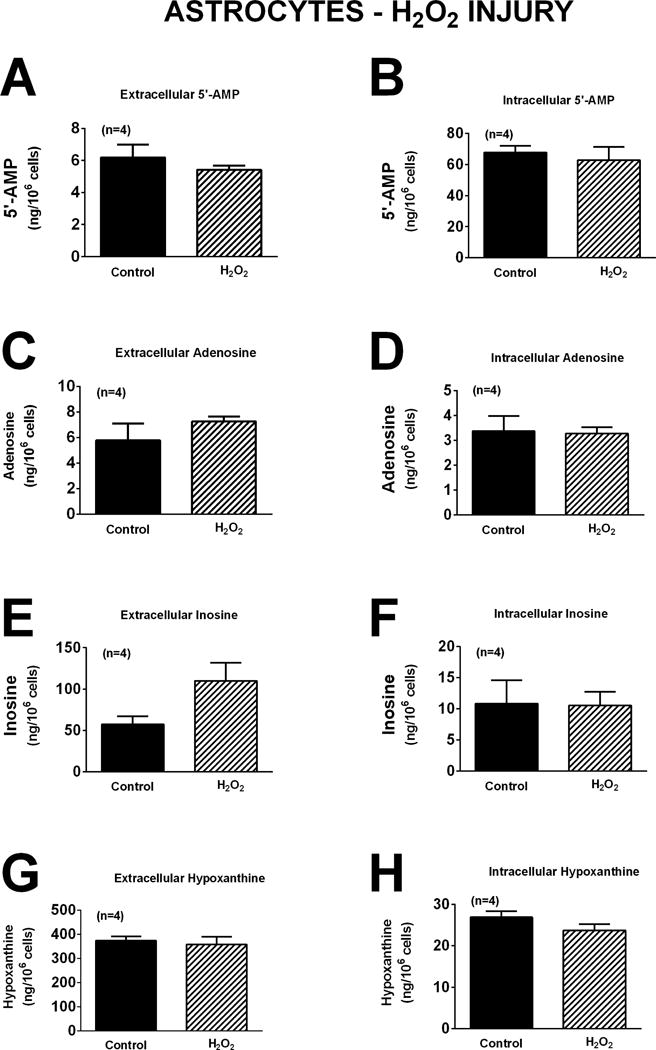
Bar graphs depict the effects of H2O2 (40 μM) for one hour on extracellular levels of 5′-AMP (A), adenosine (C), inosine (E), and hypoxanthine (G) and intracellular levels of 5′-AMP (B), adenosine (D), inosine (F), and hypoxanthine (H) in astrocytes. Values represent mean ± SEM.
Figure 8.
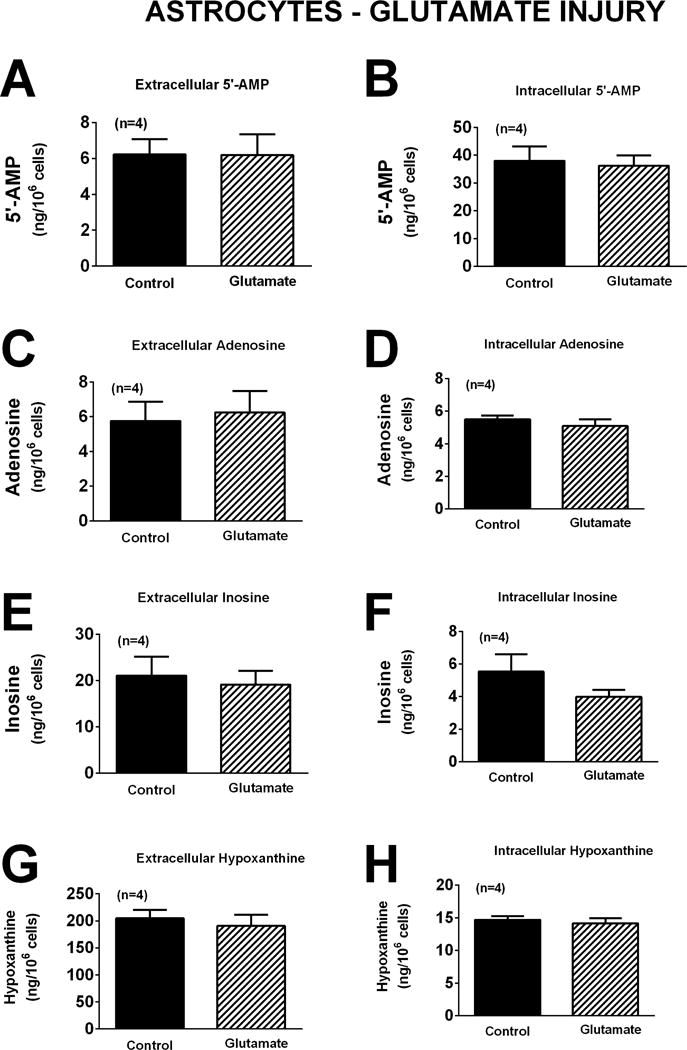
Bar graphs depict the effects of glutamate (10 μM) for one hour on extracellular levels of 5′-AMP (A), adenosine (C), inosine (E), and hypoxanthine (G) and intracellular levels of 5′-AMP (B), adenosine (D), inosine (F), and hypoxanthine (H) in astrocytes. Values represent mean ± SEM.
Figure 9.
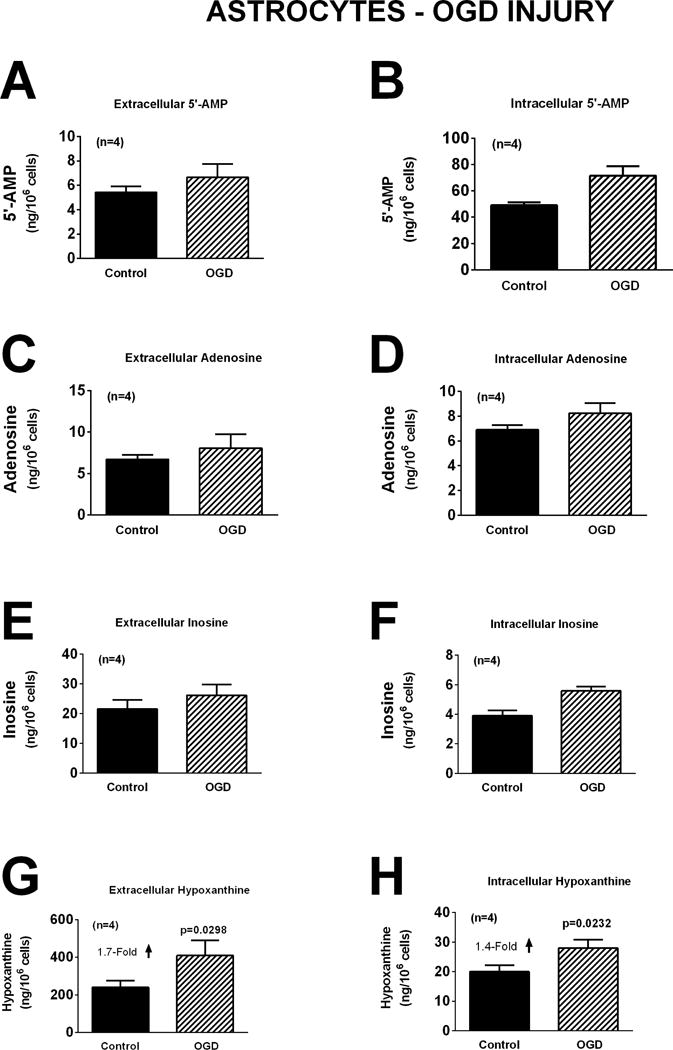
Bar graphs depict the effects of oxygen and glucose deprivation (OGD; 0.2% oxygen with zero glucose) for one hour on extracellular levels of 5′-AMP (A), adenosine (C), inosine (E), and hypoxanthine (G) and intracellular levels of 5′-AMP (B), adenosine (D), inosine (F), and hypoxanthine (H) in astrocytes. Values represent mean ± SEM.
Studies in Microglia
The response of microglia to oxidative stress induced by H2O2 (40 μM for one hour) was strikingly different than that observed for neurons or astrocytes. Whereas H2O2 had no detectable effect on extracellular or intracellular levels of 5′-AMP, adenosine, inosine, or hypoxanthine in neurons (Figure 4) or astrocytes (Figure 7), in microglia H2O2 increased extracellular levels of 5′-AMP, adenosine, inosine, and hypoxanthine by 5.9-fold (p=0.0017), 4.0-fold (p=0.0099), 1.6-fold (p<0.0001), and 1.9-fold (p<0.0001), respectively (Figure 10). Also, in microglia H2O2 increased intracellular levels of 5′-AMP, adenosine, inosine, and hypoxanthine by 1.6-fold (p=0.0221), 1.6-fold (p=0.0271), 2.1-fold (p=0.0021), and 1.6-fold (p=0.0217), respectively (Figure 10). Like astrocytes (Figures 8 and 9), but in contrast to neurons (Figures 5 and 6), neither glutamate (Figure 11) nor OGD (Figure 12) influenced extracellular or intracellular levels of 5′-AMP, adenosine, inosine, or hypoxanthine in microglia.
Figure 10.
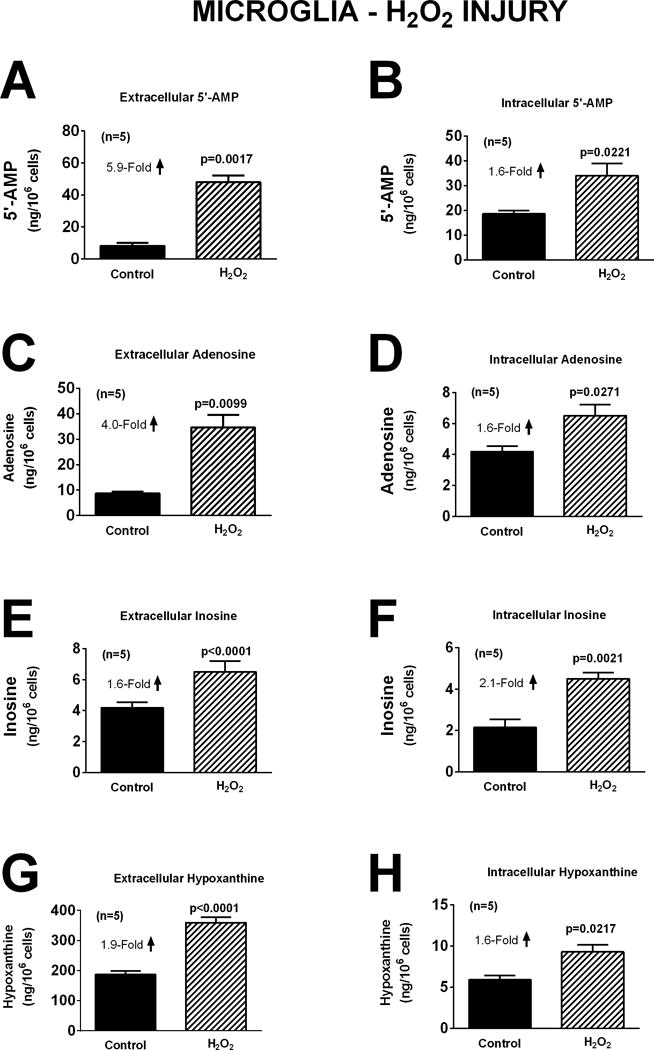
Bar graphs depict the effects of H2O2 (40 μM) for one hour on extracellular levels of 5′-AMP (A), adenosine (C), inosine (E), and hypoxanthine (G) and intracellular levels of 5′-AMP (B), adenosine (D), inosine (F), and hypoxanthine (H) in microglia. Values represent mean ± SEM.
Figure 11.
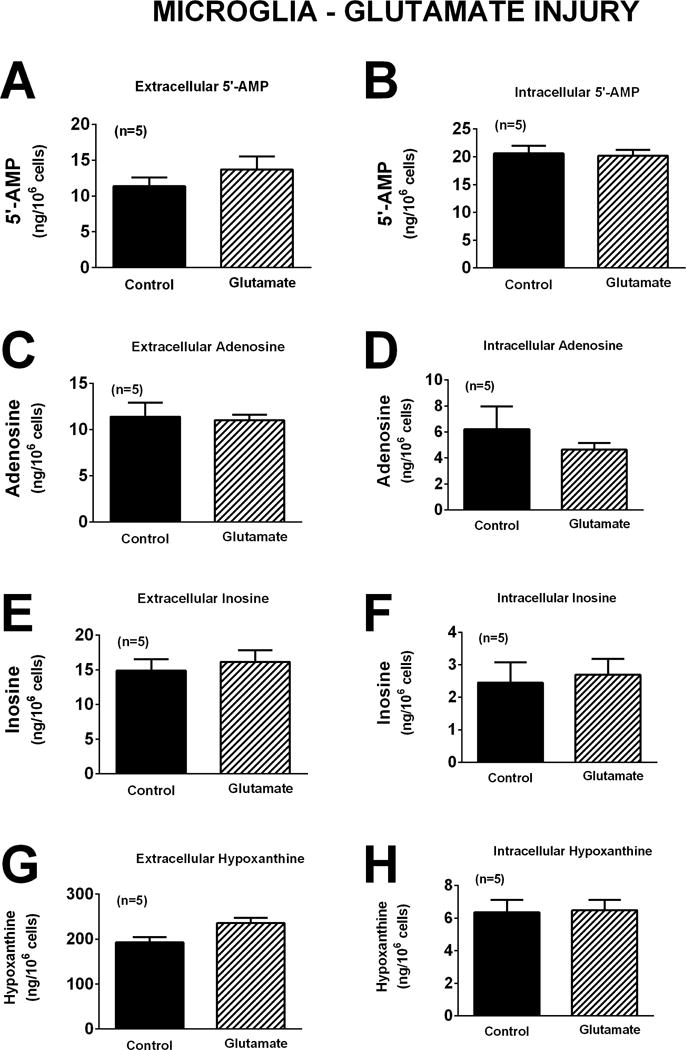
Bar graphs depict the effects of glutamate (10 μM) for one hour on extracellular levels of 5′-AMP (A), adenosine (C), inosine (E), and hypoxanthine (G) and intracellular levels of 5′-AMP (B), adenosine (D), inosine (F), and hypoxanthine (H) in microglia. Values represent mean ± SEM.
Figure 12.
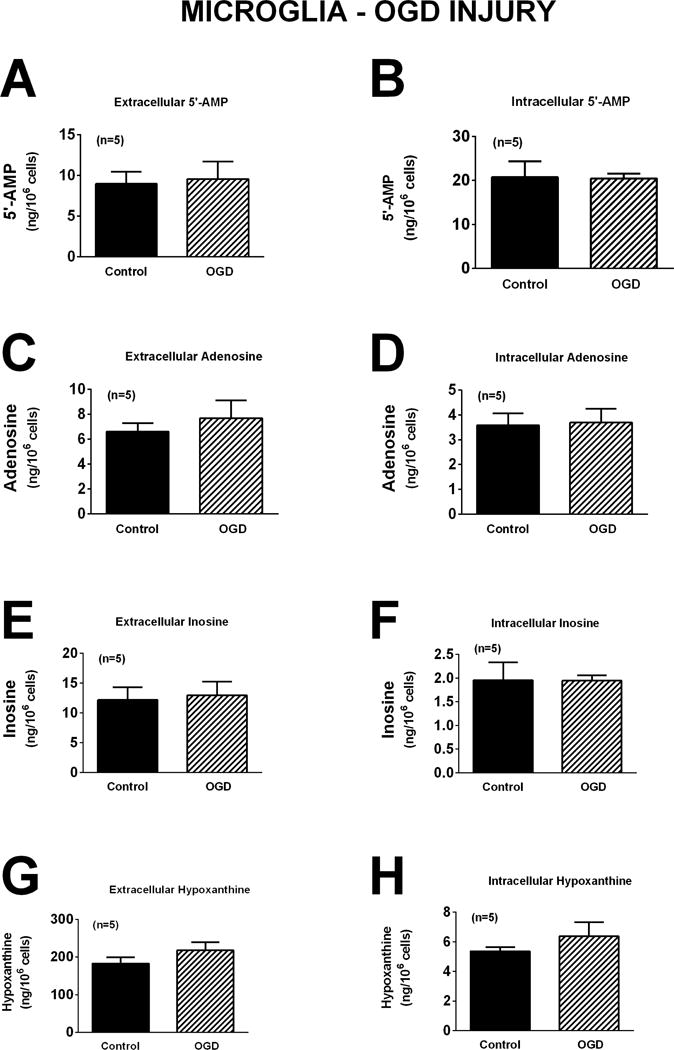
Bar graphs depict the effects of oxygen and glucose deprivation (OGD; 0.2% oxygen with zero glucose) for one hour on extracellular levels of 5′-AMP (A), adenosine (C), inosine (E), and hypoxanthine (G) and intracellular levels of 5′-AMP (B), adenosine (D), inosine (F), and hypoxanthine (H) in microglia. Values represent mean ± SEM.
Hypoxanthine-to-Inosine Ratio
A potentially important difference between neurons versus astrocytes and microglia relates to the ratio of hypoxanthine to inosine. This ratio appears to be much higher in astrocytes and microglia compared with neurons. For example, in untreated control cells in the intracellular compartment this ratio was 0.10 ± 0.004 (n=13), 4.16 ± 0.61 (n=12), and 3.10 ± 0.29 (n=15) in neurons, astrocytes, and microglia, respectively. In the extracellular compartment this ratio was 0.12 ± 0.008, 12.18 ± 2.70, and 13.97 ± 1.42 in neurons, astrocytes, and microglia, respectively. In all cases the hypoxanthine-to-inosine ratio was significantly (p<0.0001) greater in astrocytes and microglia compared to neurons.
Discussion
As reviewed by Dale and Frenguelli (Dale & Frenguelli 2009), studies using adenosine biosensors show that hypoxia and OGD cause rapid and massive increases in extracellular levels of adenosine in brain tissues. Likewise, TBI rapidly increases brain levels of extracellular adenosine (Bell et al. 1998, Bell et al. 2001, Robertson et al. 2001), and this early adenosine-release response activates A1 receptors to suppress seizures (Kochanek et al. 2006) and inflammation (Haselkorn et al. 2010). However, a thorough analysis of the formation of adenosine precursors, adenosine per se, and adenosine metabolites by brain cells following injury using standard insults is lacking. Accordingly, the main goal of the present study was to comprehensively investigate, using the most sensitive and specific analytical technology available (LC-MS/MS), how various injurious stimuli affect the early/rapid production and release of adenosine in well-defined brain cell types. Because the question being addressed was how different cell types in their native state respond, with regard to adenosine production and release, to the same level of the three major stimuli that are engaged during the early time period subsequent to TBI, we chose not to manipulate the energy charge or redox potential, either before or during the injurious stimuli. We also chose not to use different levels of stimuli in different cell types because this design would not mimic the in vivo situation following acute TBI. This design, we believe, best informs which cell types are contributing most to the interstitial levels of adenosine following injury and therefore provides information that can be used to augment the adenosine response. However, an important caveat is that the properties of primary cultures of cells do not always reflect the properties and responses in vivo. For example, dendrite abundance may differ and dendrites are more susceptible to injury than cell bodies (Hasel et al. 2015).
In the present study, we selected to expose brain cells to injurious stimuli for one hour. The decision to use this timeframe was based on three considerations. First, our preliminary studies showed that none of the treatments caused cell death within the brief exposure of one hour. Since we were interested in defining purine release from live, not dead cells, it was critical to use an early time point. Second, the adenosine release response to controlled cortical impact injury in vivo is rapid, i.e., peaks in less than one hour (Bell et al. 1998). Third, the anti-epileptic role of the adenosine-A1 receptor axis in TBI is important within the very early time frame of 1 to 2 hours following injury (Kochanek et al. 2006). Therefore, selection of the one hour time point allows inferences regarding mechanisms of adenosine production/release by defined cell types during the critical early adenosine-release response.
Oxidative stress is a component of the brain’s response to injury (Sparvero et al. 2010) and releases adenosine in the hippocampus (Almeida et al. 2003, Broad et al. 2000, Carswell et al. 1997, Masino et al. 1999). Therefore, it is important to determine the effects of oxidative stress on purine levels in brain cells. A major finding of our study is that oxidative stress induced by 40 μM of H2O2 has no detectable effect on intracellular or extracellular levels of 5′-AMP, adenosine, or inosine in neurons or astrocytes. Also oxidative stress induced by 40 μM of H2O2 does not increase intracellular or extracellular levels of hypoxanthine in neurons and induces only minor increases in extracellular and intracellular hypoxanthine in astrocytes. This lack of response is not due to an inadequate concentration of H2O2 because previous studies show that 40–50 μM of H2O2 causes neuronal injury (Jackson et al. 2013), induces oxidative stress (Ma et al. 2014) and represents a reasonable pathophysiological level of H2O2 (Lei et al. 1997). In contrast to neurons and astrocytes, in microglia oxidative stress induced by 40 μM of H2O2 triggers substantial increases in intracellular and extracellular levels of 5′-AMP, adenosine, inosine, and hypoxanthine. Although the present study indicates that pathophysiologically relevant concentrations of H2O2 do not induce adenosine release from neurons, studies in cultured retina cells do show that in the presence of blockade of adenosine deaminase, high levels of oxidative stress induced by the oxidant pair ascorbate (3.5 mM) plus Fe2+ (0.1 mM) can modestly (1.6-fold) increase adenosine levels (Agostinho et al. 2000). Since adenosine attenuates microglia activation (Haselkorn et al. 2010), the microglia adenosine response to oxidative stress would prevent microglia over-activation, thus attenuating microglia-induced neuronal damage.
The excitotoxic amino acid glutamate is also causative of poor outcomes in brain injury (Ruppel et al. 2001). Here, we found that in neurons induction of excitotoxicity with glutamate broadly affected purines with significant increases in intracellular and extracellular adenosine, inosine, and hypoxanthine. This is consistent with the correlation between cerebrospinal fluid levels of glutamate and adenosine in patients with TBI and suggests that adenosine protects against glutamate-induced injury, as suggested by others (Lauro et al. 2010, Ferreira & Paes-de-Carvalho 2001, Stone 2002). Although glutamate increased intracellular and extracellular adenosine, inosine, and hypoxanthine in neurons, in astrocytes and microglia glutamate had no detectable effect on either extracellular or intracellular purines. Therefore, to the extent that adenosine protects against excitotoxic-mediated brain injury, it is primarily neurons, rather than astrocytes or microglia, that directly provide this neuroprotective purine. Of course, our experiments were performed in neurons that model the newborn and pediatric brain and results in neurons from adult brain could vary.
A major cause of brain cell death is collapse of energy production (Kilbaugh et al. 2015). Extracellular adenosine is increased by energy deficiency because accumulation of 5′-AMP as ATP is utilized but not synthesized. Glucose deprivation reduces the rate of glycolysis and thereby decreases the input of pyruvate into the Krebs cycle, although other substrates may still contribute. Oxidative phosphorylation in the mitochondria is dependent on the free energy released by the electron transport chain, which in turn requires oxygen as the final electron acceptor. O2 deprivation thus deprives mitochondria of the terminal electron acceptor and therefore inhibits oxidative phosphorylation. In addition, hypoxia, by increasing levels of HIF1-α, transcriptionally upregulates CD39 (metabolizes ATP to ADP and ADP to 5′-AMP), upregulates CD73 (metabolizes 5′-AMP to adenosine), downregulates expression of equilibrative nucleoside transporters, and downregulates adenosine kinase (converts adenosine to 5′-AMP) (Eltzschig 2013, Eltzschig et al. 2005, Eltzschig & Carmeliet 2011, Eltzschig et al. 2012, Grenz et al. 2011, Grenz et al. 2007a, Grenz et al. 2007b). Moreover, recent studies in PC12 cells demonstrate that within one hour OGD engages translational responses (independent of HIF1-α signaling) affecting 3000 genes (Andreev et al. 2015). For these reasons, OGD should stimulate adenosine production by brain cells. Indeed, in the present study we observed that in neurons OGD caused a robust increase in intracellular and extracellular levels of 5′-AMP, adenosine, inosine, and hypoxanthine. Surprisingly, unlike neurons, OGD had little effect on purines in astrocytes and no detectable effect on purines in microglia. These results support the importance of dysfunctional bioenergetics in neurons as the major source of adenosine following brain injury.
Whether astrocytes release adenosine in response to oxygen deprivation is controversial. For example, two studies using thin layer chromatography of released tritium-labeled adenine nucleotides came to contradictory conclusions (Chu et al. 2014, Parkinson et al. 2002). Also Parkinson and Xiong (Parkinson & Xiong 2004) reported that ATP levels (measured by luciferase assay) are not affected by OGD in astrocytes, whereas in neurons ATP levels are reduced, despite both cells being able to elevate extracellular levels of adenosine (measure by thin layer chromatography of released tritium-labeled adenine nucleotides). Moreover, two studies using high-performance liquid chromatography with ultraviolet absorbance detection also arrived at contradictory conclusions (Kulik et al. 2010, Fujita et al. 2012). Another study reported the release of adenosine by hypoxia (Martin et al. 2007); however, adenosine was measured using the indirect method of oxidation of luminol by H2O2 produced by the sequential metabolism of adenosine, inosine, hypoxanthine, and xanthine to uric acid. To our knowledge, the present study is the first to address this controversy using the method of LC-MS/MS with 13C-labeled internal standards. We were able to detect only a small increase in intracellular and extracellular hypoxanthine, but no significant changes in intracellular or extracellular 5′-AMP, adenosine, or inosine. Thus our results suggest that any contribution of astrocytes to OGD-induced extracellular adenosine is quantitatively small in comparison to the contribution by neurons. Because of the quantity of astrocytes in brain, developing approaches such as drugs or biologics that recruit astrocytes to release adenosine could have beneficial effects in brain injury. Indeed, Boison and colleagues provide compelling evidence that knocking out adenosine kinase in astroctyes can protect against seizures (Theofilas et al. 2011).
The present study demonstrates that the extracellular and intracellular hypoxanthine-to-inosine ratios in astrocytes and microglia are much greater compared to the corresponding ratios in neurons. For example, this ratio is 100-fold greater in the intracellular compartment of astrocytes and microglia compared with the intracellular compartment of neurons. Inasmuch as hypoxanthine is a source of reactive oxygen species (Baldus et al. 2006) and purine nucleoside phosphorylase metabolizes inosine to hypoxanthine (Bzowska et al. 2000), these results imply that a purine nucleoside phosphorylase inhibitor might be neuroprotective. The role of astrocyte-derived and microglia-derived hypoxanthine in brain injury merits further investigation.
In the present study, in neurons OGD increased extracellular adenosine levels by approximately 3-fold, a finding highly consistent with reports by other investigators (Lobner & Choi 1994, Parkinson & Xiong 2004). In contrast, in rat hippocampal slices in vitro, acute OGD increases extracellular adenosine levels in the order of 100-fold (Dale & Frenguelli 2009). Similarly, we find that experimental TBI in rats (Bell et al. 1998) and mice (Verrier et al. 2012) acutely increases extracellular adenosine (as measured by brain microdialysis) by similar orders of magnitude as reported by Dale and Frenguelli (Dale & Frenguelli 2009). Why injury causes fold increases in extracellular adenosine that are much greater in brain tissue compared to neurons in culture is unclear. One possibility is that in intact brain tissue injurious stimuli release other intermediary factors not present in cell culture that strongly affect adenosine production (for example catecholamines (Dale & Frenguelli 2009)). Other important variables are the ratio of cell mass to extracellular fluid volume and the existence of diffusion barriers. In tightly organized brain tissue the limited extracellular fluid volume coupled with diffusion barriers would allow rapid adenosine release to spike local adenosine levels. In contrast, in cell monolayers the extracellular fluid volume is large (i.e., corresponds to whatever volume of culture medium is placed onto the monolayers) and there is no diffusion barrier between the released adenosine and the large volume of culture medium. Therefore, a large volume of culture medium above the monolayers would act as a buffer to prevent concentration spikes following rapid release of adenosine.
As reviewed by Cunha, the roles and mechanisms of adenosine as a neuromodulator are complex and incompletely understood (Cunha 2001). With regard to neuroprotection and neurodegeneration the early and rapid release of adenosine to activate the adenosine-A1 receptor axis appears to be beneficial, whereas the long-term activation of the adenosine-A2A receptor axis may be detrimental (Gomes et al. 2011, Cunha 2016). The goal of the present study was to focus on the early/rapid release of adenosine in microglia, astrocytes and neurons by three of the major injurious stimuli that are engaged in the acute phase of TBI. In this regard, we find that the release of adenosine by pathophysiologically relevant levels of oxidative stress is mediated mostly by microglia. For all intents and purposes, the release of adenosine in response to OGD and excitotoxicity is mediate by neurons. Because astrocytes are numerous yet appear to contribute only modestly to the early/rapid release of adenosine, developing approaches that promote astrocytes to release, rather than metabolize, adenosine could have beneficial effects in TBI. Indeed, the ability of fluoroacetate (inhibitor of the Krebs cycle) to increase adenosine release by astrocytes (Canals et al. 2008) indicates that astrocytes have the ability to make and release adenosine in response to a suitable pharmacological challenge. The results of the present study reinforce the conclusion by several teams of investigators (Martin et al. 2007, Choo et al. 2013, Van Dycke et al. 2010) that manipulating the purinergic system in astrocytes may be neuroprotective.
Acknowledgments
This work was supported by NIH grants NS070003 (PMK/EKJ), DK068575 (EKJ), DK079307 (EKJ), DK091190 (EKJ), HL109002 (EKJ), HL069846 (EKJ), NS38087 (PMK), and NS30318 (PMK).
List of Abbreviations
- TBI
traumatic brain injury
- A1 +/+
A1 receptor wildtype
- A1 −/−
A1 receptor knockout
- LC-MS/MS
ultra-performance liquid chromatography-triple quadrupole mass spectrometry
- OGD
oxygen-glucose deprivation
- DIV 6
day in vitro 6
- LDH
Lactic Acid Dehydrogenase
- 5′-AMP
5′-adenosine monophosphate
- HPLC-UV
high pressure liquid chromatography-ultraviolet absorbance
Footnotes
All experiments were conducted in compliance with the ARRIVE guidelines.
The authors have no conflict of interest to declare.
References
- Agostinho P, Caseiro P, Rego AC, Duarte EP, Cunha RA, Oliveira CR. Adenosine modulation of D-[3H]aspartate release in cultured retina cells exposed to oxidative stress. Neurochem Int. 2000;36:255–265. doi: 10.1016/s0197-0186(99)00113-8. [DOI] [PubMed] [Google Scholar]
- Almeida CG, de Mendonca A, Cunha RA, Ribeiro JA. Adenosine promotes neuronal recovery from reactive oxygen species induced lesion in rat hippocampal slices. Neurosci Lett. 2003;339:127–130. doi: 10.1016/s0304-3940(02)01478-7. [DOI] [PubMed] [Google Scholar]
- Andreev DE, O’Connor PB, Zhdanov AV, Dmitriev RI, Shatsky IN, Papkovsky DB, Baranov PV. Oxygen and glucose deprivation induces widespread alterations in mRNA translation within 20 minutes. Genome biology. 2015;16:90. doi: 10.1186/s13059-015-0651-z. [DOI] [PMC free article] [PubMed] [Google Scholar]
- Baldus S, Mullerleile K, Chumley P, et al. Inhibition of xanthine oxidase improves myocardial contractility in patients with ischemic cardiomyopathy. Free Radic Biol Med. 2006;41:1282–1288. doi: 10.1016/j.freeradbiomed.2006.07.010. [DOI] [PMC free article] [PubMed] [Google Scholar]
- Bell MJ, Kochanek PM, Carcillo JA, et al. Interstitial adenosine, inosine, and hypoxanthine are increased after experimental traumatic brain injury in the rat. J Neurotraum. 1998;15:163–170. doi: 10.1089/neu.1998.15.163. [DOI] [PubMed] [Google Scholar]
- Bell MJ, Robertson CS, Kochanek PM, et al. Interstitial brain adenosine and xanthine increase during jugular venous oxygen desaturations in humans after traumatic brain injury. Crit Care Med. 2001;29:399–404. doi: 10.1097/00003246-200102000-00033. see comment. [DOI] [PubMed] [Google Scholar]
- Brewer GJ, Torricelli JR, Evege EK, Price PJ. Optimized survival of hippocampal neurons in B27-supplemented Neurobasal, a new serum-free medium combination. J Neurosci Res. 1993;35:567–576. doi: 10.1002/jnr.490350513. [DOI] [PubMed] [Google Scholar]
- Broad RM, Fallahi N, Fredholm BB. Nitric oxide interacts with oxygen free radicals to evoke the release of adenosine and adenine nucleotides from rat hippocampal slices. J Auton Nerv Syst. 2000;81:82–86. doi: 10.1016/s0165-1838(00)00124-7. [DOI] [PubMed] [Google Scholar]
- Bzowska A, Kulikowska E, Shugar D. Purine nucleoside phosphorylases: properties, functions, and clinical aspects. Pharmacol Ther. 2000;88:349–425. doi: 10.1016/s0163-7258(00)00097-8. [DOI] [PubMed] [Google Scholar]
- Canals S, Larrosa B, Pintor J, Mena MA, Herreras O. Metabolic challenge to glia activates an adenosine-mediated safety mechanism that promotes neuronal survival by delaying the onset of spreading depression waves. J Cereb Blood Flow Metab. 2008;28:1835–1844. doi: 10.1038/jcbfm.2008.71. [DOI] [PubMed] [Google Scholar]
- Carswell HV, Graham DI, Stone TW. Kainate-evoked release of adenosine from the hippocampus of the anaesthetised rat: possible involvement of free radicals. J Neurochem. 1997;68:240–247. doi: 10.1046/j.1471-4159.1997.68010240.x. [DOI] [PubMed] [Google Scholar]
- Choo AM, Miller WJ, Chen YC, et al. Antagonism of purinergic signalling improves recovery from traumatic brain injury. Brain. 2013;136:65–80. doi: 10.1093/brain/aws286. [DOI] [PMC free article] [PubMed] [Google Scholar]
- Chu S, Xiong W, Parkinson FE. Effect of ecto-5′-nucleotidase (eN) in astrocytes on adenosine and inosine formation. Purinergic Signal. 2014;10:603–609. doi: 10.1007/s11302-014-9421-8. [DOI] [PMC free article] [PubMed] [Google Scholar]
- Cunha RA. Adenosine as a neuromodulator and as a homeostatic regulator in the nervous system: different roles, different sources and different receptors. Neurochem Int. 2001;38:107–125. doi: 10.1016/s0197-0186(00)00034-6. [DOI] [PubMed] [Google Scholar]
- Cunha RA. How does adenosine control neuronal dysfunction and neurodegeneration? J Neurochem. 2016 doi: 10.1111/jnc.13724. [DOI] [PubMed] [Google Scholar]
- Dale N, Frenguelli BG. Release of adenosine and ATP during ischemia and epilepsy. Current neuropharmacology. 2009;7:160–179. doi: 10.2174/157015909789152146. [DOI] [PMC free article] [PubMed] [Google Scholar]
- Eltzschig HK. Extracellular adenosine signaling in molecular medicine. J Mol Med. 2013;91:141–146. doi: 10.1007/s00109-013-0999-z. [DOI] [PMC free article] [PubMed] [Google Scholar]
- Eltzschig HK, Abdulla P, Hoffman E, et al. HIF-1-dependent repression of equilibrative nucleoside transporter (ENT) in hypoxia. J Exp Med. 2005;202:1493–1505. doi: 10.1084/jem.20050177. [DOI] [PMC free article] [PubMed] [Google Scholar]
- Eltzschig HK, Carmeliet P. Hypoxia and inflammation. N Engl J Med. 2011;364:656–665. doi: 10.1056/NEJMra0910283. [DOI] [PMC free article] [PubMed] [Google Scholar]
- Eltzschig HK, Sitkovsky MV, Robson SC. Purinergic signaling during inflammation. N Engl J Med. 2012;367:2322–2333. doi: 10.1056/NEJMra1205750. [DOI] [PMC free article] [PubMed] [Google Scholar]
- Ferreira JM, Paes-de-Carvalho R. Long-term activation of adenosine A(2a) receptors blocks glutamate excitotoxicity in cultures of avian retinal neurons. Brain Res. 2001;900:169–176. doi: 10.1016/s0006-8993(01)02279-x. [DOI] [PubMed] [Google Scholar]
- Fujita T, Williams EK, Jensen TK, Smith NA, Takano T, Tieu K, Nedergaard M. Cultured astrocytes do not release adenosine during hypoxic conditions. J Cereb Blood Flow Metab. 2012;32:e1–7. doi: 10.1038/jcbfm.2011.142. [DOI] [PMC free article] [PubMed] [Google Scholar]
- Gomes CV, Kaster MP, Tome AR, Agostinho PM, Cunha RA. Adenosine receptors and brain diseases: neuroprotection and neurodegeneration. Biochim Biophys Acta. 2011;1808:1380–1399. doi: 10.1016/j.bbamem.2010.12.001. [DOI] [PubMed] [Google Scholar]
- Grenz A, Homann D, Eltzschig HK. Extracellular adenosine: a safety signal that dampens hypoxia-induced inflammation during ischemia. Antioxid Redox Signal. 2011;15:2221–2234. doi: 10.1089/ars.2010.3665. [DOI] [PMC free article] [PubMed] [Google Scholar]
- Grenz A, Zhang H, Eckle T, et al. Protective role of ecto-5′-nucleotidase (CD73) in renal ischemia. J Am Soc Nephrol. 2007a;18:833–845. doi: 10.1681/ASN.2006101141. [DOI] [PubMed] [Google Scholar]
- Grenz A, Zhang H, Hermes M, et al. Contribution of E-NTPDase1 (CD39) to renal protection from ischemia-reperfusion injury. FASEB Journal. 2007b;21:2863–2873. doi: 10.1096/fj.06-7947com. [DOI] [PubMed] [Google Scholar]
- Hasel P, McKay S, Qiu J, Hardingham GE. Selective dendritic susceptibility to bioenergetic, excitotoxic and redox perturbations in cortical neurons. Biochim Biophys Acta. 2015;1853:2066–2076. doi: 10.1016/j.bbamcr.2014.12.021. [DOI] [PMC free article] [PubMed] [Google Scholar]
- Haselkorn ML, Shellington D, Jackson E, et al. Adenosine A1 receptor activation as a brake on the microglial response after experimental traumatic brain injury in mice. J Neurotraum. 2010;27:901–910. doi: 10.1089/neu.2009.1075. [DOI] [PMC free article] [PubMed] [Google Scholar]
- Jackson EK, Ren J, Mi Z. Extracellular 2′,3′-cAMP is a source of adenosine. J Biol Chem. 2009;284:33097–33106. doi: 10.1074/jbc.M109.053876. [DOI] [PMC free article] [PubMed] [Google Scholar]
- Jackson TC, Du L, Janesko-Feldman K, Vagni VA, Dezfulian C, Poloyac SM, Jackson EK, Clark RS, Kochanek PM. The nuclear splicing factor RNA binding motif 5 promotes caspase activation in human neuronal cells, and increases after traumatic brain injury in mice. J Cereb Blood Flow Metab. 2015a;35:655–666. doi: 10.1038/jcbfm.2014.242. [DOI] [PMC free article] [PubMed] [Google Scholar]
- Jackson TC, Manole MD, Kotermanski SE, Jackson EK, Clark RS, Kochanek PM. Cold stress protein RBM3 responds to temperature change in an ultra-sensitive manner in young neurons. Neuroscience. 2015b;305:268–278. doi: 10.1016/j.neuroscience.2015.08.012. [DOI] [PMC free article] [PubMed] [Google Scholar]
- Jackson TC, Verrier JD, Kochanek PM. Anthraquinone-2-sulfonic acid (AQ2S) is a novel neurotherapeutic agent. Cell Death Dis. 2013;4:e451. doi: 10.1038/cddis.2012.187. [DOI] [PMC free article] [PubMed] [Google Scholar]
- Jackson TC, Verrier JD, Semple-Rowland S, Kumar A, Foster TC. PHLPP1 splice variants differentially regulate AKT and PKCalpha signaling in hippocampal neurons: characterization of PHLPP proteins in the adult hippocampus. J Neurochem. 2010;115:941–955. doi: 10.1111/j.1471-4159.2010.06984.x. [DOI] [PMC free article] [PubMed] [Google Scholar]
- Kilbaugh TJ, Karlsson M, Byro M, et al. Mitochondrial bioenergetic alterations after focal traumatic brain injury in the immature brain. Exp Neurol. 2015;271:136–144. doi: 10.1016/j.expneurol.2015.05.009. [DOI] [PMC free article] [PubMed] [Google Scholar]
- Kochanek PM, Vagni VA, Janesko KL, et al. Adenosine A1 receptor knockout mice develop lethal status epilepticus after experimental traumatic brain injury. J Cereb Blood Flow Metab. 2006;26:565–575. doi: 10.1038/sj.jcbfm.9600218. [DOI] [PubMed] [Google Scholar]
- Kulik TB, Aronhime SN, Echeverry G, Beylin A, Winn HR. The relationship between oxygen and adenosine in astrocytic cultures. GLIA. 2010;58:1335–1344. doi: 10.1002/glia.21011. [DOI] [PubMed] [Google Scholar]
- Lauro C, Cipriani R, Catalano M, et al. Adenosine A1 receptors and microglial cells mediate CX3CL1-induced protection of hippocampal neurons against Glu-induced death. Neuropsychopharmacology. 2010;35:1550–1559. doi: 10.1038/npp.2010.26. [DOI] [PMC free article] [PubMed] [Google Scholar]
- Lei B, Adachi N, Arai T. The effect of hypothermia on H2O2 production during ischemia and reperfusion: a microdialysis study in the gerbil hippocampus. Neurosci Lett. 1997;222:91–94. doi: 10.1016/s0304-3940(97)13349-3. [DOI] [PubMed] [Google Scholar]
- Lin YC, Huang ZH, Jan IS, Yeh CC, Wu HJ, Chou YC, Chang YC. Development of excitatory synapses in cultured neurons dissociated from the cortices of rat embryos and rat pups at birth. J Neurosci Res. 2002;67:484–493. doi: 10.1002/jnr.10077. [DOI] [PubMed] [Google Scholar]
- Lobner D. Saturation of neuroprotective effects of adenosine in cortical culture. Neuroreport. 2002;13:2075–2078. doi: 10.1097/00001756-200211150-00017. [DOI] [PubMed] [Google Scholar]
- Lobner D, Choi DW. Dipyridamole increases oxygen-glucose deprivation-induced injury in cortical cell culture. Stroke. 1994;25:2085–2089. doi: 10.1161/01.str.25.10.2085. [DOI] [PubMed] [Google Scholar]
- Lu Y, Chung HJ, Li Y, Rosenberg PA. NMDA receptor-mediated extracellular adenosine accumulation in rat forebrain neurons in culture is associated with inhibition of adenosine kinase. Eur J Neurosci. 2003;17:1213–1222. doi: 10.1046/j.1460-9568.2003.02554.x. [DOI] [PubMed] [Google Scholar]
- Lynch JJ, 3rd, Alexander KM, Jarvis MF, Kowaluk EA. Inhibition of adenosine kinase during oxygen-glucose deprivation in rat cortical neuronal cultures. Neurosci Lett. 1998;252:207–210. doi: 10.1016/s0304-3940(98)00376-0. [DOI] [PubMed] [Google Scholar]
- Ma J, Wu R, Zhang Q, Wu JB, Lou J, Zheng Z, Ding JQ, Yuan Z. DJ-1 interacts with RACK1 and protects neurons from oxidative-stress-induced apoptosis. Biochem J. 2014;462:489–497. doi: 10.1042/BJ20140235. [DOI] [PubMed] [Google Scholar]
- Martin ED, Fernandez M, Perea G, Pascual O, Haydon PG, Araque A, Cena V. Adenosine released by astrocytes contributes to hypoxia-induced modulation of synaptic transmission. Glia. 2007;55:36–45. doi: 10.1002/glia.20431. [DOI] [PubMed] [Google Scholar]
- Masino SA, Mesches MH, Bickford PC, Dunwiddie TV. Acute peroxide treatment of rat hippocampal slices induces adenosine-mediated inhibition of excitatory transmission in area CA1. Neurosci Lett. 1999;274:91–94. doi: 10.1016/s0304-3940(99)00693-x. [DOI] [PubMed] [Google Scholar]
- Ni M, Aschner M. Neonatal rat primary microglia: isolation, culturing and selected applications. Current protocols in toxicology/editorial board, Mahin D Maines (editor-in-chief) … [et al] 2010 doi: 10.1002/0471140856.tx1217s43. CHAPTER, Unit-12.17. [DOI] [PMC free article] [PubMed] [Google Scholar]
- Parkinson FE, Sinclair CJ, Othman T, Haughey NJ, Geiger JD. Differences between rat primary cortical neurons and astrocytes in purine release evoked by ischemic conditions. Neuropharmacology. 2002;43:836–846. doi: 10.1016/s0028-3908(02)00083-7. [DOI] [PubMed] [Google Scholar]
- Parkinson FE, Xiong W. Stimulus- and cell-type-specific release of purines in cultured rat forebrain astrocytes and neurons. J Neurochem. 2004;88:1305–1312. doi: 10.1046/j.1471-4159.2003.02266.x. [DOI] [PubMed] [Google Scholar]
- Rebola N, Rodrigues RJ, Oliveira CR, Cunha RA. Different roles of adenosine A1, A2A and A3 receptors in controlling kainate-induced toxicity in cortical cultured neurons. Neurochem Int. 2005;47:317–325. doi: 10.1016/j.neuint.2005.05.009. [DOI] [PubMed] [Google Scholar]
- Robertson CL, Bell MJ, Kochanek PM, et al. Increased adenosine in cerebrospinal fluid after severe traumatic brain injury in infants and children: association with severity of injury and excitotoxicity. Crit Care Med. 2001;29:2287–2293. doi: 10.1097/00003246-200112000-00009. [DOI] [PubMed] [Google Scholar]
- Ruppel RA, Kochanek PM, Adelson PD, Rose ME, Wisniewski SR, Bell MJ, Clark RS, Marion DW, Graham SH. Excitatory amino acid concentrations in ventricular cerebrospinal fluid after severe traumatic brain injury in infants and children: the role of child abuse. J Pediatr. 2001;138:18–25. doi: 10.1067/mpd.2001.110979. [DOI] [PubMed] [Google Scholar]
- Sparvero LJ, Amoscato AA, Kochanek PM, Pitt BR, Kagan VE, Bayir H. Mass-spectrometry based oxidative lipidomics and lipid imaging: applications in traumatic brain injury. J Neurochem. 2010;115:1322–1336. doi: 10.1111/j.1471-4159.2010.07055.x. [DOI] [PMC free article] [PubMed] [Google Scholar]
- Stone TW. Purines and neuroprotection. Advances in Experimental Medicine & Biology. 2002;513:249–280. doi: 10.1007/978-1-4615-0123-7_9. [DOI] [PubMed] [Google Scholar]
- Theofilas P, Brar S, Stewart KA, Shen HY, Sandau US, Poulsen D, Boison D. Adenosine kinase as a target for therapeutic antisense strategies in epilepsy. Epilepsia. 2011;52:589–601. doi: 10.1111/j.1528-1167.2010.02947.x. [DOI] [PMC free article] [PubMed] [Google Scholar]
- Timofeev I, Carpenter KL, Nortje J, et al. Cerebral extracellular chemistry and outcome following traumatic brain injury: a microdialysis study of 223 patients. Brain. 2011;134:484–494. doi: 10.1093/brain/awq353. [DOI] [PubMed] [Google Scholar]
- Van Dycke A, Raedt R, Verstraete A, Theofilas P, Wadman W, Vonck K, Boison D, Boon P. Astrocytes derived from fetal neural progenitor cells as a novel source for therapeutic adenosine delivery. Seizure. 2010;19:390–396. doi: 10.1016/j.seizure.2010.05.010. [DOI] [PMC free article] [PubMed] [Google Scholar]
- Verrier JD, Exo JL, Jackson TC, Ren J, Gillespie DG, Dubey RK, Kochanek PM, Jackson EK. Expression of the 2′,3′-cAMP-adenosine pathway in astrocytes and microglia. J Neurochem. 2011;118:979–987. doi: 10.1111/j.1471-4159.2011.07392.x. [DOI] [PMC free article] [PubMed] [Google Scholar]
- Verrier JD, Jackson TC, Bansal R, Kochanek PM, Puccio AM, Okonkwo DO, Jackson EK. The brain in vivo expresses the 2′,3′-cAMP-adenosine pathway. J Neurochem. 2012;122:115–125. doi: 10.1111/j.1471-4159.2012.07705.x. [DOI] [PMC free article] [PubMed] [Google Scholar]


