

Abstract
Multidrug resistance associated protein 2 (MRP2/ABCC2) is a membrane transport protein that can potentially affect the disposition of many substrate drugs and their metabolites. Recently, we studied the interaction of a library of 432 compounds with ABCC2, and the structure-activity relationship (SAR) of a subset of 64 compounds divided into four scaffolds (Wissel, G. et al., 2015. Bioorg Med Chem., 23(13), pp.3513–25). We have now expanded this test set by investigating 114 new compounds, of which 71 are representative of the previous four scaffolds and 43 compounds belong to a new scaffold. Interaction with ABCC2 was assessed by measuring the compounds effect on 5(6)-carboxy-2′,7′-dichlorofluorescein transport in the vesicular transport assay. In line with our previous study, we observed that anionic charge is not essential for inhibition of ABCC2 transport, even though it often increases the inhibitory activity within the analogue series. Additionally, we found that halogen substitutions often increase the inhibitory activity. The results confirm the importance of structural features such as aromaticity and lipophilicity for ABCC2 inhibitory activity.
Keywords: transporter, MRP2, modulator, vesicle assay, pharmacophore
Graphical abstract

1. INTRODUCTION
Multidrug resistance associated protein 2 (MRP2/ABCC2) is a member of the ATP binding cassette (ABC) protein superfamily. It is expressed on the apical side of polarized cells, for instance in the kidney and the liver (Keppler et al. 1997). In the liver, ABCC2 effluxes several endogenous anionic compounds such as leukotriene C4 and bilirubin glucuronide into the bile (König et al. 1999; Kamisako et al. 1999). In 1996, Taniguchi identified ABCC2 overexpression in cisplatin-resistant cancer cells (Taniguchi et al. 1996). Since then ABCC2 has been recognized as one of the causes of multidrug resistance in cancer, associated for example with the failure of classic antifolate therapy (Hooijberg et al. 1999; Peters et al. 2005).
Due to the localization and broad substrate specificity of ABCC2, it can potentially affect the pharmacokinetics of many drugs and their metabolites. Inhibition of ABCC2 can lead to conjugated hyperbilirubinemia, as the elimination of conjugated bilirubin to the bile is impaired (Hillgren et al 2013). Defining the chemical space of the compounds that interact with ABCC2 is of interest with the goal to identify substrates or inhibitors at an early stage of drug development.
Several studies on the structure-activity relationship (SAR) of ABCC2 inhibitors have been published, including studies focusing on small series of analogues (reviewed in Xing et al. 2009) as well as more comprehensive models (Matsson et al. 2009; Zhang et al. 2009, Wissel et al 2015). Structural features such as lipophilicity, polar surface area and negative charge were found to influence the inhibitory activity in a methotrexate analogue series (Han et al. 2001; Ng et al. 2005). Interestingly, the widening of the torsion angle in biphenyl-substituted heterocyclic compounds with bulky ortho-substituents was identified to increase the inhibitory activity on ABCC2 (Lai et al. 2007). In a set of dimeric 1,4-dihydropyridines, compounds with more lipophilic, aromatic benzyloxy substituents were poorer inhibitors of ABCC2 compared to the methoxy-substituted compounds (Coburger et al. 2010). A larger study, based on 191 compounds including approved drugs, found ABCC2 inhibitors to be larger, more lipophilic and have more aromatic rings than non-inhibitors (Pedersen et al. 2008). However, a follow-up study identified lower lipophilicity and aromaticity as factors that discriminate ABCC2 inhibitors from inhibitors of other investigated ABC transporters (Matsson et al. 2009). Another study, which was based on 318 compounds, similarly recognized the importance of lipophilicity and aromaticity parameters among 16 features to distinguish ABCC2 inhibitors from non-inhibitors (Zhang et al. 2009). These authors also constructed a pharmacophore model based on nine potent inhibitors, which identified one hydrophobic and two hydrogen bond acceptor features to be central for prediction of ABCC2 inhibitors.
Recently, we screened a library of 432 compounds composed around a series of analogues and built a classification model able to distinguish between ABCC2 inhibitors and inactive compounds (Wissel et al. 2015). Similarly to previous studies, we identified aromaticity and lipophilicity as important descriptors to distinguish between the two classes of compounds. A preliminary SAR study of 64 compounds, belonging to four series of analogues within the library, revealed that even though anionic charge is not essential for inhibition, within the analogue series it usually enhanced inhibitory activity.
Here we have investigated the inhibition of ABCC2 with 114 new compounds, of which 71 were selected in order to expand the four scaffolds previously studied. The remaining 43 selected compounds are a series of benzenesulfonamide analogues that are structurally similar to an inhibitor we previously identified, and form a novel, fifth scaffold. We present a comprehensive structure-activity analysis of ABCC2 inhibitors within these five scaffolds.
2. MATERIAL and METHODS
2.1 Material
114 molecules from the University of Pittsburgh Chemical Methodologies and Library Development (UPCMLD) (http://ccc.chem.pitt.edu/UPCMLD/index.html) were each dissolved in DMSO and stored at −80 °C. 5(6)-Carboxy-2,′7′-dichlorofluorescein (CDCF), ATP and benzbromarone were purchased from Sigma-Aldrich (St. Louis, MO, USA). Cloned human ABCC2, pGEM3-ABCC2 (U49248), was a kind gift from Dr. Piet Borst (The Netherlands Cancer Institute). HyQ®SFX-Insect MP medium was obtained from Hyclone (Logan, UT, USA).
2.2 Vesicle preparation and vesicular transport assay
Using the Bac-to-Bac® Baculovirus expression system the human ABCC2 was expressed in Spodoptera frugiperda (Sf9) insect cells (Invitrogen Life Technologies, Carlsbad, CA, USA). Inside-out membrane vesicles containing ABCC2 were prepared, and the vesicular transport assay was performed as described previously (Kidron et al. 2012). ATP-dependent transport of CDCF was set as 100%, determined from the difference of probe transport with and without ATP. The modulation effect was then calculated as the ratio of the ATP-dependent probe transport with and without the test compound. The ATP-dependent transport of CDCF and the positive control, benzbromarone (100 μM), were measured on each assay plate. Compounds were first tested using three concentrations in triplicates (400 μM; 80 μM; 16 μM); then the compounds that were identified as potential inhibitors were re-tested at three additional concentrations (3.2 μM; 0.64 μM and 0.128 μM), which were also measured in triplicate. Stock solutions of test compounds and assay media were visually inspected for precipitates.
The compounds were tested for intrinsic fluorescence and quenching of CDCF fluorescence at the wavelengths used for CDCF detection (Ex. 510 nm and Em. 535 nm) in 0.1 M NaOH to mimic measurement conditions of the vesicular transport assay. As the concentration of the test compounds in the filter plate eluate in the vesicular transport assay is unknown, the test was performed at the highest possible concentration; i.e. assuming that all of the compound was retained. Solvent (DMSO) was used in the control wells and all compounds were tested in triplicate. CDCF (5 μM) was added after measurement of the intrinsic fluorescence of the test compounds to observe their effect on the fluorescence signal measured with CDCF.
2.3 IC50 calculation and curve fitting
The IC50 values were estimated using Graph Pad Prism 6 dynamic curve fitting four parameter logistic. (Eq. 1).
| (Eq.1) |
where I% is percentage of inhibition. Min was constrained to null as a negative value is an artifact of the detecting method.
2.4 Computational studies
71 of the 114 compounds tested in this study were selected to expand the four scaffolds from our previous study (Wissel et al. 2015) and the remaining 43 compounds belong to a novel scaffold that was added to this study. All scaffolds were aligned automatically with R-group analysis by Maestro 9.7 (Schrödinger Release 2014-1: Maestro, version 9.7, Schrödinger, LLC, New York, NY, 2014). A pharmacophore was built for each scaffold using default settings in the Common feature pharmacophore of Discovery studio (Accelrys Software Inc., Discovery Studio Modeling Environment, Release 4.0, San Diego). The web-based tool Aggregator Advisor was used to assess the similarity of the compounds to known aggregators (Irwin et al. 2015).
3. RESULTS and DISCUSSION
We present the observed transport modulation (inhibition, stimulation) of ABCC2 by 114 new compounds in a well-validated CDCF vesicular transport assay. Chiral compounds are diastereomerically pure but racemic mixtures, and the difference in activity by the individual enantiomers has not been evaluated. The compounds did not exhibit intrinsic fluorescence or quenching of the CDCF that would have interfered with the detection of CDCF transport (data not shown). The compounds were selected in order to extend the chemical space of the compounds we previously used for an SAR analysis and therefore we analyzed this newly generated data together with our previously published results (Wissel et al 2015). Additionally, pharmacophores were used to identify and visualize common features in ABCC2 inhibitors.
More than half of the tested compounds (71) can be classified into one of the four scaffolds previously presented (Wissel et al. 2015) and the remaining 43 compounds share a common benzenesulfonamide scaffold shown here as scaffold 5 (Figure 1). All compounds were initially tested at three concentrations (400 μM; 80 μM; 16 μM). For 68 compounds we tested three additional concentrations (3.2 μM; 0.64 μM, 0.128 μM) in order to have a full dose-response curve and calculate IC50 values. The compounds were classified into inhibitors, weak inhibitors, inactive molecules and stimulators based on their activity. Compounds that inhibited CDCF transport to more than 50% at both 400 μM and 80 μM were classified as inhibitors, while weak inhibitors were molecules that were able to inhibit over 50% of CDCF transport only at the highest tested concentration, 400 μM. All molecules that were not able to inhibit at least 50% of CDCF transport at 400 μM were considered inactive, while the stimulators increased CDCF transport to higher than 150% of the control at 400 μM. The dose-response curves of the 114 compounds are presented in Appendix A.1. All in all, we identified 38 inhibitors, 40 weak inhibitors, 33 inactive compounds and 3 stimulators among the compounds tested in this study (Table 1). To distinguish between compounds tested in this study and in our previous study, we have assigned a two-letter code for the new compounds in each scaffold, while the previously tested compounds have a one-letter code. Tables combining the recent data with previously published results are available in the Appendix B.
Figure 1.

Markush structures of the scaffolds presented in Tables 2–7.
Table 1.
Number of test compound classified as inhibitors (IC50 < 80 μM), weak inhibitors (IC50 > 80 μM), inactive molecules and stimulators within the five scaffolds in this study. The number in parenthesis respond to the combined number of test compounds from this study and Wissel et al 2015.
| Scaffold 1 | Scaffold 2 | Scaffold 3 | Scaffold 4 | Scaffold 5 | Total | |
|---|---|---|---|---|---|---|
| Inhibitor | 5 (19) | 19(26) | 5 (10) | 2 (4) | 7 (8) | 38 (67) |
| Weak inhib. | 6 (10) | 8 (17) | 1 (4) | 7 (11) | 18 (18) | 40 (60) |
| Inactive | 0 (1) | 2 (9) | 1 (3) | 13 (15) | 17 (17) | 33 (45) |
| Stimulator | 0 (0) | 0 (0) | 0 (0) | 2 (2) | 1 (1) | 3 (3) |
|
| ||||||
| Total | 11(30) | 29 (52) | 7 (17) | 24 (32) | 43(44) | 114 (175) |
Colloidal aggregation is a known cause of artificial protein inhibition, and therefore the potential of aggregation of all compounds was evaluated with the program Aggregator Advisor (Irwin et al. 2015). The likelihood of aggregation of a compound was evaluated based on its similarity to confirmed aggregators. Irwin et al. observed that compounds with a Tanimoto coefficient below 80% to known aggregators were unlikely to aggregate. In our study compounds with a calculated logP over 3.0 and Tanimoto coefficient over 80% to a known aggregator were considered as possible aggregators and marked accordingly (Appendix B). 29 out of the 175 compounds were indicated as similar to known aggregators. These compounds were clustered in scaffold 2 (26 out of 52), while the prevalence of possible aggregators in scaffold 5 was lower (3 out of 44). The compounds in scaffolds 1, 3 and 4 are not similar to known aggregators.
3.1 Cvclopentahvdroquinolines Analogues - Scaffold 1
The dose-response for eleven new cyclopentahydroquinoline analogues was measured (Table 2 1aa-1ak). All tested compounds had inhibitory activity on CDCF transport, making this series by far the most active of the five studied scaffolds. The potency of this scaffold was not surprising, as we had already found that this scaffold was highly active, with the majority of the compounds inhibiting ABCC2 (Appendix B.1). Of the total of 30 compounds tested in this scaffold series, only one was inactive (1o) at the tested concentrations. The inactive compound (1o) has a tetrahydrofuran instead of the cyclopentene ring, so the scaffold is actually not strictly conserved. The eleven new compounds that were tested did not contain any modifications of the cyclopentene ring. The two most potent analogues (1aa and 1ac with an IC50 of 18 μM and 13 μM, respectively) among the newly tested compounds in this series contain a carboxylic acid at the R3 position, which we previously found to be important for increased activity. The IC50 values of these compounds are within the same range as the earlier tested carboxylic acid-containing compounds ifrom this scaffold. While compounds 1aa–1ac contain additional modifications on the aromatic ring, we were not able to properly define the importance of these modifications (R2) as the series lacked variability in this position. Still, methyl and chlorine groups do not appear to reduce the activity, while the tertiary amide increased the IC50 value of 1ab fourfold compared to the corresponding analog 1a.
Table 2.
Scaffold 1
| -R1 | -R2 | -R3 | IC50 (95% CI),μM | Hill slope (95% CI) | |
|---|---|---|---|---|---|
| 1aa | -H | 2-CH3; 3-Cl | -OH | 18 (15 – 22) | −2.3 (−4.2, −0.5) |
| 1ab | -H |

|
-OH | 63 (44 – 91) | −1.3 (−1.7, −0.7) |
| 1ac | -Cl | 2-Cl; 5-Cl | -OH | 13 (9 – 17) | −1.3 (−1.7, −0.8) |
| 1ad | -CH3 | -H |
|
weak inhibitora | |
| 1ae | -CH3 | -H |
|
118 (76 – 184) | −0.9 (−1.2, −0.5) |
| 1af | -CF3 | -H |

|
76 (42 – 137) | −1.2 (−1.9, −0.4) |
| 1ag | -CF3 | -H |
|
170 (115 – 250) | −1.7 (−2.5, −09) |
| 1ah | -CF3 | -H |
|
140 (87 – 225) | −1.3 (−1.9, −0.6) |
| 1ai | -CF3 | -H |

|
143 (74 – 276) | −0.8 (−1.3, −0.3) |
| 1aj | -OCF3 | -H |

|
49 (37 – 66) | −2.2 (−3.2, −1.2) |
| 1ak | -OCF3 | -H |

|
98 (75 – 128) | −1.9 (−3.1, −0.8) |
modulatory effect estimated from three concentrations only.
The modifications in the R1 and R3 substituent for 21 compounds having a hydrogen atom in R2 are compared in Appendix C.1. The importance of the hydroxyl group in R3 for high inhibitory activity is evident, while compounds with an ester substituent in R3 have approximately two-fold higher IC50 values (eg. compare 1l and 1k). Additionally, modifications on R3 appear to be more important for the inhibitory activity of these compounds than the modifications on R1 as all six compounds with an ester in R3 are able to inhibit the CDCF transport at least to half of the control at 80 μM, regardless of which substituent is present in the R1 position. The compounds with a bulky R3 group have two- to eight-fold lower activity compared to the smaller hydroxyl or ester substituents. Among these bulky groups the presence of an aromatic ring is more beneficial for the inhibitory activity than a polar or lipophilic group (eg. 1af and 1ag; 1aj and 1m).
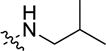
In order to visualize and identify common features of all inhibitors in this scaffold, a common feature pharmacophore was built based on the 21 inhibitors used for the SAR (Figure 2a). Two hydrophobic features and one hydrogen bond donor as well as a hydrogen bond acceptor were identified to be of importance for the activity in scaffold 1. The hydrophobic regions are located on the R1 substituent and on the cyclopentene ring of the scaffold. The hydrogen donor feature is located on the piperidine of the scaffold and the hydrogen bond accepting group on the R3 substituent, which is in line with the findings from our SAR analysis.
Figure 2.
Scaffold-based pharmacophores of A) scaffold 1 superimposed on compound 1ac, B) scaffold 2 superimposed on compound 2ay, C) scaffold 3 superimposed on compound 3ad, D) scaffold 4 superimposed on compound 4ab and E) scaffold 5 superimposed on compound 5ak. Hydrophobic features are shown as cyan spheres, hydrogen bond acceptor features as green spheres and hydrogen bond acceptor features as purple spheres.
3.2 4-Phenyl-3.4-tetrahydropyrimindin-2-one Analogues – Scaffold 2
29 of the compounds tested in this study are assigned to scaffold 2. We further divided this scaffold into three sub-scaffolds based on the variation of R1: H (scaffold 2A), (CH2)3COOH (scaffold 2B) and (CH2)5COOH (scaffold 2C) (Table 3, Appendix B.2–4). The R4 substituent also varies, in scaffold 2A it is an ethylbenzene, while scaffolds 2B and 2C have a methyl group in this position. Previously, we suggested that the most important modification for inhibitory activity in this scaffold is the presence of a carboxylic group in R1 (Wissel et al 2015). The activities of the compounds tested in this study support this hypothesis: more than half of the compounds in scaffold 2A (with no carboxyl group in R1) are inactive, while the majority of the compounds in scaffold 2B and 2C inhibit ABCC2 transport activity (Table 3). We believe that the difference in activity is indeed due to the R1 groups instead of the R4 substituents, since the observed difference in the overall activity of scaffolds 2B and 2C that share the R4 group can be explained by the length (and flexibility) of the carbohydrate chain in R1.
Table 3.
Scaffold 2
| # | -R1 | -R2 | -R3 | -R4 | IC50 (95% CI), μM | Hill slope (95% CI) |
|---|---|---|---|---|---|---|
| 2aa | -H | -CH2CH3 | 4-Br |

|
67 (34–135) | −0.7 (−1.0, −0,4) |
| 2ab | -H | -CH2CH3 |

|
|
weak inhibitor a | |
| 2ac | -(CH2)3COOH | -CH2CBr3 | -H | -CH3 | 31 (26 – 38) | −1.6 (−2.0, −1.3) |
| 2ad | -(CH2)3COOH | -CH2CBr3 | 4-Br | -CH3 | inhibitorb | |
| 2ae | -(CH2)3COOH | -CH2CBr3 | 3-NO2 | -CH3 | 25 (16–37) | −1.4 (−2.1, −0.7) |
| 2af | -(CH2)3COOH | -CH2CH3 | 3-NO2 | -CH3 | inactive | |
| 2ag | -(CH2)3COOH |

|
-H | -CH3 | inactive | |
| 2ah | -(CH2)3COOH |

|
4-Br | -CH3 | 51 (31–83) | n.dc |
| 2ai | -(CH2)3COOH |

|
4-NO2 | -CH3 | Weak inhibitor b | |
| 2aj | -(CH2)3COOH |

|

|
-CH3 | 79 (68 – 92) | −2.0 (−2.9, −1.1) |
| 2ak | -(CH2)3COOH |

|

|
-CH3 | weak inhibitor a | |
| 2al | -(CH2)3COOH |

|
2-Cl, 3-Cl | -CH3 | 15 (13 – 17) | −2.2 (−3.2, −1.1) |
| 2am | -(CH2)3COOH |

|
2-Cl, 4-Cl | -CH3 | 140 (86 – 227) | −1.3 (−2.0, − 0.60) |
| 2an | -(CH2)5COOH | -CH2CH3 | 4-NO2 | -CH3 | 96 (40–231) | −1.8 (−4.7 ; 1.2) |
| 2ao | -(CH2)5COOH | -CH2CH3 | 3-NO2 | -CH3 | Weak inhibitora | |
| 2ap | -(CH2)5COOH | -CH2CH3 | 4-OCH3 | -CH3 | 190 (102– 352) | −1.7 (−3.0, −0.4) |
| 2aq | -(CH2)5COOH | -CH2CH3 | 4-Br | -CH3 | 74 (38 – 143) | −0.9 (−1.5, −0.4) |
| 2ar | -(CH2)5COOH | -C(CH3)3 | 4-Br | -CH3 | weak inhibitora | |
| 2as | -(CH2)5COOH | -CH3 |

|
-CH3 | inhibitorb | |
| 2at | -(CH2)5COOH |

|
-H | -CH3 | 52 (42 – 63) | −1.6 (−2.0, −1.2) |
| 2au | -(CH2)5COOH |

|
2-Cl | -CH3 | 25 (14 – 44) | −1.5 (−2.6, −0.4) |
| 2av | -(CH2)5COOH |

|
3-NO2 | -CH3 | 25 (17 – 36) | −1.4 (−2.0, −0.8) |
| 2aw | -(CH2)5COOH |

|
3-C(CH3)3 | -CH3 | 11 (7–17) | −2.2 (−4,0, −0.4) |
| 2ax | -(CH2)5COOH |
|
4-Cl | -CH3 | 14 (11 – 18) | −1.3 (−1.7, −0.9) |
| 2ay | -(CH2)5COOH |

|
4-Br | -CH3 | 45 (28 – 73) | −3.2 (−5.7, −0.7) |
| 2az | -(CH2)5COOH |
|
4-NO2 | -CH3 | 26 (17 – 42) | −1.5 (−2.4, −0.7) |
| 2ba | -(CH2)5COOH |

|
4-CF3 | -CH3 | inhibitorb | |
| 2bb | -(CH2)5COOH |

|
2-Cl, 3-Cl | -CH3 | 27 (13 – 56) | −0.9 (−1.3, −0.4) |
| 2bc | -(CH2)5COOH |

|
2-Cl, 4-Cl | -CH3 | 55 (38–79) | −1.6 (−2.5, −0.8) |
modulatory effect estimated from three concentrations only;
4-parameter logistic model curve could not be fitted.
Hill coefficient could not be calculated with significant accuracy (within 3 units).
Scaffold 2A
Compounds in scaffold 2A have a free amide in R1 and a bulky R4 group (ethylbenzene, with the exception of compound 2a, methoxylbenzene). As this was the least active of the three sub-scaffolds in our previous study, we tested only two new compounds, both with an ethyl group in position R2. The R3 substitution varies with compound 2aa containing a bromine substitution in the para-position and having moderate inhibitory activity with an IC50 of 67 μM, while 2ab has an extra aromatic ring and was classified as a weak inhibitor. An SAR analysis is not feasible for scaffold 2A due to the low activity of the compounds.
Scaffold 2B
The compounds in scaffold 2B have a butyric acid in position R1 and a methyl group in R4. We tested 11 new molecules in this sub-scaffold, and the strongest inhibitor was found to have an IC50 of 15 μM (2al). For the SAR analysis we observed the variation in the R2 and R3 groups in 23 molecules: 3 inactive, 7 weak inhibitors and 13 inhibitors (Appendix C.3).
The R group analysis in Maestro suggested that the hydrogen bond acceptor and hydrophobic characteristics at position R3 were important for ABCC2 inhibitors. In general, halogen substitutions at both R2 and R3 are positively tolerated. For instance, the compounds with halogen substituents in R2 (2ae and 2ac) are more active compared to the corresponding compounds with aliphatic hydrophobic substitutions (2af and 2i, respectively). Some indications on halogen position selectivity in the R3 ring are found as preference to ortho-meta substitution compared to an ortho-para one, since 2al is a much more potent inhibitor than 2am.
Scaffold 2C
Our previous study included only two molecules with a hexanoic acid in the R1 position, both having inhibitory activity towards ABCC2. Here we tested 16 new compounds belonging to this sub-scaffold and analysed the variation in R2 and R3 (Appendix C.4). All molecules in this sub-scaffold contain a methyl group in R4, similarly to scaffold 2B. This is the most active sub-scaffold, with no inactive compounds. As previously mentioned, a longer linker to the carboxylic group in R1 compared to the other sub-scaffolds seems to be an important modification that leads to increased inhibitory activity on ABCC2. The compounds with an aromatic ring in position R2 are all better inhibitors of ABCC2 compared to the corresponding analogs with lipophilic nonaromatic substitutions (eg. 2ax versus 2p, 2az versus 2an). The influence of the modifications at R3 is not as clear, but the ortho-meta substitution of chlorine (2o, 2bb) on the R3 ring appears to lead to high potency similarly to scaffold 2B.
When comparing the SAR between scaffolds 2B and 2C, we can identify some similarities: chlorine in ortho-meta-positions in R3 leads to inhibitory molecules with an IC50 lower than 50 μM (2al and 2o/2bb), but when the meta-substituent is changed to para, the activity decreases (2am and 2bc). A single chlorine substitution in the para-position is present in two inhibitors (2r, 2ax) that have an aromatic ring in the R2 position. When a small aliphatic substituent replaces the aromatic ring in the R2 position, the resulting compounds display only weak inhibition (2p) or are inactive (2l). The preference for aromatic R2 substitutions is very clear in scaffold 2C; however, it does not appear to have a great influence in scaffold 2B.
The shared pharmacophore of scaffold 2 inhibitors identifies two hydrogen bond acceptors and three conserved hydrophobic features (Figure 2b). In contrast to scaffold 1, a hydrogen bond donor is not found. Similarly to our SAR, the pharmacophore indicates the importance of the carboxylic group in R1, as one of the two hydrogen bond accepting features is aligned with R1 and it also identifies the hydrophobic features in the phenyl group in the R2 substituent to be significant for inhibition. The pharmacophore additionally identifies the carbonyl group and the aromatic ring present in the core scaffold as well as the R4 substituent, which is a methyl group in the more active scaffolds 2B and 2C.
3.3 3-(Phenylamino)-1.2-dihydroisoquinolin-1-one Analogues - Scaffold 3
We tested seven new compounds belonging to scaffold 3, mainly exploring the chemical space of the R2 substituent. Earlier, we presented 10 molecules belonging to this scaffold, where the variations were primarily in the R1 group (Wissel et al. 2015). Of the 17 molecules in this series, three were inactive, four were found to be weak inhibitors and ten were inhibitors (Table 4, Appendix B.3). Compound 3ac is the most potent of the new compounds with an IC50 of 8 μM which makes 3ac comparable to the strongest previously identified molecule in this scaffold (3j with IC50 of 6 μM). Two inactive compounds in this scaffold with a modification of R1 to a piperidine (3a) or with a substitution at R3 (3ae) were excluded from the SAR analysis where we analysed the variance of the R1 and R2 substituents (Appendix C.5). Substitutions at R2 appear to be well tolerated, as all six compounds with an R2 group inhibited ABCC2 transport of CDCF by more than 50 % at 80 μM concentrations, including the three most active compounds in the scaffold (3j, 3ac and 3ad). Additionally, compounds 3aa–3ad with R2 substitutions have higher inhibitory activity than their counterpart, 3c, which lacks an R2 substituent. It is more difficult to determine the effect of the different types of substitutions in the R2 group, but for the R1 group it appears that substitutions that introduce stronger polarity or partial negative charge to the molecule are favourable for inhibition as seen for instance by 3j vs 3aa and 3d, 3f and 3g compared to 3c.
Table 4.
Scaffold 3.
| # | -R1 | -R2 | -R3 | IC50 (95% CI), μM | Hill slope (95% CI) |
|---|---|---|---|---|---|
| 3aa |

|
-Br | -H | 58 (37 – 90) | −1.3 (−1.9, −0.6) |
| 3ab |

|

|
-H | inhibitorb | |
| 3ac |

|

|
-H | 8 (4–16) | −0,9 (−1.4, −0.5) |
| 3ad |

|

|
-H | 23 (19–28) | n.dc |
| 3ae |

|
-H |

|
inactivea | |
| 3af |

|

|
-H | inhibitorb | |
| 3ag |

|
-H | -H | weak inhibitora |
modulatory effect estimated from three concentrations only;
4-parameter logistic model curve could not be fitted.
Hill coefficient could not be calculated with significant accuracy (within 3 units).
The pharmacophore model of the inhibitors from scaffold 3 identifies three features from the substituent groups (Figure 2c). Hydrophobic features are positioned on the R1 and R2 substituents, while a hydrogen bond acceptor is localized to the R2 position. Additionally, the amino group from the scaffold core is recognized as a hydrogen bond donor feature.
3.4 2-Benzyl-2,5-dihydro-1H-pyrrole Analogues - Scaffold 4
24 new molecules belonging to the 2-benzyl-2,5-dihydro-1H-pyrrole scaffold were tested, thereby substantially enlarging the size of the set of eight compounds in our previous study (Table 5, Appendix B.4). A substitution appears either in the R1 or the R3 position, while the other position (R1 if R3 is substituted, or vice versa) is invariably occupied by a hydrogen atom. All three substituent positions were included in the SAR analysis (Appendix C.6).
Table 5.
Scaffold 4
| # | -R1 | -R2 | -R3 | IC50 (95% CI),μM | Hill slope (95% CI) |
|---|---|---|---|---|---|
| 4aa | -H | -CH3 |

|
inactivea | |
| 4ab | -H |

|

|
weak inhibitora | |
| 4ac | -H |

|

|
297 (180 – 490) | −1.3 (−2.3, −0.4) |
| 4ad | -H |

|

|
weak inhibitora | |
| 4ae | -H |

|
|
inactive | |
| 4af | -H |

|

|
weak inhibitora | |
| 4ag | -H |

|

|
inactive | |
| 4ah | -H |

|

|
inactivea | |
| 4ai | -H |

|

|
inactivea | |
| 4aj | -H |

|

|
weak inhibitora | |
| 4ak | -H |

|

|
inactivea | |
| 4al | -H |

|

|
inactivea | |
| 4am | -H |
|

|
stimulator | |
| 4an | -H |

|

|
inactive | |
| 4ao | -H |

|

|
17 (9–31) | −1.1 (−1.6, −0.5) |
| 4ap |

|

|
-H | inactivea | |
| 4aq |

|

|
-H | inactivea | |
| 4ar |

|

|
-H | weak inhibitora | |
| 4as |

|

|
-H | inactive | |
| 4at |

|

|
-H | 28 (20 – 40) | −1.2 (−1.5, −0.8) |
| 4au |

|
|
-H | stimulatora | |
| 4av |

|

|
-H | inactivea | |
| 4aw |

|

|
-H | inactive | |
| 4ax |

|

|
-H | 89 (52–153) | −1.2 (−1.8, −0.5) |
modulatory effect estimated from three concentrations only;
4-parameter logistic model curve could not be fitted
This scaffold is not nearly as active as the previous ones. Only four of the 32 scaffold members were found to be inhibitors, while 11 compounds had a weak inhibitory effect on ABCC2-mediated CDCF transport. The two strongest inhibitors, 4at and 4ao (IC50 28 μM and 17 pM, respectively) have an N-(3-((3-chloro-5-(trifluoromethyl)pyridin-2-yl)amino)propyl)acetamide substitution in the R1 or R3 position, respectively. There is a 3-fold difference in inhibitory activity between 4at and the weaker inhibitor 4ax that both have this substituent in the R1 position, but have different R2 groups, a methyl ester and an acetophenone substituent, respectively. A 5-fold difference in the IC50 value was found between 4ax and 4ao, which both have the acetophenone R2 substituent, while the N-(3-((3-chloro-5-(trifluoromethyl)pyridin-2-yl)amino)propyl)acetamide substituent interchanges between the R1 and R3 positions in these two compounds.
The presence of an anionic group was found to be of importance for the inhibitory activity of compounds belonging to scaffolds 1 and 2 in our previous study; but, in contrast, an anionic group does not appear to have the same effect in scaffold 4. The compounds with a carboxylic acid or methyl ester substitution in the R1 position (4a and 4b) were both weak inhibitors in our previous study (Wissel et al. 2015). Correspondingly, the newly tested compounds with a carboxylic acid in position R3 were either weak inhibitors or inactive (4ab and 4ai), similarly to the compounds with a methyl ester in this position (4aa, 4ac and 4aj).
Two compounds in this scaffold are stimulators. One of them (4au) has a morpholine substituent in R1 and the other (4am) an indole containing group in R3, both with a phenyl ketone in R2. Interestingly, the quite similar compounds 4ae, 4ak and 4aw had no stimulatory or inhibitory effect.
Overall, SAR trends in the 2-benzyl-2,5-dihydro-1H-pyrrole analogues are difficult to discern. One reason for this is that the conserved scaffold core is not as large as in the other scaffolds, and some substituents are of similar size as the scaffold core, causing large changes to the properties of the resulting molecules.
Only five inhibitors were used to build the common pharmacophore, which identifies four hydrophobic features, a hydrogen bond accepting group and a hydrogen bond donor group (Figure 2d). One hydrophobic feature is located at the R2 substituent and another to the phenyl ring of the scaffold, while the remaining features - a hydrogen bond acceptor and donor group as well as two hydrophobic features - were placed on the R1 substituent.
3.5 Benzenesulfonamide analogues - Scaffold 5
43 molecules adopting scaffold 5 were tested for inhibitory activity on CDCF transport by ABCC2. These molecules were selected due to their similarity to the inhibitory compound 10 (Appendix B.6) that we previously identified (Wissel et al 2015). The compounds were divided into two sub-scaffolds depending on the presence (scaffold 5A, Table 6) or absence (scaffold 5B, Table 7) of an aromatic ring connected to the benzenesulfonamide. Scaffold 5A contains 32 molecules; of these seven were found to be inhibitors, 15 weak inhibitors, nine compounds were inactive and one compound stimulated CDCF transport. Overall, scaffold 5A was more potent than scaffold 5B, where only three molecules out of a total of 11 tested compounds showed a weak inhibition and the rest were inactive. The presence of the additional aryl group in scaffold 5A compared to scaffold 5B appears to be important for activity. Interestingly, adding another aryl at R2 in scaffold 5A leads to compounds with low or no inhibitory activity (5ab, 5ac), while an additional aryl at R1 is found in the two strongest inhibitors of scaffold 5A (5ax, 5ay), both with an IC50 lower than 30μM. The compound 5az also contains an additional aryl group in the R1 position, but has a ten-fold higher IC50 compared to 5ax and 5ay, which could be attributed to the dioxane ring on R2. There are two other compounds containing dioxane substitutions at R2; 5aq is an inactive compound and 5aj is an inhibitor, but has a chlorine substitution at the para-position in R1. Halogen substitutions seem to be favorable for inhibitory activity (for example compounds 5ag versus 5ak, 5aa versus 5aw), which is consistent within this study. The three compounds without any substitutions in R2 are inactive (5an, 5bd and 5ad). Similarly as in scaffold 4, a carboxylic acid group does not appear to be a useful feature for the inhibitory activity, as compounds containing carboxylic acids are either weak inhibitors (5ai, 5ap, 5bf) or inactive (5ao). In the pharmacophore built from the inhibitors within the benzenesulfonamide scaffold, a hydrophobic feature was localized to the R1 substituent, while both a hydrogen bond acceptor and a hydrophobic feature were identified at the R2.
Table 6.
Scaffold 5A.
| # | R1 | R2 | R3 | IC50 (95% CI), μM | Hill slope (95% CI) |
|---|---|---|---|---|---|
| 5aa | 4-CF3 | 2-F; 5-F | -H | 59 (33 – 105) | −1.5 (−2.6, −0.3) |
| 5ab | 4-F |

|
-H | inactivea | |
| 5ac | 4-CH3 |

|
-H | 198 (111 – 354) | −1.4 (−2.3, −0.4) |
| 5ad | 4-NO2 | -H | -H | inactivea | |
| 5ae | 4-NO2 | 4- CH3 | -H | 81 (65–102) | −2.1 (−3.8, −0,42) |
| 5af | 4-NO2 | 2- CH3; 4-Cl | -H | 34 (21 – 53) | −1.2 (−1.8, −0.6) |
| 5ag | 4-Cl | 2-OCH3 | -H | weak inhibitora | |
| 5ah | 4-Cl | 4-CH3 | -H | inhibitorb | |
| 5ai | 4- Cl |

|
-CH3 | weak inhibitora | |
| 5aj | 4- Cl |

|
-H | inhibitorb | |
| 5ak | 4-Cl | 2-OCH3; 5-Cl | -H | 67 (41–108) | −2.0 (−4.6,0.5) |
| 5al |

|
3-NO2 | -H | stimulatora | |
| 5am |

|
3- SCH3 | -H | 89 (57–141) | n.dc |
| 5an |

|
-H | -CH3 | inactive | |
| 5ao |
|
2-F | -H | inactivea | |
| 5ap |

|
4-OH | -H | 108 (69 – 167) | −1.4 (−2.2, −0.6) |
| 5aq | 3-OCH3 |

|
-H | inactivea | |
| 5ar | 3- F; 4-F | 2-OCH3; 5-CH3 | -H | weak inhibitora | |
| 5as | 2-OCH3; 5-OCH3 | 4-Cl | -H | weak inhibitora | |
| 5at | 2-OCH3; 5-OCH3 | 4- CH2CH3 | -H | weak inhibitora | |
| 5au | 2-OCH3; 4-Cl; 5-OCH3 | 4-F | -H | 288 (175–472) | −0.9 (−1.4, −0.4) |
| 5av | 2-CH3; 5-CH3 | 2-OCH3; 5-OCH3 | -H | inactivea | |
| 5aw | 2- CH3;5 NO2 | 2-F; 5-F | -H | weak inhibitora | |
| 5ax |

|
4-F | -H | 29 (21 – 41) | −2.1 (−3.1, −1.2) |
| 5ay |

|
4-OCH2CH3 | -H | 27 (18 – 41) | −1.8 (−2.8, −0.8) |
| 5az |

|

|
-H | 311(106 – 912) | −1.1 (−2.6,0.4) |
| 5ba |

|
2-F | -H | inactivea | |
| 5bb |
|
4-Cl | -H | 97 (57 – 167) | n.dc |
| 5bc |

|
2-CH3; 6-CH3 | -H | inactivea | |
| 5bd |
|
-H | -CH2CH3 | inactivea | |
| 5be |

|
4- CH3 | -H | weak inhibitora | |
| 5bf |

|
|
-H | weak inhibitora |
modulatory effect estimated from three concentrations only;
4-parameter logistic model curve could not be fitted.
Hill coefficient could not be calculated with significant accuracy (within 3 units).
Table 7.
Scaffold 5B.
| R1 | R2 | IC50 (95% CI), μM | Hill slope (95% CI) | |
|---|---|---|---|---|
| 5bg | -H |

|
weak inhibitora | |
| 5bh | -H |
|
136 (83 – 223) | −0.8 (−1.2 ; −0.5) |
| 5bi | 4-CH3 |
|
inactivea | |
| 5bj | 4-CH3 |
|
inactivea | |
| 5bk | 4-CH3 |

|
inactivea | |
| 5bl | 4-CH3 |

|
inactivea | |
| 5bm | 4-OCH3 |

|
inactivea | |
| 5bn | 4-NH2 |

|
inactivea | |
| 5bo |

|

|
inactive | |
| 5bp |
|
|
weak inhibitora | |
| 5bq | 2-CH3; 5-NO2 |

|
inactive |
modulatory effect estimated from three concentrations only;
4-parameter logistic model curve could not be fitted.
Hill coefficient could not be calculated with significant accuracy (within 3 units).
3.6 General features of ABCC2 inhibitors
The structure of ABCC2 is not yet known, but the crystal structures of related mammalian ABC transporters have been reported (Aller et al 2009, Lee et al 2016). A common feature of these transporters is a large cavity formed within their transmembrane domains, which is likely to contain the substrate binding site (Aller et al 2009). The modulatory sites might be found outside the substrate binding cavity, for instance in the ATP-binding domains. Due to the low sequence identity of ABCC2 to the known crystal structures of ABC transporters and the uncertainty of the location of the binding sites of modulators, we have not discussed the SAR in relation to the structure of ABCC2. It should be kept in mind that the analogues in this study might bind to different binding sites, or that compounds within a scaffold could bind to different (or multiple) sites. However, some indications of the influence of structural features on the inhibitory activity can still be found within the scaffolds and even to some extent between the scaffolds. The current study confirms that anionic charge is not essential for inhibitory activity of ABCC2 (Pedersen et al. 2008, Wissel et al. 2015), even though it has been found to be important in a smaller analogue series (Han et al. 2001; Ng et al. 2005) and for substrate identification (Pinto et al. 2012). For example, compounds with carboxylic acids in scaffolds 4 and 5 are not among the most active within the scaffolds, while within scaffolds 1 and 2 the presence of a carboxylic acid improves the inhibitory activity.
Aromaticity has previously been identified to distinguish ABCC2 inhibitors from non-inhibitors (Pedersen et al. 2008; Zhang et al. 2009; Wissel et al. 2015), which is in agreement with our finding that scaffold 5A containing an additional aromatic ring is more active than scaffold 5B, or that compounds with aromatic substitutions in scaffolds 1 and 2B show better inhibitory activity than compounds with other bulky or lipophilic groups. However, we found that the position of the aromatic substitution is important for inhibitory activity in scaffold 5A. Even though the addition of one aromatic ring increased the activity compared to scaffold 5B, adding a second ring at the same location (R2) resulted in compounds with low or no inhibitory activity, while the two strongest inhibitors in this sub-scaffold instead have aromatic substitutions at position R1.
The importance of halogen substitutions has not been previously reported for ABCC2 inhibitors, but the number of chlorine and bromine atoms was identified to be an important descriptor for ABCC2 substrate identification (Pinto et al. 2012). Based on our SAR, halogen substitutions often increase the inhibitory activity, which is observed especially within scaffolds 2 and 5.
The five scaffold-based pharmacophores were evaluated with a test set of 157 compounds, which included the compounds used to build the pharmacophores. Overall, we could find reasonable accuracy in the retrospective test (ranging between 0.541–0.618, MCC range 0.199–0.402). The pharmacophores based on inhibitors from scaffold 1,3 or 5, were able to retrieve most of the inhibitors from the test set, but were not very successful in distinguishing inhibitors from the inactive compounds (Appendix D.1). However, it is very difficult to identify discriminative features inside a scaffold in part due to lack of data. Even though our pharmacophore models show reasonable accuracy in retrospective tests, further work would be needed to gain interpretability about the relation between features and substituents. A real prospective study would be needed to test these pharmacophores in a prospective way, however, the accuracies of the models are encouraging. A common feature pharmacophore of all inhibitors in this study was not built, due the difficulty to superimpose the structurally diverse inhibitors. Still, there are similarities in the scaffold-based pharmacophores as they all contain at least two hydrophobic features and one hydrogen bond acceptor feature (Figure 2). The pharmacophores of scaffold 1 and 3 additionally contain only a hydrogen bond donor feature and have similar structural localisations of these four features. However, in the pharmacophore of scaffold 3, the acceptor and donor features are much closer to the hydrophobic features (6.4–7.1 Å) than in the pharmacophore of scaffold 1 (3.1–4.4 Å). Overall, the pharmacophores differ from the previously reported ABCC2 pharmacophore, which was based on nine inhibitors and contained one hydrophobic and two hydrogen bond acceptor features (Zhang et al. 2009).
4. CONCLUSION
We have investigated 114 new compounds for ABCC2 inhibitory activity and combined the results with our previous data (Wissel et al. 2015). The compounds were divided into five scaffolds, of which the compounds in scaffolds 1–3 in general had higher inhibitory activity on ABCC2, while the majority of the compounds in scaffolds 4–5 were weak inhibitors or inactive. Construction of a common pharmacophore of all inhibitors could not be achieved, but each individual scaffold pharmacophore contained at least two hydrophobic features and one hydrogen bond acceptor feature. According to the SAR analysis, the aromaticity and lipophilicity influence inhibitory activity, while anionic charge is not mandatory for inhibition. Moreover, the halogen substitutions increased the inhibition, particularly within scaffolds 2 and 5. These results improve our understanding of chemical properties that have the potential to cause ABCC2-mediated hepatic drug interactions. We have also identified a diverse group of ABCC2 inhibitors, which could be further used to investigate the inhibitor specificity among ABC-transporters, as there currently is a lack of transporter-specific inhibitors, especially among the ABCC-subfamily of efflux transporters.
Supplementary Material
Acknowledgments
This study was supported by the Academy of Finland (257786, 265234, and 292779), the Orion-Farmos Research Foundation and the National Institutes of Health P50 CMLD Program (GM067082) for support. GW would like to thank the Magnus Ehrnrooth foundation, the Oskar Öflund foundation, and the Finnish Cultural Foundation for financial support. The Center for International Mobility (CIMO) supported both GW and PK. We acknowledge the Drug Discovery and Chemical Biology Network, funded by Biocenter Finland, for providing access to screening instrumentation.
Abbreviations
- ABC
ATP binding cassette
- ABCC2
ATP binding cassette protein subfamily C member 2
- CDCF
5(6)-Carboxy-2′, 7′-dichlorofluorescein
- SAR
Structure-activity relationship
APPENDICES
A. 1 Dose-response curves of all new compounds.
B. 1–6 Activity of all new compounds and compounds in scaffold 1–5 previously published in Wissel et al. 2015.
C. 1–6 Variation of R groups in scaffolds 1–4
D. 1 Evaluation of pharmacophores.
Footnotes
Publisher's Disclaimer: This is a PDF file of an unedited manuscript that has been accepted for publication. As a service to our customers we are providing this early version of the manuscript. The manuscript will undergo copyediting, typesetting, and review of the resulting proof before it is published in its final citable form. Please note that during the production process errors may be discovered which could affect the content, and all legal disclaimers that apply to the journal pertain.
References
- Aller SG, et al. Structure of P-glycoprotein reveals a molecular basis for poly-specific drug binding. Science (New York, NY) 2009;323(5922):1718–22. doi: 10.1126/science.1168750. [DOI] [PMC free article] [PubMed] [Google Scholar]
- Coburger C, et al. Novel structure-activity relationships and selectivity profiling of cage dimeric 1,4-dihydropyridines as multidrug resistance (MDR) modulators. Bioorg Med Chem. 2010;18(14):4983–90. doi: 10.1016/j.bmc.2010.06.004. [DOI] [PubMed] [Google Scholar]
- Han YH, et al. Physicochemical parameters responsible for the affinity of methotrexate analogs for rat canalicular multispecific organic anion transporter (cMOAT/MRP2) Pharmaceutical research. 2001;18(5):579–86. doi: 10.1023/a:1011064806507. [DOI] [PubMed] [Google Scholar]
- Hillgren KM, et al. Emerging transporters of clinical importance: an update from the International Transporter Consortium. Clin Pharmacol Ther. 2013;94(1):52–63. doi: 10.1038/clpt.2013.74. [DOI] [PubMed] [Google Scholar]
- Hirono S, et al. Estimation of the three-dimensional pharmacophore of ligands for rat multidrug-resistance-associated protein 2 using ligand-based drug design techniques. Pharmaceutical research. 2005;22(2):260–9. doi: 10.1007/s01869-005-1869-8. [DOI] [PubMed] [Google Scholar]
- Hooijberg JH, et al. Antifolate Resistance Mediated by the Multidrug Resistance Proteins MRP1 and MRP2. Cancer Res. 1999;59(11):2532–2535. [PubMed] [Google Scholar]
- Irwin JJ, et al. An Aggregation Advisor for Ligand Discovery. J Med Chem. 2015;58(17):7076–87. doi: 10.1021/acs.jmedchem.5b01105. [DOI] [PMC free article] [PubMed] [Google Scholar]
- Kamisako T, et al. Transport of monoglucuronosyl and bisglucuronosyl bilirubin by recombinant human and rat multidrug resistance protein 2. Hepatology (Baltimore, Md) 1999;30(2):485–90. doi: 10.1002/hep.510300220. [DOI] [PubMed] [Google Scholar]
- Keppler D, König J, Büchler M. The canalicular multidrug resistance protein, cMRP/MRP2, a novel conjugate export pump expressed in the apical membrane of hepatocytes. Advances in enzyme regulation. 1997;37:321–33. doi: 10.1016/s0065-2571(96)00013-1. [DOI] [PubMed] [Google Scholar]
- Kidron H, et al. Impact of probe compound in MRP2 vesicular transport assays. European Journal of Pharmaceutical Sciences. 2012;46(1–2):100–105. doi: 10.1016/j.ejps.2012.02.016. [DOI] [PubMed] [Google Scholar]
- König J, et al. Conjugate export pumps of the multidrug resistance protein (MRP) family: localization, substrate specificity, and MRP2-mediated drug resistance. Biochimica et Biophysica Acta. 1999;1461:337–394. doi: 10.1016/s0005-2736(99)00169-8. [DOI] [PubMed] [Google Scholar]
- Lai Y, et al. Structure-activity relationships for interaction with multidrug resistance protein 2 (ABCC2/MRP2): the role of torsion angle for a series of biphenyl-substituted heterocycles. Drug metabolism and disposition: the biological fate of chemicals. 2007;35(6):937–45. doi: 10.1124/dmd.106.013250. [DOI] [PubMed] [Google Scholar]
- Lee JY, et al. Crystal structure of the human sterol transporter ABCG5/ABCG8. Nature. 2016;533(7604):561–4. doi: 10.1038/nature17666. [DOI] [PMC free article] [PubMed] [Google Scholar]
- Li J, Jaimes KF, Aller SG. Refined structures of mouse P-glycoprotein. Protein science: a publication of the Protein Society. 2014;23(1):34–46. doi: 10.1002/pro.2387. [DOI] [PMC free article] [PubMed] [Google Scholar]
- Matsson P, et al. Identification of novel specific and general inhibitors of the three major human ATP-binding cassette transporters P-gp, BCRP and MRP2 among registered drugs. Pharmaceutical research. 2009;26(8):1816–31. doi: 10.1007/s11095-009-9896-0. [DOI] [PubMed] [Google Scholar]
- Ng C, et al. Quantitative structure-activity relationships of methotrexate and methotrexate analogues transported by the rat multispecific resistance-associated protein 2 (rMrp2) European journal of pharmaceutical sciences: official journal of the European Federation for Pharmaceutical Sciences. 2005;26(5):405–13. doi: 10.1016/j.ejps.2005.07.008. [DOI] [PubMed] [Google Scholar]
- Pedersen JM, et al. Prediction and identification of drug interactions with the human ATP- binding cassette transporter multidrug-resistance associated protein 2 (MRP2; ABCC2) Journal of medicinal chemistry. 2008;51(11):3275–87. doi: 10.1021/jm7015683. [DOI] [PubMed] [Google Scholar]
- Peters GJ, et al. Folates and antifolates in the treatment of cancer; role of folic acid supplementation on efficacy of folate and non-folate drugs. Trends in Food Science & Technology. 2005;16(6–7):289–297. [Google Scholar]
- Pinto M, et al. An In Silico Classification Model for Putative ABCC2 Substrates. Mol Inform. 2012;31(8):547–553. doi: 10.1002/minf.201200049. [DOI] [PMC free article] [PubMed] [Google Scholar]
- Schuffenhauer A, et al. The scaffold tree–visualization of the scaffold universe by hierarchical scaffold classification. Journal of chemical information and modeling. 2007;47(1):47–58. doi: 10.1021/ci600338x. [DOI] [PubMed] [Google Scholar]
- Taniguchi K, Wada M, Kohno K. canalicular multispecific organic anion transporter (cMOAT) gene is overexpressed in cisplatin-resistant human cancer cell lines with decreased drug accumulation. Cancer Research. 1996:4124–4129. [PubMed] [Google Scholar]
- Wissel G, et al. Exploring the structure-activity relationships of ABCC2 modulators using a screening approach. Bioorg Med Chem. 2015;23(13):3513–25. doi: 10.1016/j.bmc.2015.04.029. [DOI] [PMC free article] [PubMed] [Google Scholar]
- Xing L, Hu Y, Lai Y. Advancement of structure-activity relationship of multidrug resistance-associated protein 2 interactions. The AAPS journal. 2009;11(3):406–13. doi: 10.1208/s12248-009-9117-0. [DOI] [PMC free article] [PubMed] [Google Scholar]
- Van Zanden JJ, et al. Quantitative structure activity relationship studies on the flavonoid mediated inhibition of multidrug resistance proteins 1 and 2. Biochemical pharmacology. 2005;69(4):699–708. doi: 10.1016/j.bcp.2004.11.002. [DOI] [PubMed] [Google Scholar]
- Zhang H, et al. Support vector machine and pharmacophore-based prediction models of multidrug-resistance protein 2 (MRP2) inhibitors. European journal of pharmaceutical sciences: official journal of the European Federation for Pharmaceutical Sciences. 2009;36(4–5):451–7. doi: 10.1016/j.ejps.2008.11.014. [DOI] [PubMed] [Google Scholar]
Associated Data
This section collects any data citations, data availability statements, or supplementary materials included in this article.