Abstract
The present study evaluated the effect of nanochitosan in combination with plant growth promoting rhizobacteria (PGPR), PS2 and PS10 on maize growth. The PGPR were earlier recognized as Bacillus spp. on the basis of 16S rDNA sequencing. The observation revealed enhanced plant health parameters like seed germination (from 60 to 96.97%), plant height (1.5-fold increase), and leaf area (twofold). Variability in different physicochemical parameters (pH, oxidizable organic carbon, available phosphorous, available potassium, ammoniacal nitrogen and nitrate nitrogen) was observed. Activities of soil health indicator enzymes (dehydrogenase, fluorescein diacetate hydrolysis and alkaline phosphatase) were also enhanced 2 to 3 fold. Plant metabolites with respect to different treatments were also analyzed using gas chromatography–mass spectroscopy (GC–MS) and the result revealed an increase in the amounts of alcohols, acid ester and aldehyde compounds. Increase in organic acids indicates increased stress tolerance mechanism operating in maize plant after treatment of nanochitosan.
Electronic supplementary material
The online version of this article (doi:10.1007/s13205-017-0668-y) contains supplementary material, which is available to authorized users.
Keywords: Maize, Soil health, Nanochitosan, Plant health, GC–MS
Introduction
Maize is one of the most important crops contributing to food security in developing nations including India. It is a kharif crop and accounts for about 9% of total grain production in India. Increasing world population has led to a decrease in the availability of agriculture land, and necessitates the use of advanced technologies like nanotechnology to revolutionize agriculture production. Nanotechnology in agriculture deals with use of nano-sized (0.2–100 nm) particles for the precision farming. Several nanoparticles (SiO2, TiO2 and ZnO) can support productivity by enhancing seed germination and growth (Lu et al. 2002). Chitosan is a good choice for nanoparticle preparation due to its biodegradability, high permeability, cost effectiveness and nontoxic properties (Shukla et al. 2013).
Chitosan has broad antimicrobial activity against fungal pathogens (Meng et al. 2011); however, the bulk size limits its solubility which affects the antimicrobial property. Chitosan nanoparticles have great potential over the bulk counterparts as size can alter several properties compare to bulk material (Li et al. 2010; Nel et al. 2006). The exclusive properties of these materials, such as a large surface area and greater reactivity, have also raised concerns about adverse effects on environmental health (Maynard et al. 2006). Nanochitosan, a biodegradable and natural nanocompound, may be safe for the environment. Similarly, Aminiyan et al. (2015) also studied the effect of some natural products, zeolite and nanochitosan on aggregation stability and organic carbon status of soil and observed that nanochitosan followed by zeolite gave the best results by enhancing the organic carbon of the soil and stabilizing the micro and macro aggregates.
Plant growth promoting rhizobacteria (PGPR) are already known to enhance plant vitality and also support soil health (Kloepper et al. 1980). The combination of nanochitosan with PGPR may synergistically give better results than their application alone. The aim of this study is to evaluate the effect of nanochitosan in combination with PGPR isolates on maize growth promotion and to also assess possible side effects in terms of soil health. The plant growth parameters (plant height, leaf area, number of leaves, chlorophyll content and total protein content) were investigated to observe the direct effect of nanochitosan on plant growth viability, but on the other side soil health parameters (pH, organic carbon, nitrogen, available phosphorous, potassium, FDA hydrolysis activity and enzyme assays) were also investigated to see the effect of nanochitosan on soil and environment.
Materials and methods
Chemicals used
The nanochitosan was purchased from Intelligent material Pvt. Ltd India and physicochemical properties as supplied are given in supplementary material 1. Other chemicals were purchased from SRL and Hi media Laboratories Pvt. Ltd. India.
Culture conditions
The bacterial isolates (PS2 and PS10) used for the experiment were Gram-positive rod-shaped PGPRs, and characterized as Bacillus spp. according to 16SrDNA sequencing.
Soil amendment with nanochitosan and bacterial culture for maize trial
The fine sieved soil (2 kg per pot) was taken from Norman E. Borlogue Crop Research Centre of G.B. Pant University of Agriculture and Technology, Pantnagar, Dist. Udham Singh Nagar (Uttarakhand), India. This center is situated at an altitude of 243.84 above mean sea level, 29° N latitude and 79.3° E longitudes. For sterilization, soil was autoclaved three times with intermittent time gap of 1 day. The physicochemical properties of test soil sample are discussed in supplementary material 2. Different treatments were made according to different combinations of nanochitosan and bacterial isolates. The pot trial was conducted with sterilized and unsterilized soil during May 2016 to see the effect of nanochitosan in controlled and natural conditions, respectively (Table 1). The seeds were soaked in 5 ml active culture broth to maintain a population of about 1 × 10⁵, which were treated with nanochitosan (@ 50 ppm). The pot trial was performed on the basis of CRD with three replicate per treatment. The seeds were sown @10 each pot to maintain homogeneity in the experiment and watered after every 48 h.
Table 1.
Different treatments used in pot trial and abbreviations used
| Serial no. | Treatments | Abbreviations used |
|---|---|---|
| 1 | Nanochitosan treatment with PS2 in sterilized soil | NC + PS2 + SS |
| 2 | Nanochitosan treatment with PS2 in unsterilized soil | NC + PS2 + USS |
| 3 | Nanochitosan treatment with PS10 in sterilized soil | NC + PS10 + SS |
| 4 | Nanochitosan treatment with PS10 in unsterilized soil | NC + PS10 + USS |
| 5 | Nanochitosan treatment in sterilized soil | NC + SS |
| 6 | Nanochitosan treatment in unsterilized soil | NC + USS |
| 7 | Absolute control in sterilized soil | AC + SS |
| 8 | Absolute control in unsterilized soil | AC + USS |
Growth characteristics
After the seedlings were grown with nanochitosan in combination with PGPR strain amended soil, the changes in physiological parameters were observed. During this study, the seed germination percentage of each treatment pot was evaluated. Further, the growth characteristics were measured in terms of stem height, number of leaves, and leaf area after 30 days of maize growth and mean values were considered for further analysis (Yoshida et al. 1972).
Chlorophyll determination
Chlorophyll was extracted with 80% acetone and the ratio of chlorophyll a to chlorophyll b in the leaf samples was determined by spectrophotometer (Arnon 1949).
Gas chromatography–mass spectroscopy (GC–MS)
Plants from unsterilized and sterilized treatments were combined and shade dried (20 days) for methanol extraction. GC–MS (Shimadzu GC–MS QP Ver. 2010) was done with GC silica column (30 m 90.25 mm) at a flow rate of 1 ml min−1 at 8 °C and, then the temperature was raised to 260 °C. The volatile compounds present in different samples were identified by comparing with the standards or the mass spectrum matched with the inbuilt library (Wiley 9).
Physicochemical analysis of soil
The test soil sample was collected after 30 days of treatment. Different physicochemical tests (pH, organic carbon, available potassium, available phosphorous, nitrate nitrogen and ammoniacal nitrogen) were performed qualitatively with the Hi Media kit.
Soil enzymes assays
Fluorescein diacetate hydrolysis (FDA)
FDA hydrolysis assay was done according to Schurer and Rosswall (1982) method. One gram of soil sample was incubated with 50 ml of 60 mM Sodium phosphate buffer pH 7.6 and 0.50 ml of FDA solution (5 mg in 10 ml acetone). The suspension was incubated at 24 °C. Aliquots were withdrawn at regular interval of 1, 2 and 3 h and FDA hydrolysis was stopped by adding 1 ml acetone to a 6 ml aliquot, centrifuged (8000 rpm for 5 min) and filtered. Absorbance was recorded at 490 nm. Fluorescein was used as standard.
Dehydrogenase activity
Modified method of Casida et al. (1964) was followed using triphenyl tetrazolium formazan (TTF) as standard. To 5 g soil sample, 5 ml of 2, 3, 5-triphenyl tetrazolium chloride (TTC) solution (2 g in 100 ml) and 0.1 M tris buffer (pH 7.4) was added. After incubation (37 °C, 120 rpm for 8 h), 25 ml acetone or methanol was added to extract triphenyl formazan (TPF). Mixture was centrifuged at 4500 rpm for 10 min at 4 °C to obtain supernatant and absorbance recorded at 485 nm.
Alkaline phosphatase activity
One gram of each dry soil was mixed with 0.25 ml toluene; 4 ml of Modified universal buffer (MUB) (100 mM, pH 11) and 1 ml p-nitrophenyl phosphate (pNPP) (25 mM) were added. After incubation at 37 °C for 1 h, one ml of CaCl2 (0.5 M) and 4 ml of tris buffer (0.1 M, pH 12) were added to stop the reaction. Intensity of the color was determined using spectrophotometer at 400 nm (Tabatabai and Bremner 1969). Para-nitrophenyl (pNP) was used as standard. Enzyme activity was calculated as µM of product formed in 1 min and represented as unit (U).
Statistical analysis
The data were statistically treated using general linear model procedure (SPSS, Ver. 16.0) to revel significant effect of nanochitosan treatment in combination with PGPR isolates on maize crop.
Result and discussion
Seed germination
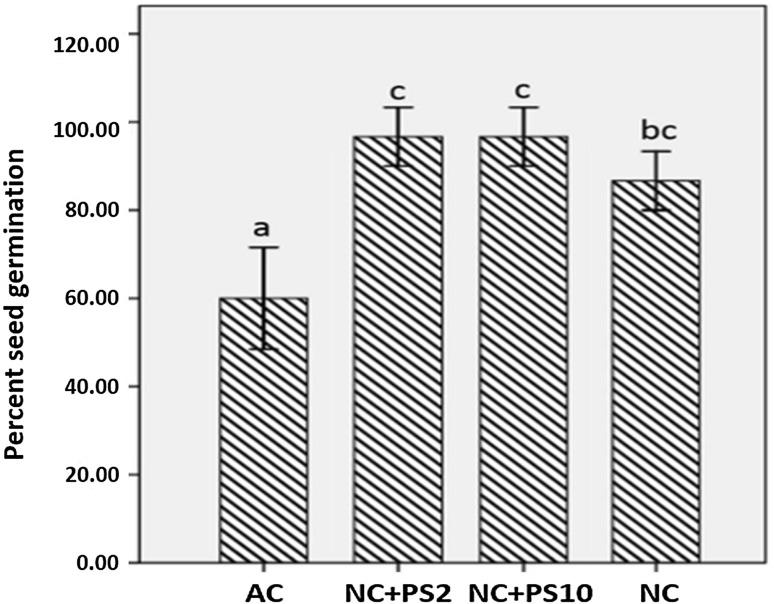
Percentage germination of Zea mays seeds was positively affected by nanochitosan treatment at 50 ppm concentration. A statistically significant increase in percent germination was observed (Fig. 1). Maximal percent germination of 96.67% was recorded on 3rd day after inoculation, while in control seeds the percent germination was only 60% after similar incubation period. This indicates that nanochitosan treatment induced the seed germination, which could be due to the increased permeability of seed capsule, facilitating the admission of water and di-oxygen into the cells, which accelerates the metabolism and germination process (Zheng et al. 2005).
Fig. 1.
% Seed germination. Mean values with standard deviation bars, n = 3
Plant health parameters and chlorophyll content
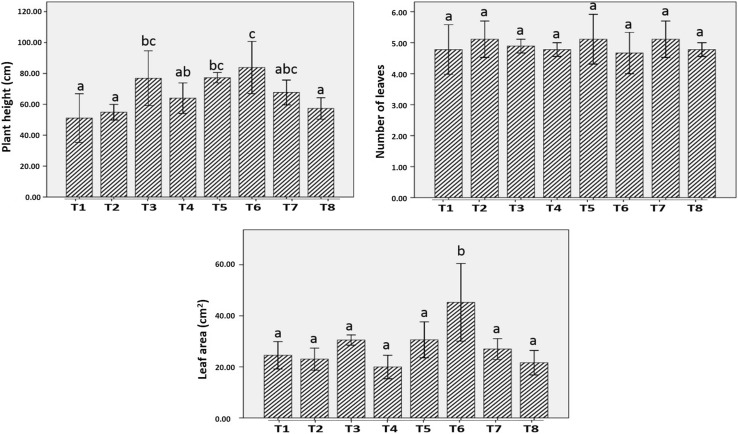
Different values of plant health parameters are given in Table 2. Application of nanochitosan caused an increase in average plant height, as compared to the untreated seedlings. Highest plant height was observed in NC + PS2 + USS (83.84 cm) and minimum was found in AC + SS (51.08 cm) (Table 2). The observed phenomenon might be attributed to an increased level of gibberellic acid (GAs), as GA is mainly responsible for shoot elongation (Stepanova et al. 2007). Silver nanoparticle treatment is also reported to increase the plant height of Borago (Seif et al. 2011).
Table 2.
Plant health parameters
| Treatment | Plant health parameters (mean ± SD, n = 3) | ||
|---|---|---|---|
| Plant height (cm) | Number of leaves | Leaf area (cm2) | |
| NC + PS2 + SS | 77.24 ± 2.86bc | 5.11 ± 0.693a | 30.58 ± 6.09a |
| NC + PS2 + USS | 83.84 ± 14.63c | 4.66 ± 0.58a | 45.27 ± 13.17b |
| NC + PS10 + SS | 76.89 ± 15.34bc | 4.89 ± 0.192a | 30.08 ± 1.74a |
| NC + PS10 + USS | 63.96 ± 8.58ab | 4.78 ± 0.192a | 19.94 ± 3.99a |
| NC + SS | 67.69 ± 6.97abc | 5.11 ± 0.509a | 26.97 ± 3.54a |
| NC + USS | 57.32 ± 6.03a | 4.77 ± 0.192a | 21.61 ± 4.15a |
| AC + SS | 51.08 ± 13.65a | 4.77 ± 0.69a | 24.53 ± 4.6a |
| AC + USS | 54.87 ± 4.36a | 5.11 ± 0.509a | 23.01 ± 3.73a |
Values within a column followed by single letters (a, b, c) show significant varietal difference by Duncan’s test
No significant increase in number of leaves per plant was observed in any nanochitosan treatment, as compared to the control seedlings (Fig. 2). However, nanochitosan treatment statistically increases the average leaf area of the treated seedlings (Fig. 2). Maximum leaf area was observed in NC + PS2 + USS (45.27 cm2), which was greater than control (3.01 cm2) and the least was observed in NC + PS10 + USS (19.94 cm2). Leaf number as well as leaf area is regulated by a complex interaction of various genes whose expression is modulated by growth hormones (Gonzalez et al. 2010). Ethylene controls the leaf number by regulating leaf abscission and inhibition of ethylene action reduces the event of abscission (Seif et al. 2011).
Fig. 2.
Plant health parameters. Mean values with standard deviation bars, n = 3
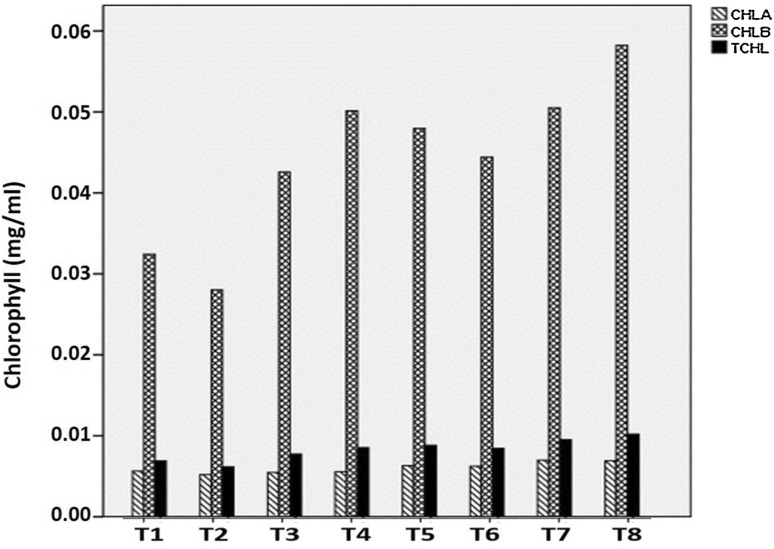
Total chlorophyll contents increased by 1.5- to 2-fold in the seedlings treated with different combination of nanochitosan with PGPR (PS2 and PS10) (Fig. 3). Increase in total chlorophyll contents leads to an increase in the total photosynthate produced (Urbonaviciute et al. 2006). It has been reported that nanoparticle treatment could induce higher chlorophyll contents in Asparagus and Sorghum (Namasivayam and Chitrakala 2011). Purvis (1980) has reported that higher ethylene causes an increase in activity of chlorophyllase enzyme and destruction of internal chloroplast membranes. The implied inhibition of ethylene action by nanochitosan is responsible for higher chlorophyll contents in the treated seedlings.
Fig. 3.
Chlorophyll content as affected by different treatments
GC–MS chromatography
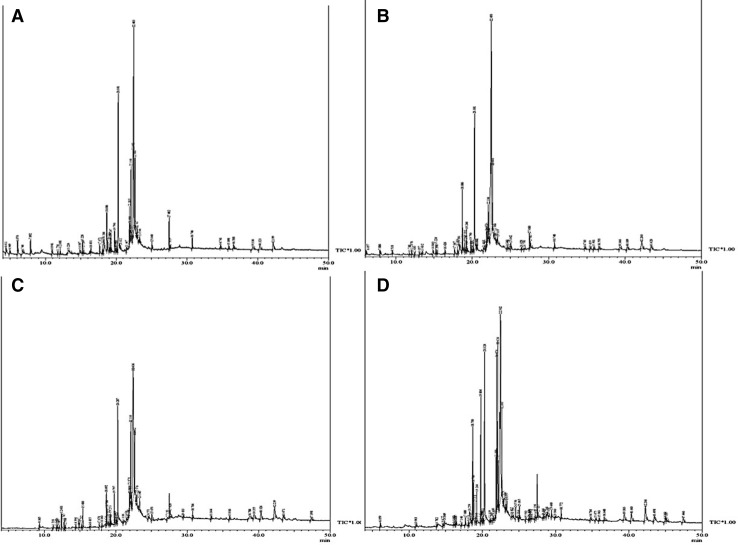
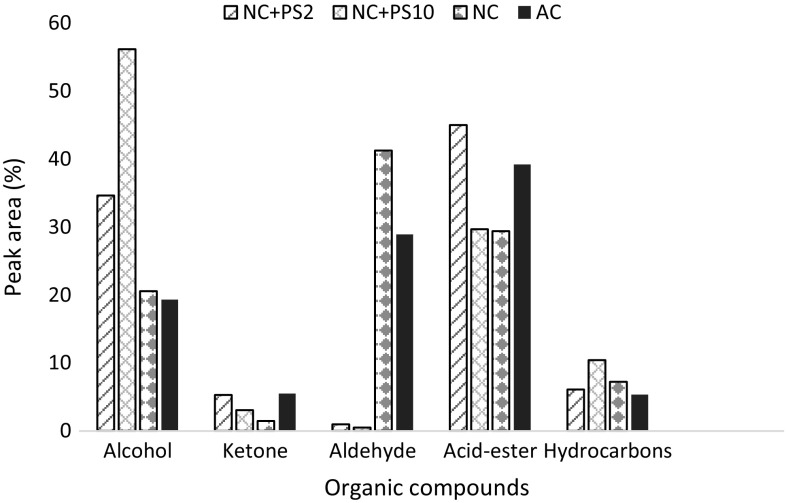
The modulations in total organic compounds according to the treatments of nanochitosan with PGPRs are elucidated from GC–MS results (Fig. 4). A relative abundance of volatile compounds in maize leaf extract with respect to the retention time is presented in the chromatograph (Fig. 4). Area percentage (%) of aldehydes, ketones, alkanes, alcohols and acid–esters of the treated leaf samples is evaluated using Wiley library 9 and their abundance is plotted in Fig. 5. Specific stress-tolerant mechanisms in the plant are reflected by the abundance of the phenolic compounds in the leaf extract. Total organic compounds, such as phenols, aldehydes, ketones, etc., are found to be enhanced in maize leaves treated with nanochitosan in combination with PGPR. The other organic compounds are not varied considerably. These results are correlated with the study on the protective mechanism of silicon in rice through phenols (Goto et al. 2003).
Fig. 4.
GC–MS chromatogram of Maize leaves after different treatments: a nanochitosan + PS2, b nanochitosan + PS10, c nanochitosan and d control
Fig. 5.
Percent peak area of different organic compounds after different treatments for 30 days
Physicochemical analysis of test soil samples after 30th day
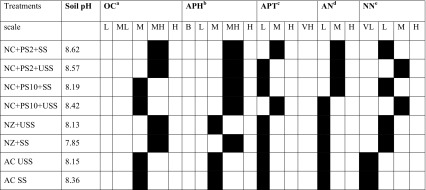
The physicochemical parameters of different test soil samples are discussed in Table 3. A varied range of pH was observed in different treatments including control and most of them were towards alkaline. A shift in organic carbon (OC) from medium (M: 0.1–0.3 Kgha−1) to high (H: 0.3–0.5 Kgha−1) was observed in NC + PS2 + SS, NC + PS2 + USS, NC + USS and NC + SS, whereas no difference in NC + PS10 + SS and NC + PS10 + USS was observed as compared to control.
Table 3.
Physicochemical properties of test soil samples as per “K054 soil testing Kit; Himedia Laboratories Pvt Ltd India “Black boxes show respective test results
aOC, organic carbon (oxidizable organic carbon) (Kgha−1): L: low (0.1–0.3); ML: medium low (0.30–0.50); M: medium (0.505–0.750); MH: medium high (0.750–1.00); H: high (1.00–1.50)
bAPH, available phosphate as P2O5 (Kgha−1): B: blank; L: low (<22); M: medium (22–56); MH: medium high (56–73); H: high (<73)
cAPT, available potassium as K2O (Kgha−1): L: low (>112); M: medium (112–280); H: high (280–392); VH: very high (<393)
dAN, ammoniacal nitrogen (Kgha−1): L: low (about 15); M: medium (about 73); H: high (about 202)
eNN, nitrate nitrogen (Kgha−1): VL: very low (about 04); L: low (about 10); M: medium (about 20); H: high (about 50)
Most of the treatments gave higher amount of available phosphorous (MH: 56–73 Kgha−1) in comparison to control (M: 22–56 Kgha−1), but no significant difference for available potassium among different treatments in comparison to control was observed except for NC + PS2 + SS and NC + PS10 + USS where a shift from low (L: >112) to medium (M: 112–280 Kgha−1). Medium (=73 Kgha−1) level of ammoniacal nitrogen was deduced in three treatments (NC + PS2 + SS, NC + PS2 + USS and NC + PS10 + SS) whereas rest of the treatments gave low (=15 Kgha−1) level of ammoniacal nitrogen. All treatments had low (L: 10 Kgha−1) or medium (M: 20) level of nitrate nitrogen than control, which was very low (VL: 04 Kgha−1). Similarly, Zhou et al. (2012) also studied the dynamic influence of three iron-based NPs (Fe0, Fe3O4, and Fe2O3) on soil physicochemical properties, such as pH, dissolved organic carbon (DOC), available ammoniacal nitrogen (AAN) and available phosphorous, and found that the addition of Fe0 NP increased DOC and AAN but significantly reduced AP, while Fe3O4, and Fe2O3 NP significantly reduced AAN. The soil nutrient status as per the observation was improved in the nanochitosan-treated soil which shows that the nanocompounds are good chelators for different micro as well as macronutrients, due to the slow release in soil for a longer period of time (Mukhopadhyay 2014).
Soil enzymes’ activities
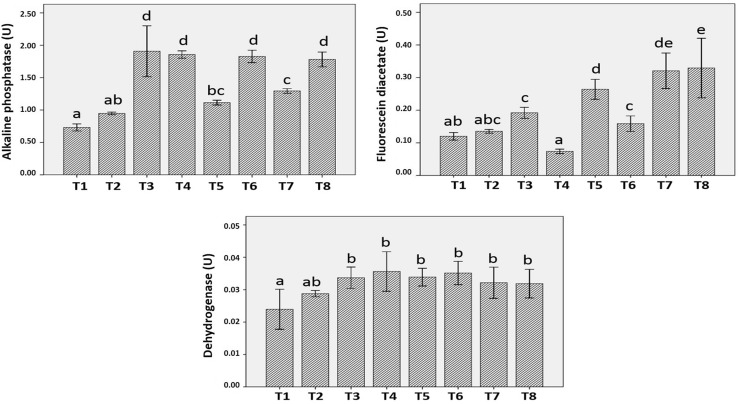
According to Glenn (1976), most of the extracellular enzymes secreted by soil microbes are alkaline phosphatase, ribonucleases, proteases, α-amylases, cellulases, lipases, several antibiotics and lytic factors, which are responsible for maintenance of soil health. The group of enzymes selected in the present study fulfills the requirement of a perfect indicator of soil health, as they are involved in the mineralization of C, H, N, P, and K in soil. Dehydrogenases belong to oxidoreductase group and oxidize organic matter by transferring protons and electrons from substrate to acceptor and as a part of respiration of soil microorganisms they are closely related to type and air–water relationship of soil (Kandeler 1996). Enzyme activity values are statistically calculated and represented in Table 4. Dehydrogenase activity was highest in NC + PS10 + USS (0.036U) followed by other treatments and least in AC + SS (0.024U) and AC + USS (0.029U) (Fig. 6).
Table 4.
Enzyme activity values with standard deviation
| Treatment | Description | Enzyme unit (mean ± SD, LSD at 5%, n = 3) | ||
|---|---|---|---|---|
| Dehydrogenase | Fluorescein diacetate | Alkaline phosphatase | ||
| T1 | NC + PS2 + SS | 0.034 ± 0.003b | 0.26 ± 0.027d | 1.11 ± 0.032bc |
| T2 | NC + PS2 + USS | 0.036 ± 0.003b | 0.15 ± 0.02bc | 1.82 ± 0.083d |
| T3 | NC + PS10 + SS | 0.034 ± 0.002b | 0.19 ± 0.001c | 1.90 ± 0.34d |
| T4 | NC + PS10 + USS | 0.036 ± 0.005b | 0.07 ± 0.005a | 1.85 ± 0.048d |
| T5 | NC + SS | 0.032 ± 0.004b | 0.32 ± 0.04de | 1.30 ± 0.031c |
| T6 | NC + USS | 0.032 ± 0.004b | 0.33 ± 0.07e | 1.79 ± 0.099d |
| T7 | AC + SS | 0.024 ± 0.005a | 0.12 ± 0.01ab | 0.73 ± 0.047a |
| T8 | AC + USS | 0.029 ± 0.0008ab | 0.13 ± 0.005abc | 0.94 ± 0.017ab |
Values within a column followed by single letters (a, b, c, d) show significant varietal difference by Duncan’s test and least significant difference (LSD) at 5% level
SD standard deviation, LSD least significant difference, n number of reading
Fig. 6.
Enzyme activities in different treatments, T1 AC + SS, T2 AC + USS, T3 NC + PS10 + SS, T4 NC + PS10 + USS, T5 NC + PS2 + SS, T6 NC + PS2 + USS, T7 NC + SS, and T8 NC + SS. Mean values with standard deviation bars, n = 3
FDA [3′6′-diacetylfluorescein] can also be used as a measure of microbial activity in soils, which is hydrolyzed by a number of enzymes like protease, lipase and esterase. About threefold increase in FDA hydrolysis activity was observed in NC + USS (0.33U) with respect to control (AC + SS: 0.12U and AC + USS: 0.13 U) and decrease in FDA activity was observed in NC + PS10 + USS (0.07U) (Fig. 4).
Statistically enhanced alkaline phosphatase activity (two to threefold) was found in all the treatments in comparison to control. Increase in alkaline phosphatase activity suggests greater quantity of available substrates in the soil treated with nanochitosan (Fig. 4). Vinhal-Freitas et al. (2010) also related increase in enzyme activity to increase in microbial biomass which again suggests that the soil enzymes are indirect indicators of soil microorganisms, and hence nanochitosan application supports the microbial activity and soil health.
Conclusion
The study supports the application of nanochitosan at optimal concentrations as it enhanced several plant health indicators including plant height, leaf area and number of leaves. GC–MS chromatography for the analysis of metabolites also revealed increased concentration of organic acids which are regulators of stress tolerance mechanisms. Soil health assessment is equally necessary to check any possible side effect of nanocompounds on soil, which is a crucial component of agriculture system. Soil health assessment of different treatments also supported the beneficial effects of nanochitosan applications on agriculture fields. The findings are novel as it presents a different approach towards sustainable agriculture system development.
Electronic supplementary material
Below is the link to the electronic supplementary material.
Acknowledgements
The author acknowledges UGC India for the funding support in form of JRF and SRF and Dept. of Microbiology for providing research facilities.
Abbreviations
- NC
Nanochitosan
- SS
Sterilized soil
- USS
Unsterilized soil
Compliance with ethical standards
Conflict of interest
The authors declare no conflict of interest for this manuscript.
Footnotes
Electronic supplementary material
The online version of this article (doi:10.1007/s13205-017-0668-y) contains supplementary material, which is available to authorized users.
Contributor Information
Priyanka Khati, Email: Priyankakhati712@gmail.com.
Pankaj Bhatt, Email: pankajbhatt.bhatt472@gmail.com.
References
- Aminiyan MM, Sinegani AAS, Sheklabadi M. Aggregation stability and organic carbon fraction in a soil amended with some plant residues, nanozeolite, and natural zeolite. Int J Recycl Org Waste Agric. 2015;4(1):11–22. doi: 10.1007/s40093-014-0080-0. [DOI] [Google Scholar]
- Arnon DI. Copper enzymes in isolated chloroplasts. Polyphenol oxidase in Beta vulgaris. Plant Physiol. 1949;24:1–15. doi: 10.1104/pp.24.1.1. [DOI] [PMC free article] [PubMed] [Google Scholar]
- Casida L, Klein D, Santoro T. Soil dehydrogenase activity. Soil Sci. 1964;98:371–376. doi: 10.1097/00010694-196412000-00004. [DOI] [Google Scholar]
- Glenn AR. Production of extracellular proteins by bacteria. Annu Rev Microbiol. 1976;30:41–62. doi: 10.1146/annurev.mi.30.100176.000353. [DOI] [PubMed] [Google Scholar]
- Gonzalez P, Neilson RP, Lenihan JM, Drapek RJ. Global patterns in the vulnerability of ecosystems to vegetation shifts due to climate change. Glob Ecol Biogeogr. 2010;10:1–14. [Google Scholar]
- Goto M, Ehara H, Karita S, Takabe K, Ogawa N, Yamada Y, Ogawa S, Yahaya MS, Morita O. Protective effect of silicon on phenolic biosynthesis and ultraviolet spectral stress in rice crop. Plant Sci. 2003;164:349–356. doi: 10.1016/S0168-9452(02)00419-3. [DOI] [Google Scholar]
- Kandeler E. Nitrate. In: Schinner F, Öhlinger R, Kandeler E, Margesin R, editors. Methods in soil biology. Berlin: Springer; 1996. pp. 408–410. [Google Scholar]
- Kloepper JW, Schroth MN, Miller TD. Effect of rhizosphere colonization by Plant Growth promoting rhizobacteria on Potato Plant development and Yield. Phytopathology. 1980;70:1078–1082. doi: 10.1094/Phyto-70-1078. [DOI] [Google Scholar]
- Li B, Liu B, Su T, Fang Y, Xie G, Wang G, Wang Y, Sun G. Effect of chitosan solution on the inhibition of Pseudomonas fluorescens causing bacterial head root of broccoli. Plant Pathol J. 2010;26:189–193. doi: 10.5423/PPJ.2010.26.2.189. [DOI] [Google Scholar]
- Lu CM, Zhang CY, Wen JQ, Wu GR, Tao MX. Research of the effect of nanometer materials on germination and growth enhancement of Glycine max and its mechanism. Soybean Sci. 2002;21:168–172. [Google Scholar]
- Maynard AD, Aitken RJ, Butz T, Colvin V, Donaldson K, Oberdörster G, Philbert MA, Ryan J, Seaton A, Stone V, Tinkle SS, Walker L, Warheit NJ, Warheit DB. Safe handling of nanotechnology. Nature. 2006;444:267–269. doi: 10.1038/444267a. [DOI] [PubMed] [Google Scholar]
- Meng X, Yang L, Kennedy JF, Tian S. Effects of chitosan and oligochitosan on growth of two fungal pathogens and physiological properties in pear fruit. Carbohyd Polym. 2011;81:70–75. doi: 10.1016/j.carbpol.2010.01.057. [DOI] [Google Scholar]
- Mukhopadhyay SS. Nanotechnology in agriculture: prospects and constraints. Nanotechnol Sci Appl. 2014;7:63–71. doi: 10.2147/NSA.S39409. [DOI] [PMC free article] [PubMed] [Google Scholar]
- Namasivayam SKR, Chitrakala K. Ecotoxicological effect of Lecanicillium lecanii (Ascomycota: Hypocreales) based silver nanoparticles on growth parameters of economically important plants. J Biopestic. 2011;4(1):97–101. [Google Scholar]
- Nel A, Xia T, Mädler L, Li N. Toxic potential of materials at the nano level. Science. 2006;311(5761):622–627. doi: 10.1126/science.1114397. [DOI] [PubMed] [Google Scholar]
- Purvis AC. Sequence of chloroplast degreening in calamondin fruit as influenced by ethylene and AgNO3. Plant Physiol. 1980;66:624–627. doi: 10.1104/pp.66.4.624. [DOI] [PMC free article] [PubMed] [Google Scholar]
- Schnurer J, Rosswall T. Fluorescein diacetate hydrolysis as a measure of total microbial activity in soil and litter. Appl Environ Microbiol. 1982;6:1256–1261. doi: 10.1128/aem.43.6.1256-1261.1982. [DOI] [PMC free article] [PubMed] [Google Scholar]
- Seif SM, Sorooshzadeh AH, Rezazadeh S, Naghdibadi HA. Effect of nano silver and silver nitrate on seed yield of borage. J Med Plant Res. 2011;5(2):171–175. [Google Scholar]
- Shukla SK, Mishra AK, Arotiba OA, Mamba BB. Chitosan-based nanomaterials: a state of the art review. Int J Biol Macromol. 2013 doi: 10.1016/j.ijbiomac.2013.04.043. [DOI] [PubMed] [Google Scholar]
- Stepanova AN, Yun J, Likhacheva AV, Alonso JM. Multilevel interactions between ethylene and auxin in Arabidopsis roots. Plant Cell. 2007;19:2169–2185. doi: 10.1105/tpc.107.052068. [DOI] [PMC free article] [PubMed] [Google Scholar]
- Tabatabai MA, Bremner JM. Use of p-nitrophenylphosphate for assay of soil phosphatase activity. Soil Biol Biochem. 1969;1:301–307. doi: 10.1016/0038-0717(69)90012-1. [DOI] [Google Scholar]
- Urbonaviciute A, Samuoliene G, Sakalauskaite J, Duchovskis P, Brazaityte A, Siksnianiene JB, Ulinskaite R, Sabajeviene G, Baranauskis K. The effect of elevated CO2 concentrations on leaf carbohydrate, chlorophyll contents and photosynthesis in radish. Pol J Environ Stud. 2006;15:921–925. [Google Scholar]
- Vinhal-Freitas IC, Wangen DRB, Ferreira AS, Corrêa GF, Wendling B. Microbial and enzymatic activity in soil after organic composting. Revista Brasileira de Ciência do Solo. 2010;34:757–764. doi: 10.1590/S0100-06832010000300017. [DOI] [Google Scholar]
- Yoshida S, Forno DA, Cock JH (1972) Laboratory Manual for Physiological studies of rice. International Rice Research Institute. 2nd Ed
- Zheng L, Hong F, Lu S, Liu C. Effect of nano-TiO2 on strength of naturally aged seeds and growth of spinach. Biol Trace Elem Res. 2005;104:83–91. doi: 10.1385/BTER:104:1:083. [DOI] [PubMed] [Google Scholar]
- Zhou DM, Jin SY, Wang YJ, Wang P, Weng NY, Wang Y. Assessing the impact of iron-based nanoparticles on pH. Dissolved Org Carbon Nutr Availab Soils Soil Sediment Contam Int J. 2012;21(1):101–114. doi: 10.1080/15320383.2012.636778. [DOI] [Google Scholar]
Associated Data
This section collects any data citations, data availability statements, or supplementary materials included in this article.


