

Abstract
Resequencing a number of individuals of various breeds as reference population and imputing the whole-genome sequences of individuals that were genotyped with medium-density chips to perform an association study is a very efficient strategy. Previously, we performed a genome-wide association study (GWAS) of lumbar number using 60K SNPs from the porcine Illumina chips in 418 Sutai pigs and did not detect any significant signals. Therefore, we imputed the whole-genome sequences of 418 Sutai individuals from 403 deeply resequenced reference individuals and performed association tests. We identified a quantitative trait locus (QTL) for lumbar number in SSC1 with a P value of 9.01E-18 that was close to the potential causative gene of NR6A1. The result of conditioning on the top SNP association test indicated that only one QTL was responsible for this trait in SSC1. The linkage disequilibrium (LD) drop test result for the condition of the reported potential causative mutation (c.575T > C missense mutation of NR6A1) indicated that this mutation was probably not the underlying mutation that affected lumbar number in our study. As the first trial of imputed whole-genome sequence GWAS in swine, this approach can be also powerful to investigate complex traits in pig like in human and cattle.
Introduction
Pigs were first domesticated from wild boars (Sus scrofa) approximately 10,000 years ago1. Thus, a large number of traits have changed dramatically, including more docile behavior, larger litter size and increased carcass length. The number of vertebrae associated with carcass length varies among breeds. Compared to the wild boar, European commercial pigs have 2–4 more vertebrae2. Because of its importance, this trait has received considerable attention. A quantitative trait locus (QTL) on chromosome 1 that affects the carcass in swine was identified in 1998 using a Meishan × White reciprocal backcross population3. In addition, a QTL significantly affecting vertebral number that is located extremely close to the QTL affecting carcass length on SSC1 was discovered in the Meishan × Gottingen cross population4. Furthermore, two additive quantitative trait loci (QTLs) on chromosome 1 and chromosome 7 were identified for the number of vertebrae using nine F2 families, including European breeds, Asian breeds, and miniature pigs5. Subsequently, to further investigate these two QTLs, fine mapping was carried out and the NR6A1 gene was found to be a potential gene controlling the number of lumbar vertebrate; later, the c.575T > C missense mutation of this gene was suggested to be the potential mutation affecting the number of lumbar6. However, the QTL located on SSC1 was not detected in the Sutai population.
With the rapid development of SNP genotyping technology, genome-wide association studies (GWASs) have become a very effective and widely used approach to identify genetic variants associated with complex diseases or traits across the entire genome7. Using this strategy, several SNPs and QTLs and some quantitative trait genes (QTGs) were recently uncovered for economically important traits in pig breeds8–11. However, the power of GWASs is limited by the current density of SNP chips. The average density of the porcine SNP chips is much lower than the linkage disequilibrium (LD) block of most native breeds12, and as a result, several QTLs are missing from GWASs based on Illumina 60K porcine SNP chips. To improve the reliability and accuracy of GWASs, the use of high-density SNPs or even whole-genome sequence data to reperform the GWAS based on low-density SNPs is needed to identify missing QTLs. With the rapidly decreasing costs of next-generation sequence technology and the increasing accuracy of sequencing, numerous researchers have employed sequencing or resequencing to understand the demography, diversity and selection sweep of the investigated animals13–15. However, resequencing thousands of individuals and then determining associations for economically important traits is still an inefficient strategy. A more efficient approach is to impute the whole-genome sequence genotypes of individuals genotyped with medium-density chips using a previously sequenced reference population, and then determine associations between imputed genotypes and traits of interest using well-developed GWAS software. This approach is very popular for human disease studies, such as HapMap16 and the 1000 Genomes Project17, which provided standard reference panels. This approach has also worked very well in cattle, such as the 1000 bull genomes project (Run 2.0)18, 19. To the best of our knowledge, there are still no GWASs using whole-genome resequenced data in pigs.
Previously, we performed a GWAS using 60K porcine Illumina chips in Sutai pigs to detect the association loci for lumbar number. We expected to identify significant loci for this trait in Sutai pigs because this breed originated from Duroc and Erhualian pigs, which have similar paternal and maternal structures of an advanced intercross resource family20. Unexpectedly, no association signals were identified in Sutai pigs for lumbar number, which was different from the results of most published QTL mapping studies. Therefore, we hypothesized that the non-significant result may have arisen because of the low LD between causal mutation and nearby SNPs. To increase the detection power and decrease the cost of the GWAS, we first imputed the genotypes of 60K chips to the genotypes of whole-genome sequence variants in Sutai pigs using a reference panel containing 403 deep-sequenced individuals. Then, we used the imputed genotypes to reperform GWAS for the same phenotypes with the objective of determining whether there was a genetic variation in NR6A1 associated with lumbar number in this breed. As noted above, the c.575T > C missense mutation of NR6A1 was the strongest potential candidate for lumbar number. However, the causality of this SNP in Sutai pigs was unknown. In this study, we genotyped this mutation to estimate the imputation accuracy and its causality in Sutai pigs.
Methods
Ethics statement
All the experiments that involved animals were performed in accordance with the guidelines approved by the Ministry of Agriculture of China. Approval was obtained from the ethics committee of Jiangxi Agricultural University before this study.
Animals of the target population
The target population of Sutai pig is a synthesized swine breed produced by crossing the Western Duroc and Chinese Erhualian breeds with continued selection for 19 generations. For the present study, we genotyped and phenotyped 526 individuals. The pigs were raised with the same fodder under uniform circumstances and slaughtered at 240 days of age in a commercial slaughterhouse. After the harvest, the carcasses were cut into halves and the numbers of lumbar vertebrae were counted and recorded. The lumbar number was either 5 or 6 in 436 pigs, including 206 gilts and 230 barrows, and the lumbar number was not available for 90 animals. More detailed information on the pigs’ environment and other phenotype data for these experimental animals were provided in our previous study21.
Genomic DNA samples were extracted from ear tissue using the standard phenol/chloroform method22, and the samples were diluted to a standardized concentration of 50 ng/µl after the quality was checked. A total of 526 samples were genotyped using Illumina PorcineSNP60 Beadchips, including 62,163 SNPs, on an iScan System (Illumina, San Diego, CA, USA)23. Quality control (QC) was conducted using PLINK (v1.90 beta) to detect and exclude unreliable genotypes24. SNPs with a missing rate of each marker (geno) >0.1 or with minor allele frequency (MAF) <0.05 were excluded. Individuals with a call rate <0.9 were also removed. To maintain consistency with the sequencing data, the primer sequences of each SNP were aligned to the reference porcine genome assembly Sus-scrofa 10.2 using BLAST to detect their positions and forward (reverse) strand information. SNPs without positions were excluded, and the genotypes of reversed SNP strands were flipped using PLINK software.
Haplotype construction of the reference panel
In this study, a wide collection of 403 whole-genome sequence data from 10 different pig populations15, 25–27 was used as a reference and each breed contained 9 to 86 pigs. More details on the breeds, origins and sample size are listed in Table 1. The sequencing coverage of these individuals ranged from 5 to 25. The raw reads were cleaned based on a quality score threshold >15, which passed chastity filtering and would be then aligned to the reference porcine genome assembly Sus-scrofa 10.2 using BWA (Burrows-Wheeler Aligner)28. Variants were identified following the GATK (Genome Analysis Toolkit)29 best practice protocol. PCR duplications were first marked by Picard MarkDuplicates (http://broadinstitute.github.io/picard/), and local realignments were performed with GATK IndelRealigner. Individual GVCF files were produced using GATK Haplotypecaller. Variants were called and filtered with GATK Genotype GVCFs and VariantFiltration options. Structural variants were removed with VCFTOOLS30. With cleaned SNP data, the haplotypes of 403 individuals were constructed using Beagle (v4.1)31.
Table 1.
The components of the reference panel.
| Breeds | Sample Size | Coverage | Data Origin |
|---|---|---|---|
| Duroc | 32 | ~25, 8 | JXAU*, WAU26, Korea27 |
| Erhualian | 29 | 25 | JXAU15 ,* |
| Large White | 86 | 25, 8 | JXAU*, WAU26, Korea27 |
| Western Commercial | 36 | 25, 8 | JXAU*, WAU26, Korea27 |
| CNH_Y | 9 | 25, 8 | JXAU15, WAU26 |
| Wild Boar | 34 | 25, 8, 5 | JXAU15, WAU26, SCAU25 |
| CNNorth | 24 | 25 | JXAU15 ,* |
| CNSouth | 24 | 25 | JXAU15 ,* |
| Tibetan | 85 | 25, 5 | JXAU15 ,*, SCAU25 |
| CNElse | 44 | ~25 | JXAU15, WAU26, SCAU25 |
Breed and origin abbreviations:
CNH_Y: China Huai River and Yangtze River area pig; CNNorth: China North pigs; CNSouth: China South pigs; CNElse: China local pigs from other places.
JXAU: Jiangxi Agricultural University; WAU: Wageningen University; SCAU: Sichuan Agricultural University; Korea: Korea University.
*These part of data were sequenced by our laboratory and accessible under readers’ requirement.
Imputation
Imputation from 60K SNPs to whole-genome sequences for Sutai pigs was conducted with Beagle (v4.1)32 using the default parameter settings, and the size of each sliding window was set to 7,000,000 bp. This software is based on a hidden Markov Chain Monte Carlo algorithm for imputation that first constructed local haplotypes using the MCMC algorithm and then resampled new estimated haplotypes for each individual using the HMM model.
Because of the very low density and common variants (MAF > 0.05) in 60K (Illumina, San Diego, CA, USA), imputation accuracy should be investigated in whole-genome sequence data. We used a 15-fold cross-validation strategy described in several previous studies33–35. Ninety individuals were selected randomly from the sequenced reference population as a target population for each fold (i.e. there would be some same individuals sampled in different target populations), and the genotypes in this target population were reduced to the variants that were included in the 60K genotyping array. The remaining individuals (313) were included in the reference panel. Two validation actions were taken to calculate the accuracy of imputation. One action was allelic correct rate (CR), which calculated as the number of alleles imputed correctly divided by total alleles at each locus, and the more detailed formula (see equation (1)) was as follows:
| 1 |
where m and N are the number of individuals and SNPs, respectively, and Obs (nij) and Imp (nij) are the observed and imputed numbers of allele “1” for individuals i at marker j, respectively. The other action was the correlation coefficient between true and imputed SNPs. To investigate the imputation accuracy impacted by MAF, we classified CR and correlation into 10 classes with regard to the MAF of imputed SNPs. The accuracy of imputation was the mean CR or correlation across 15 folds for each class.
GWAS analysis
The associations between lumbar number and imputed genotypes were tested using GEMMA (v.0.93)36. This method implements a mixed model37 (see equation (2)) including covariates when we carried out conditional association test and LD drop association test, SNP effects, individual effects and residual error, which were calculated with the following formula:
| 2 |
where y is the vector of phenotypes; W is a matrix of covariates, including a column of 1s; α is a vector of the corresponding coefficients, including the intercept; x is a vector of genotypes; β is the effect of markers; u is a vector random effect following the multivariate normal distribution (see equation (2)), in which τ −1 is the variance of the residual errors, λ is the ratio between τ −1 and ε, and K is a kinship matrix that is estimated from whole-genome sequence variants; ε is a vector of errors following the multivariate normal distribution (see equation (2)) and I n is an identity matrix. Using naïve Bonferroni corrections of 0.05 divided by the number of examined SNPs would lead to an overly conservative threshold because these SNPs were highly correlated with each other. Pe’er et al. and Johnson et al. suggested that 5E-08 could serve as a genome-wide significant threshold in human GWASs based on haplotype blocks of an African population structure38, 39. Based on the assumption that an equal number of independent haplotype segments between pigs and humans are held, we used the same genome-wide threshold in our study. The model for the GWAS of Sutai pigs with 60K genotypes was the same as that used for whole-sequence association tests and the kinship matrix was estimated either from 60K SNPs (original SNP-data) or whole-genome sequence variants. To make the results comparable, the values of the 60K marker from the results of the whole-sequence association study were extracted for comparison.
LD analysis
To detect the linkage disequilibrium (LD) of SNPs near the most significant SNPs in the GWAS results, the 3 Mb region near the top SNPs in the whole-sequence association results was used to conduct LD analysis by extracting genotypes from the 60K data set using Haploview (v.4.2) software40. Haplotype blocks were then estimated with a confidence intervals algorithm in Haploview.
Genotyping of c.575T > C locus
Variation of the c.575T > C (rs326780270) of NR6A1 in Sutai pigs was detected following the methods of Yang et al.41. Briefly, a 360 bp segment was amplified and cut into two pieces of 183 and 177 bp for allele C at the position of 299,084,752 bp on SSC1. Genotypes of this locus were then identified through agarose gel electrophoresis.
Conditional association test
To elucidate whether there are additional QTLs for lumbar number on SSC1, we performed a conditional test by including the genotypes of the top SNPs as a covariance to the mixed model and retested the association between SNPs and phenotypes. If no additional signal was detected, then there was only one QTL that affected lumbar number. Otherwise, there were multiple QTLs that cooperated to control lumbar number.
LD drop association test
To determine whether NR6A1 c.575T > C was the mutation that determined lumbar number in Sutai pigs, we performed an LD drop test by including the genotypes of NR6A1 c.575T > C in the mixed model framework to determine how rapidly the association with the signal decreased.
Results
SNP characteristics after QC in the target panel
After QC, 11,338 variants were excluded for the lack of chromosome position information, 42 pigs were removed due to a low genotype call rate, 3,229 variants were removed due to a low call rate and 9,804 variants were excluded for low minor allele threshold(s). Finally, a total of 37,792 SNPs and 484 pigs were introduced to perform further analyses.
Summary of imputation
Imputation was produced using Beagle software. The summarization of imputation results is presented in Table 2. After imputation, we obtained 87,552,595 SNPs for 484 individuals, and 20,985,704 SNPs were kept after filtering with MAF > 0.01. SSC1 was selected for 15-fold cross-validation to calculate the imputation accuracy tested by CR and correlation related to MAF. The correct rate decreased when MAF increased. In contrast, the correlation increased along with the increase of MAF (Fig. 1). The average CR was 0.90 with maximum and minimum values varying from 0.98 to 0.86 across MAF. The average correlation was 0.80 with maximum and minimum values ranging from 0.86 to 0.74.
Table 2.
The distribution of SNPs in different chromosomes.
| Chr | Before QC (SNP/NIND) | After QC (SNP/NIND) |
|---|---|---|
| Chr 1 | 9,369,975/484 | 1,930,649/418 |
| Chr 2 | 5,734,943/484 | 1,430,107/418 |
| Chr 3 | 4,910,467/484 | 1,242,704/418 |
| Chr 4 | 4,774,170/484 | 1,139,870/418 |
| Chr 5 | 3,816,805/484 | 961,177/418 |
| Chr 6 | 5,216,961/484 | 1,264,513/418 |
| Chr 7 | 4,663,028/484 | 1,153,610/418 |
| Chr 8 | 5,035,221/484 | 1,185,766/418 |
| Chr 9 | 5,392,245/484 | 1,344,280/418 |
| Chr 10 | 3,405,060/484 | 1,028,000/418 |
| Chr 11 | 3,347,457/484 | 853,465/418 |
| Chr 12 | 2,406,736/484 | 660,770/418 |
| Chr 13 | 7,186,391/484 | 1,442,485/418 |
| Chr 14 | 5,407,899/484 | 1,282,555/418 |
| Chr 15 | 4,998,888/484 | 1,105,999/418 |
| Chr 16 | 3,266,711/484 | 815,314/418 |
| Chr 17 | 2,608,589/484 | 686,832/418 |
| Chr 18 | 2,373,396/484 | 602,229/418 |
| Chr 19 | 3,637,653/484 | 855,379/418 |
| Whole genome | 87,552,595/484 | 20,985,704/418 |
Chr: chromosome number; QC: quality control. the QC condition was MAF > 0.01 and 66 individuals were removed for the case of without phenotypes.
Figure 1.
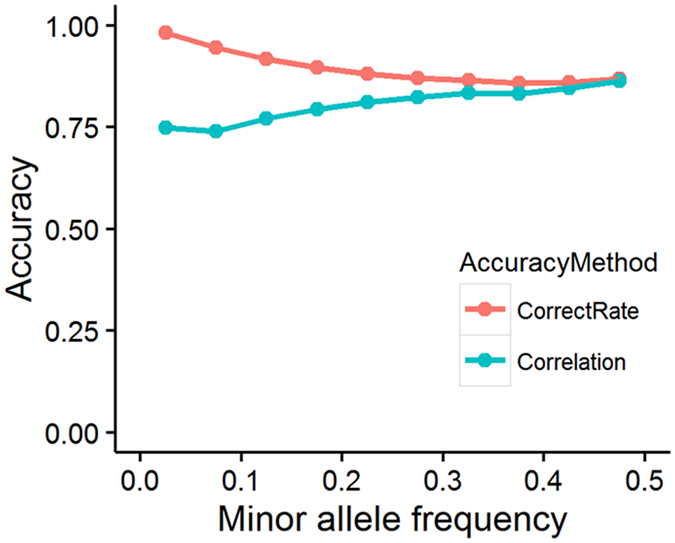
Evaluation of imputation accuracy MAF. The x-axis is the MAF range from 0 to 0.5, and the y-axis is imputation accuracy denoted by the correct rate (CR) and correlation. The pink line shows the CR, which was calculated as the number of alleles imputed correctly divided by the total alleles at each locus across MAF. The blue line shows the correlation between true and imputed genotypes at each locus across MAF.
Summary of GWAS
We conducted a GWAS on the Sutai population in two scenarios, i.e., the target panel data before and after imputation. In the scenario for before imputation, as noted above, no significant loci were detected in Sutai pigs using 60K chips (Fig. 2a, which contains the 60K original data), and P values positioned on the 60K original data were extracted from sequencing GWAS (which included the 60K imputed data). To further compare array based result to sequences based result underlying the same kinship matrix, we extracted P values positioned on the 60K chips from result of sequencing GWAS. The Manhattan plots of the 60K imputed data results are shown as Supplementary Fig. S1. Both results confirmed that no significant QTLs were located on SSC1 when only 60K SNPs were used. The association P values of the top SNP in the 60K imputed data and the 60K original data were 1.27E-06 and 2.99E-06, and the position of the top SNP in both results was 298972575 (rs81352477) in chromosome 1. In the scenario with the sequence data, 105 genome-wide significant SNPs were uncovered (Table 3, Fig. 2b) on SSC1 within a 4.6 Mb region (298,912,325 bp-303,530,285 bp). Furthermore, the proposed causal gene, NR6A1, for lumbar number6 was located in this region. However, the P value of the proposed causal mutation c.575T > C was only 2.26E-06 at the position of 299,084,752 bp (imputation accuracy, r2 = 0.95), which indicated much lower significance than the top SNP (P value = 9.01E-18) at a position of 299,627,873 bp.
Figure 2.
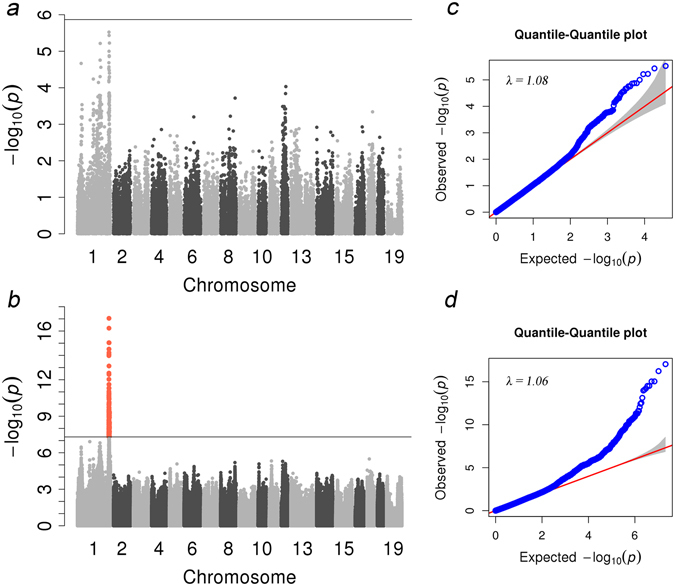
GWAS results for lumbar number trait. (a,b) Manhattan plots for lumbar number with the data before imputation (a) and after imputation (b). (c,d) c and d are the quantile-quantile plots. In the Manhattan plots, the y-axis and x-axis represent the negative log10 P value of the SNPs and the genomic positions separated by chromosomes, respectively. In Manhattan plot a, black solid lines indicate the 5% genome-wide Bonferroni-corrected threshold. In Manhattan plot b, the tomato puree points represent SNPs that exceeded the chromosome-wide significance threshold (−log10(5E-08)), and the black solid lines indicate the significance threshold. In quantile-quantile plots c and d, the y-axis and x-axis represent the expected and observed negative log10 P values, respectively.
Table 3.
Description of the most significant 20 SNPs associated with lumbar number by GWAS.
| Chr | rs | ps | n_miss | beta | se | l_remle | l_mle | p_wald |
|---|---|---|---|---|---|---|---|---|
| Chr 1 | rs334252332 | 299,627,873 | 0 | 3.02E-01 | 3.35E-02 | 1.00E-05 | 1.00E-05 | 9.01E-18 |
| Chr 1 | rs331286845 | 299,560,236 | 0 | 3.12E-01 | 3.56E-02 | 6.58E-04 | 1.00E-05 | 5.84E-17 |
| Chr 1 | rs344688372 | 299,031,889 | 0 | 2.92E-01 | 3.48E-02 | 6.41E-02 | 1.46E-02 | 9.09E-16 |
| Chr 1 | rs333213419 | 300,706,429 | 0 | 3.01E-01 | 3.59E-02 | 9.87E-03 | 1.00E-05 | 9.22E-16 |
| Chr 1 | rs336248841 | 299,463,071 | 0 | 2.76E-01 | 3.36E-02 | 1.00E-05 | 1.00E-05 | 3.06E-15 |
| Chr 1 | rsxxxxxxxx1 | 299,590,806 | 0 | 3.01E-01 | 3.66E-02 | 1.00E-05 | 1.00E-05 | 3.06E-15 |
| Chr 1 | rs341631790 | 299,554,614 | 0 | 3.03E-01 | 3.74E-02 | 4.42E-02 | 1.00E-05 | 6.01E-15 |
| Chr 1 | rs320822074 | 299,569,286 | 0 | 2.98E-01 | 3.69E-02 | 1.91E-02 | 1.00E-05 | 8.34E-15 |
| Chr 1 | rs326834750 | 299,031,654 | 0 | 2.77E-01 | 3.45E-02 | 4.60E-02 | 1.00E-05 | 1.06E-14 |
| Chr 1 | rs334124688 | 299,663,720 | 0 | 2.91E-01 | 3.74E-02 | 7.20E-02 | 3.82E-04 | 7.46E-14 |
| Chr 1 | rs327909125 | 299,031,891 | 0 | 2.79E-01 | 3.70E-02 | 2.02E-01 | 1.69E-01 | 2.86E-13 |
| Chr 1 | rs329239802 | 299,464,519 | 0 | 2.72E-01 | 3.62E-02 | 6.56E-02 | 1.00E-05 | 3.67E-13 |
| Chr 1 | rs320616940 | 298,988,212 | 0 | 2.65E-01 | 3.58E-02 | 1.18E-01 | 1.00E-05 | 9.25E-13 |
| Chr 1 | rs319146997 | 299,462,559 | 0 | 2.62E-01 | 3.62E-02 | 7.32E-02 | 1.18E-02 | 2.45E-12 |
| Chr 1 | rs331600883 | 299,462,537 | 0 | 2.62E-01 | 3.62E-02 | 7.32E-02 | 1.18E-02 | 2.45E-12 |
| Chr 1 | rs334129807 | 299,554,649 | 0 | 2.83E-01 | 3.96E-02 | 1.61E-01 | 1.29E-01 | 4.86E-12 |
| Chr 1 | rs324516984 | 299,741,083 | 0 | 2.85E-01 | 3.99E-02 | 1.56E-01 | 1.18E-01 | 4.89E-12 |
| Chr 1 | rsxxxxxxxx2 | 299,561,306 | 0 | 2.86E-01 | 4.01E-02 | 1.77E-01 | 1.45E-01 | 5.05E-12 |
| Chr 1 | rs323786500 | 299,562,197 | 0 | 2.86E-01 | 4.01E-02 | 1.77E-01 | 1.45E-01 | 5.05E-12 |
| Chr 1 | rs320840172 | 298,943,126 | 0 | 2.47E-01 | 3.51E-02 | 8.59E-02 | 1.00E-05 | 9.23e-12 |
Chr: chromosome number; rs: SNP IDs and two SNPs that do not possess rs ID were named after rsxxxxxxxx1 and rsxxxxxxxx2, respectively, by the author; ps: base pair positions on the chromosome; n_miss: number of missing values of the SNP; beta: beta estimates; se: standard errors for beta; l_remle: remle estimates for lambda; l_mle: mle estimates for lambda; p_wald: P value from the Wald test.
LD results
By carrying out GWAS with imputation data, we identified the most significant SNP at a position of 299,627,873 bp as well as a total of 31 markers that were extracted from the significant region (3 Mb) in the 60K data that were used to conduct LD analysis. The LD block was shown as follows (Fig. 3). Three blocks were detected on this region using a confidence interval algorithm. The most significant was the smallest block of approximately 212 kb, and the r2 among each SNP in this region was very low. The NR6A1 gene was not present in any block in this region.
Figure 3.
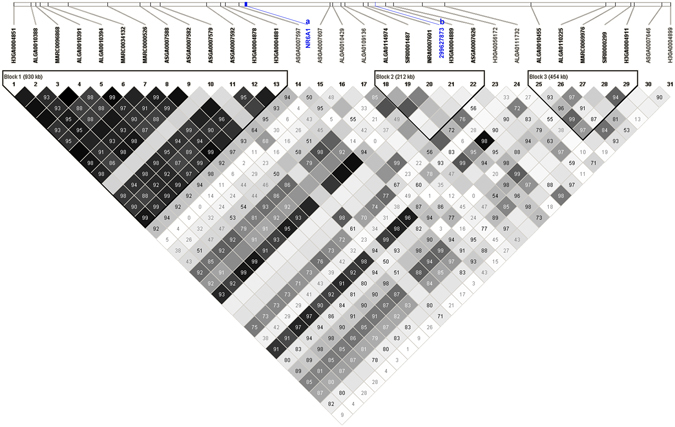
Haplotype block of a significant region (3 Mb) of SSC1 in Sutai pigs. The NR6A1 gene (a) did not fall into any block in this region, and the most significant position (b) was located at 299,627,873 bp in the 454 kb block 3.
Results of genotyping c.575T > C
Among the 526 samples, a total of 382 pigs were genotyped on the c.575T > C locus. Subsequently, we obtained 187 CC genotypes, 166 CT genotypes and 29 TT genotypes (see Supplementary Table S1). To further confirm imputation accuracy, we compared imputed genotypes to real genotyped genotypes on this locus and found that only 12 of 382 individuals had different genotypes. In other words, a very high allelic imputation accuracy (98.43%) was obtained at this locus.
Results of the conditional association test and LD drop association test
After GWAS was performed by including the most significant SNP from imputed GWAS results in a mixed model as a covariate, no additional genome-wide significant loci were detected on this chromosome, which indicated that only one major QTL affected lumbar number (Fig. 4a).
Figure 4.
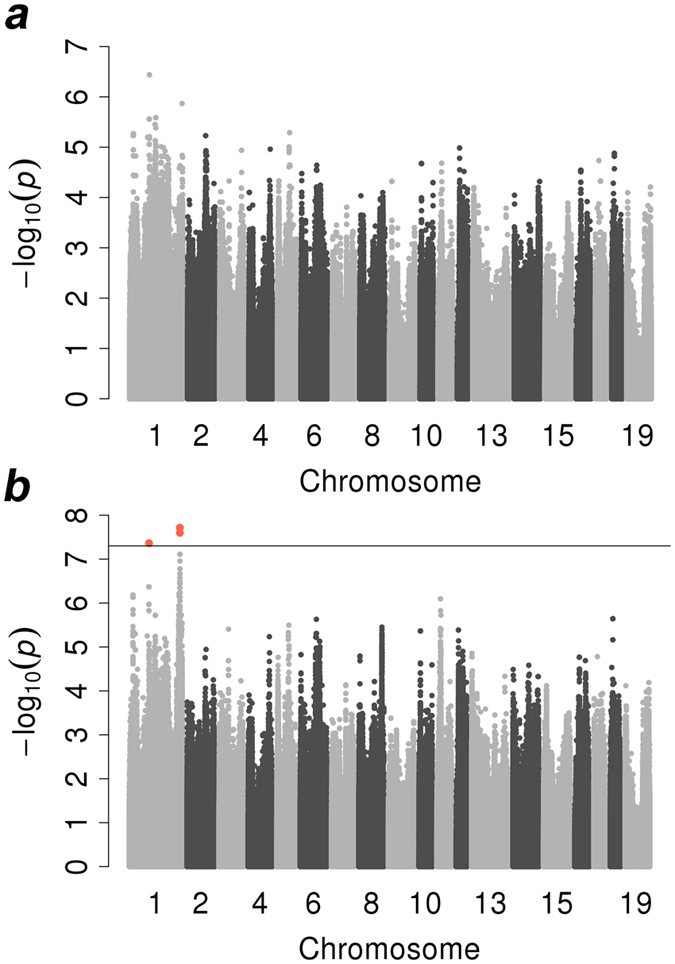
GWAS results for lumbar number in two scenarios: conditional test and LD drop test. (a,b) Manhattan plots for lumbar number in the conditional association test and LD drop association test, respectively. In the Manhattan plots, the y-axis and x-axis represent the negative log10 P values of the SNPs and the genomic positions separated by chromosomes, respectively. In Manhattan plots a and b, the black solid lines indicate the chromosome-wide significance threshold (−log10(5E-08)), and in (b), the tomato puree points represent SNPs that exceeded the chromosome-wide significance threshold.
After fitting genotypes of NR6A1 c.575T > C into the mixed model for the LD dropping test, we still identified a genome-wide significant locus near the top SNP at a position of 299,432,549 bp with a P value of 1.93E-08. This result probably indicated that locus NR6A1 c.575T > C was not the causative mutation in Sutai pigs for lumbar number (Fig. 4b).
Discussion
Imputation-based association studies have achieved great success in humans42–45 and some livestock, such as cattle46. Both have resequenced more than 1000 individuals of multiple populations as reference panels, and the unrelated targets were genotyped using middle- (high-) density SNP chips. Whole-genome sequences of the target panel were imputed based on shared haplotype blocks between reference and target individuals and then were used to test associations of complex disease (traits) or to predict the genetic potential of economically important traits. Imputation accuracy ranged from 0.90 to 0.95 in cattle from the genotypes of an Illumina BovineHD genotyping array to whole-genome sequence data35. High correlations (0.64) were observed in humans with MAF = 0.1% when imputing an Illumina 1M SNP array to whole-genome sequences using a reference panel of 64,976 haplotypes45. In our study, a total of 403 individuals were included on the reference panel, including 32 Duroc and 29 Erhualian pigs, which are ancestors of the Sutai population. CR decreased and correlation increased along with an increase in MAF. CRs are highly sensitive to allelic frequencies and are not appropriate for comparing SNPs with different values of MAF47. Correlation is a more popular approach that is used to evaluate imputation accuracy. The correlation values ranged from 0.74 to 0.86 with an average of 0.80, which was lower than the results for cattle and human studies. Both were imputed from high-density chips (600K in cattle and 1M in human) to sequenced data, and the reference panels were very large. In pigs, the vast majority of studies were based on genotypes from the 60K porcine Illumina BeadChip because a high-density panel (600,000 SNPs) that provides high-quality imputed genotypes in pig populations is currently impractical. Therefore, increasing the number of sequenced populations and individuals in the reference panel to improve imputation accuracy is necessary. Our GWAS results demonstrated that this was a powerful method to identify QTLs in agricultural animals, and this method will help researchers find new loci or rediscover QTLs associated with complex traits.
Since the first application of GWAS research on age-related macular degeneration was performed successfully in 2005 by Klein et al.48, GWAS has become an effective method for identifying genetic variations associated with economically important traits in agricultural animals. A recent GWAS study showed that the QTL for the number of vertebrae on chromosomes 1 and 7 independently influenced the numbers of thoracic and lumbar vertebrae49. Potentially significant signals could be missed in a GWAS analysis if low-density SNPs were applied to a population that held a low LD characteristic, such as the results of our GWAS when only 60K SNPs were used before imputation and a highly significant QTL was uncovered for lumbar number after imputation. The LD between top SNPs in the 60K original association results (rs81352477) and top SNPs (rs334252332) in the sequence association result was 0.75, indicating a medium correlation. The increased detection power was probably due to causal mutations being in the data by imputation. This result was further confirmed by displaying the LD profiles of markers near the top loci. The top SNP was located in the smallest haplotype block, and the r2 values among these SNPs in this region were very low, which hampered the discovery of association signals. Furthermore, no haplotype block was found near the NR6A1 gene, which implicated the low LD station in that region in the Sutai population. The Sutai breed was intercrossed from Erhualian female and Duroc male for approximately 19 generations. Thus, the Sutai genome is a mosaic mixture of these two breeds. As a result, the LD block is smaller than the LD block in either of the two founder breeds. In this study, we identified 105 significant SNPs located on chromosome 1 across a region of 4.6 Mb (298,912,325 bp–303,530,285 bp) associated with lumbar number, and the highest signal was located on 299,627,873 bp of chromosome 1. This region contains the NR6A1 gene, which was reported to be associated with lumbar number6. The results also showed that using whole-genome resequencing data to perform genotype imputation can be an effective method to identify the QTLs that were missed in low-density SNP GWAS analysis. The imputation method can also narrow the QTL region or improve the power when GWAS analysis is performed. To determine whether population stratification was corrected in this study, we exploited quantile-quantile plots (Fig. 2c and d) from the GWAS with 60K SNP data and imputed the sequenced data. The two quantile-quantile plots with lambda values of 1.08 and 1.06 showed that the population stratification effect was adjusted very well, and the detected signal was most likely reliable.
Although we identified the same QTL as that identified in a previous study4, the reported potential causative mutation at position of 299,084,752 bp (c.575T > C)6 showed only a weak association with lumbar number in our study (P value = 2.26E-06). The possible reason for this result is that the QTN in the position of 299,084,752 bp may not be the causative mutation in the Sutai population. To confirm that NR6A1 c.575T > C was the causative mutation in our population, we performed an LD drop test by fitting genotypes of this locus into a mixed model. Normally, all significant signals nearby would disappear after correcting for causative mutation. The minimum P value increased from 9.01E-18 to 1.93E-08, which still indicated genome-wide significance. This result indicated that NR6A1 c.575T > C was not the causative mutation in our study. The results also indicated that we should recognize that the accuracy of imputation also affects the GWAS result. Several imputation studies in different species have shown that as the minor allele frequency in the target panel decreased, the imputation error rate increased34, 50. As shown in previous studies, the fundamental aspect of imputation is the identical DNA segments in the target and reference panels, and increasing the number of parents or male parents in a reference panel can increase the imputation accuracy51–53. In other words, if we can increase the number of individuals in the target panel and reference panel, the imputation accuracy will be increased. Mixing different breeds in a reference panel would thus improve imputation accuracy54. In this study, we mixed different pig breeds in the reference panel and executed strict quality control, such as MAF and call rate, in the target and reference panels. We achieved a high CR with an average of 90% and real genotypes of c.575T > C, which confirmed the high imputation accuracy (98.43%). Therefore, this factor may not be very critical in this study, but we also should pay more attention to exploring the factors that affect the imputation results in the future. In addition, a reassociation study using real genotypes at c.575T > C achieved a P value of only 3.89E-07, which further indicates that it was not associated with lumbar number in the Sutai population. To determine whether there are several causative mutations responsible for lumbar number, we performed a conditional test by adjusting the top SNP on SSC1 and conducted GWAS again. Additional significant signals would stand out if the multiple causative mutation hypothesis was true. In our analysis, there were no other QTLs associated with lumbar number, which means there is only one QTL that controls lumbar number on SSC1, whereas the causative mutation is not the same as that previously reported. Further functional studies, such as gene expression and site-specific editing technology, are necessary to confirm the possibility of causality for the top SNP in the Sutai population.
In this study, we rediscovered the missing QTL for lumbar number in Sutai pigs using GWAS based on a whole-genome imputation strategy. This QTL includes the same potential causative gene, NR6A1, that was previously reported, while the top SNP differed from the previously reported potential causative mutation. This study illustrates the importance and effectiveness of uncovering the traits in agricultural animals using a whole-genome imputation approach and provides a solution that combines second-generation sequence data with GWAS. Our results also show that this approach can be a powerful strategy to analyze economically important complex traits in livestock. Along with developing good imputation software, exploiting more public database systems will contribute to genotype imputation in the future.
Electronic supplementary material
Acknowledgements
We gratefully acknowledge the support from National Natural Science Foundation of China (31640046), Innovation Fund Designated for Graduate Students of Jiangxi Province (YC2015-B027) and Science and Technology Support Program of Jiangxi Province (20143ACF6003). We are also grateful to all members who participated in this study from the State Key Laboratory for Swine Genetics, Breeding and Production Technology. Most of all, we appreciate Wageningen University, Sichuan Agricultural University and Korea University for making their data available in the public database system.
Author Contributions
L.H. and Z.Z. conceived and designed the experiments. G.Y., Z.Z. and R.Q. analyzed the major data and wrote the manuscript. L.H. revised the paper. F.Z. and W.X. analyzed part of the data and revised the draft. All authors read and approved the final manuscript.
Competing Interests
The authors declare that they have no competing interests.
Footnotes
Guorong Yan and Ruimin Qiao contributed equally to this work.
Electronic supplementary material
Supplementary information accompanies this paper at doi:10.1038/s41598-017-00729-0
Accession codes: The genome resequencing reads were downloaded from the NCBI sequence read archive (SRA) under the accession codes SRA06546125, SRA09609315, SRP04726027, and SRP05292727, and some sequences were downloaded from the European Nucleotide Archive (ENA) under accession code PRJEB992226.
Publisher's note: Springer Nature remains neutral with regard to jurisdictional claims in published maps and institutional affiliations.
References
- 1.Giuffra E, et al. The origin of the domestic pig: independent domestication and subsequent introgression. Genetics. 2000;154:1785–1791. doi: 10.1093/genetics/154.4.1785. [DOI] [PMC free article] [PubMed] [Google Scholar]
- 2.King JWB, Roberts RC. Carcass length in the bacon pig; its association with vertebrae numbers and prediction from radiographs of the young pig. Animal Production. 1960;2:59–65. doi: 10.1017/S0003356100033493. [DOI] [Google Scholar]
- 3.Rohrer GA, Keele JW. Identification of quantitative trait loci affecting carcass composition in swine: II. Muscling and wholesale product yield traits. J Anim Sci. 1998;76:2255–2262. doi: 10.2527/1998.7692255x. [DOI] [PubMed] [Google Scholar]
- 4.Wada Y, et al. Quantitative trait loci (QTL) analysis in a Meishan × Gottingen cross population. Anim Genet. 2000;31:376–384. doi: 10.1046/j.1365-2052.2000.00696.x. [DOI] [PubMed] [Google Scholar]
- 5.Mikawa S, et al. Two quantitative trait loci on Sus scrofa chromosomes 1 and 7 affecting the number of vertebrae. J Anim Sci. 2005;83:2247–2254. doi: 10.2527/2005.83102247x. [DOI] [PubMed] [Google Scholar]
- 6.Mikawa S, et al. Fine mapping of a swine quantitative trait locus for number of vertebrae and analysis of an orphan nuclear receptor, germ cell nuclear factor (NR6A1) Genome Res. 2007;17:586–593. doi: 10.1101/gr.6085507. [DOI] [PMC free article] [PubMed] [Google Scholar]
- 7.Hirschhorn JN, Daly MJ. Genome-wide association studies for common diseases and complex traits. Nat Rev Genet. 2005;6:95–108. doi: 10.1038/nrg1521. [DOI] [PubMed] [Google Scholar]
- 8.Jung EJ, et al. Genome-wide association study identifies quantitative trait loci affecting hematological traits in an F2 intercross between Landrace and Korean native pigs. Anim Genet. 2014;45:534–541. doi: 10.1111/age.12175. [DOI] [PubMed] [Google Scholar]
- 9.Sanchez MP, et al. A genome-wide association study of production traits in a commercial population of Large White pigs: evidence of haplotypes affecting meat quality. Genet Sel Evol. 2014;46:12. doi: 10.1186/1297-9686-46-12. [DOI] [PMC free article] [PubMed] [Google Scholar]
- 10.Ren J, et al. A missense mutation in PPARD causes a major QTL effect on ear size in pigs. PLoS Genet. 2011;7:e1002043. doi: 10.1371/journal.pgen.1002043. [DOI] [PMC free article] [PubMed] [Google Scholar]
- 11.Ma J, et al. A splice mutation in the PHKG1 gene causes high glycogen content and low meat quality in pig skeletal muscle. PLoS Genet. 2014;10:e1004710. doi: 10.1371/journal.pgen.1004710. [DOI] [PMC free article] [PubMed] [Google Scholar]
- 12.Ai H, Huang L, Ren J. Genetic diversity, linkage disequilibrium and selection signatures in chinese and Western pigs revealed by genome-wide SNP markers. PLoS One. 2013;8:e56001. doi: 10.1371/journal.pone.0056001. [DOI] [PMC free article] [PubMed] [Google Scholar]
- 13.Rubin CJ, et al. Whole-genome resequencing reveals loci under selection during chicken domestication. Nature. 2010;464:587–591. doi: 10.1038/nature08832. [DOI] [PubMed] [Google Scholar]
- 14.Axelsson E, et al. The genomic signature of dog domestication reveals adaptation to a starch-rich diet. Nature. 2013;495:360–364. doi: 10.1038/nature11837. [DOI] [PubMed] [Google Scholar]
- 15.Ai H, et al. Adaptation and possible ancient interspecies introgression in pigs identified by whole-genome sequencing. Nat Genet. 2015;47:217–225. doi: 10.1038/ng.3199. [DOI] [PubMed] [Google Scholar]
- 16.Frazer KA, et al. A second generation human haplotype map of over 3.1 million SNPs. Nature. 2007;449:851–861. doi: 10.1038/nature06258. [DOI] [PMC free article] [PubMed] [Google Scholar]
- 17.Abecasis GR, et al. An integrated map of genetic variation from 1,092 human genomes. Nature. 2012;491:56–65. doi: 10.1038/nature11632. [DOI] [PMC free article] [PubMed] [Google Scholar]
- 18.Pausch, H., Wurmser, C., Jansen, S., Aigner, B. & Fries, R. Imputation of whole-genome sequence information for QTL fine-mapping in the Fleckvieh population. International Society for Animal Genetics http://www.isag.us/2012 (2012).
- 19.Daetwyler HD, et al. Whole-genome sequencing of 234 bulls facilitates mapping of monogenic and complex traits in cattle. Nat Genet. 2014;46:858–865. doi: 10.1038/ng.3034. [DOI] [PubMed] [Google Scholar]
- 20.Ding NS, et al. Genetic variation of porcine prostaglandin-endoperoxide synthase 2 (PTGS2) gene and its association with reproductive traits in an Erhualian × Duroc F2 population. Yi Chuan Xue Bao. 2006;33:213–219. doi: 10.1016/S0379-4172(06)60042-5. [DOI] [PubMed] [Google Scholar]
- 21.Zhang F, et al. Genome-wide association studies for hematological traits in Chinese Sutai pigs. BMC Genet. 2014;15:41. doi: 10.1186/1471-2156-15-41. [DOI] [PMC free article] [PubMed] [Google Scholar]
- 22.Moore DD, Dowhan D. Preparation and Analysis of DNA. Current protocols in molecular biology. 1966;8:6–8. [Google Scholar]
- 23.Ramos AM, et al. Design of a high density SNP genotyping assay in the pig using SNPs identified and characterized by next generation sequencing technology. PLoS One. 2009;4:e6524. doi: 10.1371/journal.pone.0006524. [DOI] [PMC free article] [PubMed] [Google Scholar]
- 24.Chang CC, et al. Second-generation PLINK: rising to the challenge of larger and richer datasets. Gigascience. 2015;4:7. doi: 10.1186/s13742-015-0047-8. [DOI] [PMC free article] [PubMed] [Google Scholar]
- 25.Li M, et al. Genomic analyses identify distinct patterns of selection in domesticated pigs and Tibetan wild boars. Nat Genet. 2013;45:1431–1438. doi: 10.1038/ng.2811. [DOI] [PubMed] [Google Scholar]
- 26.Frantz LA, et al. Evidence of long-term gene flow and selection during domestication from analyses of Eurasian wild and domestic pig genomes. Nat Genet. 2015;47:1141–1148. doi: 10.1038/ng.3394. [DOI] [PubMed] [Google Scholar]
- 27.Moon S, et al. A genome-wide scan for signatures of directional selection in domesticated pigs. BMC Genomics. 2015;16:130. doi: 10.1186/s12864-015-1330-x. [DOI] [PMC free article] [PubMed] [Google Scholar]
- 28.Li H, Durbin R. Fast and accurate short read alignment with Burrows-Wheeler transform. Bioinformatics. 2009;25:1754–1760. doi: 10.1093/bioinformatics/btp324. [DOI] [PMC free article] [PubMed] [Google Scholar]
- 29.McKenna A, et al. The Genome Analysis Toolkit: a MapReduce framework for analyzing next-generation DNA sequencing data. Genome Res. 2010;20:1297–1303. doi: 10.1101/gr.107524.110. [DOI] [PMC free article] [PubMed] [Google Scholar]
- 30.Danecek P, et al. The variant call format and VCFtools. Bioinformatics. 2011;27:2156–2158. doi: 10.1093/bioinformatics/btr330. [DOI] [PMC free article] [PubMed] [Google Scholar]
- 31.Browning SR, Browning BL. Rapid and accurate haplotype phasing and missing-data inference for whole-genome association studies by use of localized haplotype clustering. Am J Hum Genet. 2007;81:1084–1097. doi: 10.1086/521987. [DOI] [PMC free article] [PubMed] [Google Scholar]
- 32.Browning BL, Browning SR. Genotype Imputation with Millions of Reference Samples. Am J Hum Genet. 2016;98:116–126. doi: 10.1016/j.ajhg.2015.11.020. [DOI] [PMC free article] [PubMed] [Google Scholar]
- 33.Brondum RF, Guldbrandtsen B, Sahana G, Lund MS, Su G. Strategies for imputation to whole genome sequence using a single or multi-breed reference population in cattle. BMC Genomics. 2014;15:728. doi: 10.1186/1471-2164-15-728. [DOI] [PMC free article] [PubMed] [Google Scholar]
- 34.van Binsbergen R, et al. Accuracy of imputation to whole-genome sequence data in Holstein Friesian cattle. Genet Sel Evol. 2014;46:41. doi: 10.1186/1297-9686-46-41. [DOI] [PMC free article] [PubMed] [Google Scholar]
- 35.Pausch, H. et al. Evaluation of the accuracy of imputed sequence variants and their utility for causal variant detection in cattle. Genet Sel Evol 49, 24, doi:10.1186/s12711-017-0301-x (2017). [DOI] [PMC free article] [PubMed]
- 36.Zhou X, Stephens M. Genome-wide efficient mixed-model analysis for association studies. Nat Genet. 2012;44:821–824. doi: 10.1038/ng.2310. [DOI] [PMC free article] [PubMed] [Google Scholar]
- 37.Price AL, Zaitlen NA, Reich D, Patterson N. New approaches to population stratification in genome-wide association studies. Nat Rev Genet. 2010;11:459–463. doi: 10.1038/nrg2813. [DOI] [PMC free article] [PubMed] [Google Scholar]
- 38.Pe’er I, Yelensky R, Altshuler D, Daly MJ. Estimation of the multiple testing burden for genomewide association studies of nearly all common variants. Genet Epidemiol. 2008;32:381–385. doi: 10.1002/gepi.20303. [DOI] [PubMed] [Google Scholar]
- 39.Johnson RC, et al. Accounting for multiple comparisons in a genome-wide association study (GWAS) BMC Genomics. 2010;11:724. doi: 10.1186/1471-2164-11-724. [DOI] [PMC free article] [PubMed] [Google Scholar]
- 40.Barrett JC, Fry B, Maller J, Daly MJ. Haploview: analysis and visualization of LD and haplotype maps. Bioinformatics. 2005;21:263–265. doi: 10.1093/bioinformatics/bth457. [DOI] [PubMed] [Google Scholar]
- 41.Yang G, Ren J, Zhang Z, Huang L. Genetic evidence for the introgression of Western NR6A1 haplotype into Chinese Licha breed associated with increased vertebral number. Anim Genet. 2009;40:247–250. doi: 10.1111/j.1365-2052.2008.01820.x. [DOI] [PubMed] [Google Scholar]
- 42.Abecasis GR, et al. A map of human genome variation from population-scale sequencing. Nature. 2010;467:1061–1073. doi: 10.1038/nature09534. [DOI] [PMC free article] [PubMed] [Google Scholar]
- 43.Huang J, Ellinghaus D, Franke A, Howie B, Li Y. 1000 Genomes-based imputation identifies novel and refined associations for the Wellcome Trust Case Control Consortium phase 1 Data. Eur J Hum Genet. 2012;20:801–805. doi: 10.1038/ejhg.2012.3. [DOI] [PMC free article] [PubMed] [Google Scholar]
- 44.Auton A, et al. A global reference for human genetic variation. Nature. 2015;526:68–74. doi: 10.1038/nature15393. [DOI] [PMC free article] [PubMed] [Google Scholar]
- 45.McCarthy S, et al. A reference panel of 64,976 haplotypes for genotype imputation. Nat Genet. 2016;48:1279–1283. doi: 10.1038/ng.3643. [DOI] [PMC free article] [PubMed] [Google Scholar]
- 46.Pausch H, et al. Identification of QTL for UV-protective eye area pigmentation in cattle by progeny phenotyping and genome-wide association analysis. PLoS One. 2012;7:e36346. doi: 10.1371/journal.pone.0036346. [DOI] [PMC free article] [PubMed] [Google Scholar]
- 47.Ma P, Brondum RF, Zhang Q, Lund MS, Su G. Comparison of different methods for imputing genome-wide marker genotypes in Swedish and Finnish Red Cattle. J Dairy Sci. 2013;96:4666–4677. doi: 10.3168/jds.2012-6316. [DOI] [PubMed] [Google Scholar]
- 48.Klein RJ, et al. Complement factor H polymorphism in age-related macular degeneration. Science. 2005;308:385–389. doi: 10.1126/science.1109557. [DOI] [PMC free article] [PubMed] [Google Scholar]
- 49.Zhang, L. et al. Quantitative trait loci for the number of vertebrae on Sus scrofa chromosomes 1 and 7 independently influence the numbers of thoracic and lumbar vertebrae in pigs. Journal of Integrative Agriculture14, 2027–2033, doi:10.1016/S2095-3119(15)61084-X (2015).
- 50.Marchini J, Howie B. Genotype imputation for genome-wide association studies. Nat Rev Genet. 2010;11:499–511. doi: 10.1038/nrg2796. [DOI] [PubMed] [Google Scholar]
- 51.Huang Y, Hickey JM, Cleveland MA, Maltecca C. Assessment of alternative genotyping strategies to maximize imputation accuracy at minimal cost. Genet Sel Evol. 2012;44:25. doi: 10.1186/1297-9686-44-25. [DOI] [PMC free article] [PubMed] [Google Scholar]
- 52.Hickey JM, Crossa J, Babu R. & de los Campos, G. Factors Affecting the Accuracy of Genotype Imputation in Populations from Several Maize Breeding Programs. Crop Science. 2012;52:1903–26. [Google Scholar]
- 53.Zhang Z, Druet T. Marker imputation with low-density marker panels in Dutch Holstein cattle. J Dairy Sci. 2010;93:5487–5494. doi: 10.3168/jds.2010-3501. [DOI] [PubMed] [Google Scholar]
- 54.Huang L, et al. Genotype-imputation accuracy across worldwide human populations. Am J Hum Genet. 2009;84:235–250. doi: 10.1016/j.ajhg.2009.01.013. [DOI] [PMC free article] [PubMed] [Google Scholar]
Associated Data
This section collects any data citations, data availability statements, or supplementary materials included in this article.