

Abstract
The change in maternal lipid, leptin and adiponectin concentrations during pregnancy and infant birth weight (BW) is still poorly characterized. Thus, the aim of the study was to evaluate the association of maternal lipids, leptin and adiponectin throughout pregnancy with large-for-gestational-age (LGA) births and BW z-score. A prospective cohort of 199 mothers was followed during pregnancy in Rio de Janeiro, Brazil. The statistical analyses comprised multiple logistic and linear regression. Women delivered 36 LGA and 11 small-for-gestational-age newborns. HDL-c rate of change throughout pregnancy was negatively associated with BW z-score (β = −1.99; p = 0.003) and the delivery of a LGA newborn (OR = 0.02; p = 0.043). Pregnancy baseline concentration of log leptin was positively associated (OR = 3.92; p = 0.025) with LGA births. LDL-c rate of change throughout pregnancy was positively associated with BW z-score (β = 0.31; p = 0.004). Log triglycerides and log adiponectin were not significantly associated with BW z-score or LGA birth. In conclusion, a higher log leptin pregnancy baseline concentration and a lower HDL-c rate of change during pregnancy were associated with higher odds of having a LGA newborn. These maternal biomarkers are important to foetal growth and could be used in prenatal care as an additional strategy to screen women at risk of inadequate BW.
Introduction
Birth weight (BW) has been associated with several adverse outcomes, both early and late in life. High BW has been associated with caesarean section, obesity and diabetes later in life1, 2. BW is influenced by maternal dietary intake, nutritional status, height, biological markers, gestational age at delivery, smoking habits and socioeconomic and demographic characteristics3–8.
Maternal serum cholesterol (HDL-c and LDL-c) is transported across the placenta9–11. It is suggested that although the foetal liver synthesizes most foetal cholesterol, maternal cholesterol is crucial in providing cholesterol to the foetus, especially during early pregnancy9, 10. Experimental studies indicate that maternal cholesterol affects foetal sterol metabolism and the metabolic functions of extra embryonic foetal tissues, impacting foetal development12, 13. Positive associations have been reported between maternal triglycerides (TG) and BW, especially in pregnancies complicated by gestational diabetes, and negative associations have been reported between HDL-c and BW6, 14–16. However, some studies have failed to find significant associations. Thus, there is no consensus regarding which lipid fractions are involved and how pregnancy-related changes in lipids may influence BW6, 14, 17.
Maternal adiposity is also an important predictor of BW18. Maternal blood concentrations of fat-derived hormones, such as leptin and adiponectin, significantly change during pregnancy18, 19. However, although an increase in leptin and a decrease in adiponectin concentrations are expected, studies have reported that women experience different rates of change of adipokines during pregnancy depending on pre-pregnancy body mass index (BMI)20–22. In this way, the pregnancy change in adipokines could be a potential mechanism linking maternal adiposity to foetal weight gain. Based on these assumptions, associations between maternal leptin and adiponectin concentrations and BW have been investigated, but reports are still contradictory17, 23.
Thus, considering the importance of foetal development and subsequent BW for health in early and late life and the lack of consensus regarding the associations between maternal lipids, leptin and adiponectin and BW, the aim of this study was to evaluate the association of maternal lipid, leptin and adiponectin concentrations throughout pregnancy with BW z-score and the prevalence of large-for-gestational-age (LGA) births.
Results
We evaluated data from 199, 178 and 180 women during the first, second and third gestational trimesters, respectively (9.5% were lost to follow-up). A total of 36 (18.1%) women delivered LGA newborns, whereas 11 were small-for-gestational-age (SGA, 5.5%). The mean gestational age at delivery was 38.8 (SD: 1.7) weeks (data not shown in tables).
Women had a mean age of 26.8 (SD: 5.5) years and an early pregnancy BMI of 25.4 (SD: 4.6) kg/m² at the study baseline. The mean lipid concentrations significantly increased throughout pregnancy: HDL-c by 15.9% (mean increase: 6.9 mg/dL; SD: 8.7); LDL-c by 43.4% (mean increase: 40.1 mg/dL; SD: 26.4); and total cholesterol (TC) by 40.5% (mean increase: 63.0 mg/dL; SD: 32.0). The highest mean percentage increase was observed for TG concentration, 114.8% (mean increase: 79.9 mg/dL; SD: 40.8). Women who delivered LGA newborns presented higher means of early pregnancy BMI (27.0 vs. 25.3 kg/m²; p = 0.042), second trimester glycaemia (82.0 vs. 78.3 mg/dL; p = 0.049) and first trimester leptin concentrations (27.7 vs. 19.6 ng/dL; p = 0.001), as well as lower third trimester adiponectin concentrations (4.6 vs. 6.3 µg/mL; p = 0.045) compared with those who delivered appropriate-for-gestational-age (AGA) newborns (Table 1).
Table 1.
Pregnancy characteristics according to birth weight categories in a sample of pregnant women and their newborns followed at a public health centre in Rio de Janeiro city, Brazil, 2009–2012.
| Total sample | SGA 1 | AGA 1 | LGA 1 | p 2 | p 3 | |||||
|---|---|---|---|---|---|---|---|---|---|---|
| n | Mean (SD) | n | Mean (SD) | n | Mean (SD) | n | Mean (SD) | |||
| Age (years) | 199 | 26.8 (5.5) | 11 | 25.0 (5.9) | 152 | 26.8 (5.6) | 36 | 26.9 (4.9) | 0.952 | 0.290 |
| Education (years of schooling) | 199 | 8.7 (2.9) | 11 | 8.6 (2.0) | 152 | 8.6 (3.0) | 36 | 8.8 (2.6) | 0.856 | 0.987 |
| Early pregnancy BMI (kg/m²) | 199 | 25.4 (4.6) | 11 | 21.8 (2.0) | 152 | 25.3 (4.4) | 36 | 27.0 (5.2) | 0.042 | 0.011 |
| Pre-pregnancy energy intake (kcal/day) | 199 | 2312 (688) | 11 | 2576 (738) | 152 | 2288 (719) | 36 | 2330 (521) | 0.741 | 0.202 |
| Gestational weight gain (kg) | 189 | 11.8 (4.3) | 9 | 10.6 (3.6) | 147 | 11.6 (4.3) | 33 | 12.5 (4.4) | 0.280 | 0.465 |
| Glycaemia (mg/dL) | ||||||||||
| 1st T | 198 | 84.3 (9.2) | 11 | 85.5 (7.1) | 151 | 84.5 (9.8) | 36 | 82.8 (7.4) | 0.329 | 0.738 |
| 2nd T | 171 | 79.0 (9.6) | 8 | 78.0 (7.9) | 131 | 78.3 (9.6) | 32 | 82.0 (9.7) | 0.049 | 0.934 |
| 3rd T | 174 | 80.0 (11.8) | 9 | 75.6 (5.4) | 136 | 80.3 (12.5) | 29 | 79.8 (9.2) | 0.927 | 0.262 |
| Mean change (1st to 3rd T) | 174 | −4.2 (13.7) | 9 | −11.7 (7.5) | 136 | −3.8 (14.5) | 29 | −3.6 (10.8) | 0.924 | 0.112 |
| HDL-cholesterol (mg/dL) | ||||||||||
| 1st T | 199 | 47.9 (8.2) | 11 | 44.7 (6.5) | 152 | 47.9 (8.3) | 36 | 49.1 (7.6) | 0.401 | 0.224 |
| 2nd T | 178 | 57.4 (9.9) | 9 | 57.7 (11.7) | 137 | 57.6 (9.9) | 32 | 56.6 (9.7) | 0.617 | 0.991 |
| 3rd T | 180 | 54.8 (9.9) | 10 | 57.0 (10.8) | 141 | 55.0 (9.8) | 29 | 53.3 (10.3) | 0.398 | 0.542 |
| Mean change (1st to 3rd T) | 180 | 6.9 (8.7) | 10 | 11.1 (6.0) | 141 | 7.0 (8.6) | 29 | 4.3 (3.3) | 0.215 | 0.169 |
| LDL-cholesterol (mg/dL) | ||||||||||
| 1st T | 199 | 96.0 (21.1) | 11 | 85.6 (21.8) | 152 | 96.3 (21.9) | 36 | 97.9 (16.1) | 0.690 | 0.120 |
| 2nd T | 178 | 127.0 (28.7) | 9 | 106.6 (27.7) | 137 | 126.3 (28.3) | 32 | 135.9 (27.9) | 0.085 | 0.046 |
| 3rd T | 180 | 136.7 (33.2) | 10 | 107.2 (31.0) | 141 | 137.6 (33.0) | 29 | 142.3 (30.7) | 0.481 | 0.005 |
| Mean change (1st to 3rd T) | 180 | 40.1 (26.4) | 10 | 24.9 (18.6) | 141 | 40.7 (26.2) | 29 | 42.2 (28.5) | 0.778 | 0.080 |
| Total cholesterol (mg/dL) | ||||||||||
| 1st T | 199 | 159.8 (27.8) | 11 | 144.7 (26.7) | 152 | 160.3 (29.2) | 36 | 162.5 (20.3) | 0.675 | 0.088 |
| 2nd T | 178 | 210.8 (35.8) | 9 | 190.6 (35.9) | 137 | 210.2 (35.9) | 32 | 218.8 (33.5) | 0.218 | 0.114 |
| 3rd T | 180 | 223.2 (40.8) | 10 | 194.9 (39.8) | 141 | 224.3 (40.8) | 29 | 227.6 (39.0) | 0.686 | 0.029 |
| Mean change (1st to 3rd T) | 180 | 63.0 (32.0) | 10 | 53.1 (23.6) | 141 | 63.3 (31.6) | 29 | 64.6 (36.1) | 0.848 | 0.344 |
| Triglycerides (mg/dL) | ||||||||||
| 1st T | 199 | 79.5 (31.9) | 11 | 71.8 (31.4) | 152 | 80.6 (33.8) | 36 | 77.2 (22.7) | 0.569 | 0.406 |
| 2nd T | 178 | 131.6 (48.9) | 9 | 131.3 (58.5) | 137 | 131.6 (50.8) | 32 | 131.6 (38.2) | 0.995 | 0.986 |
| 3rd T | 180 | 158.2 (49.4) | 10 | 153.4 (60.5) | 141 | 158.2 (51.3) | 29 | 160.0 (35.9) | 0.859 | 0.777 |
| Mean change (1st to 3rd T) | 180 | 79.9 (40.8) | 10 | 85.2 (48.9) | 141 | 78.0 (41.5) | 29 | 87.8 (34.5) | 0.234 | 0.616 |
| Leptin (ng/dL) | ||||||||||
| 1st T | 199 | 20.7 (13.7) | 11 | 14.5 (11.5) | 152 | 19.6 (12.7) | 36 | 27.7 (16.2) | 0.001 | 0.200 |
| 2nd T | 178 | 33.0 (20.2) | 9 | 34.0 (24.4) | 137 | 31.4 (19.6) | 32 | 38.2 (21.3) | 0.103 | 0.746 |
| 3rd T | 178 | 32.2 (21.7) | 10 | 36.2 (36.1) | 139 | 31.0 (20.2) | 29 | 36.6 (22.8) | 0.184 | 0.461 |
| Mean change (1st to 3rd T) | 178 | 11.7 (18.0) | 10 | 17.9 (32.8) | 139 | 11.4 (17.0) | 29 | 11.0 (17.1) | 0.902 | 0.301 |
| Adiponectin (µg/mL) | ||||||||||
| 1st T | 199 | 6.0 (3.9) | 11 | 7.5 (4.3) | 152 | 6.1 (3.4) | 36 | 5.3 (5.4) | 0.272 | 0.177 |
| 2nd T | 173 | 7.0 (5.9) | 9 | 5.7 (2.8) | 132 | 7.4 (6.3) | 32 | 6.0 (4.3) | 0.255 | 0.438 |
| 3rd T | 177 | 6.1 (4.2) | 10 | 8.8 (7.2) | 138 | 6.3 (4.2) | 29 | 4.6 (2.0) | 0.045 | 0.083 |
| Mean change (1st to 3rd T) | 177 | 0.6 (3.6) | 10 | 2.8 (6.6) | 138 | 0.51 (3.6) | 29 | 0.04 (2.0) | 0.499 | 0.075 |
1Birth weight was classified according to the international foetal and newborn growth consortium for the 21st Century (Intergrowth-21st) curves. 2p-value refers to Student’s t test comparison between AGA and LGA. 3p-value refers to Student’s t test for comparison between AGA and SGA.
AGA = adequate for gestational age; BMI = Body mass index; HDL-c = high density lipoprotein; LDL-c = low density lipoprotein; LGA = large for gestational age; SD = standard deviation; SGA = small for gestational age; T = trimester.
Seventy-six (40.4%) women were classified as overweight or obese, 12 (6.0%) smoked during the first trimester, and 112 (56.3%) reported >8 years of schooling. We observed a higher frequency of LGA births among women with early pregnancy overweight or obesity (55.9%) compared to those with normal weight (38.2%) (Table 2).
Table 2.
Distribution of maternal characteristics according to birth weight categories in a sample of pregnant women and their newborns followed at a public health centre in Rio de Janeiro city, Brazil, 2009–2012.
| Variables | Total sample | SGA1 | AGA1 | LGA1 | p 2 | p 3 | ||||
|---|---|---|---|---|---|---|---|---|---|---|
| N | % | n | % | n | % | n | % | |||
| Age (years) | ||||||||||
| ≤30 | 141 | 70.8 | 9 | 6.4 | 105 | 74.5 | 27 | 19.1 | 0.545 | 0.508 |
| >30 | 58 | 29.2 | 2 | 3.4 | 47 | 81.0 | 9 | 15.5 | ||
| Education (years of schooling) | ||||||||||
| ≤8 | 87 | 43.7 | 5 | 5.8 | 68 | 78.2 | 14 | 16.1 | 0.519 | 1.000 |
| >8 | 112 | 56.3 | 6 | 5.4 | 84 | 75.0 | 22 | 19.6 | ||
| Smoking habit | ||||||||||
| No | 187 | 94.0 | 10 | 5.4 | 141 | 75.4 | 36 | 19.2 | 0.093 | 0.581 |
| Yes | 12 | 6.0 | 1 | 8.3 | 11 | 91.2 | 0 | 0.0 | ||
| Alcohol consumption | ||||||||||
| No | 163 | 81.9 | 9 | 5.5 | 124 | 76.1 | 30 | 18.4 | 0.806 | 1.000 |
| Yes | 36 | 18.1 | 2 | 5.6 | 28 | 77.8 | 6 | 16.7 | ||
| Pre-pregnancy LTPA | ||||||||||
| No | 147 | 74.6 | 9 | 6.1 | 115 | 78.2 | 23 | 15.7 | 0.102 | 1.000 |
| Yes | 50 | 25.4 | 2 | 4.0 | 35 | 70.0 | 13 | 26.0 | ||
| Parity (parturitions) | ||||||||||
| 0 | 77 | 38.7 | 7 | 9.1 | 60 | 77.9 | 10 | 13.0 | 0.137 | 0.202 |
| ≥1 | 122 | 61.3 | 4 | 3.3 | 92 | 75.4 | 26 | 21.3 | ||
| Pre-pregnancy BMI (kg/m²) | ||||||||||
| 18.5 - 24.9 | 112 | 59.6 | 8 | 7.1 | 89 | 79.5 | 15 | 13.4 | 0.042 | 0.325 |
| ≥25.0 | 76 | 40.4 | 2 | 2.6 | 55 | 72.4 | 19 | 25.0 | ||
1Birth weight was classified according to the international foetal and newborn growth consortium for the 21st Century (Intergrowth-21st) curves. 2p-value refers to chi-square or Fisher’s exact test for proportions between AGA and LGA; 3p-value refers to chi-square or Fisher’s exact test for proportions between AGA and SGA.
AGA = adequate for gestational age; BMI = body mass index; LGA = large for gestational age; LTPA = leisure time physical activity; SD = standard deviation; SGA = small for gestational age.
Figures 1–6 present longitudinal changes in the maternal biomarkers stratified according to BW category. The analyses revealed that the HDL-c rate of change per gestational week was significantly lower in the LGA group compared to the AGA and SGA groups (Fig. 1). We did not observe significant differences in longitudinal changes of LDL-c (Fig. 2), TC (Fig. 3), TG (Fig. 4), leptin (Fig. 5) or adiponectin (Fig. 6) between BW groups. However, women who delivered LGA newborns presented higher early pregnancy leptin concentrations compared with those who delivered AGA or SGA newborns (Fig. 5).
Figure 1.
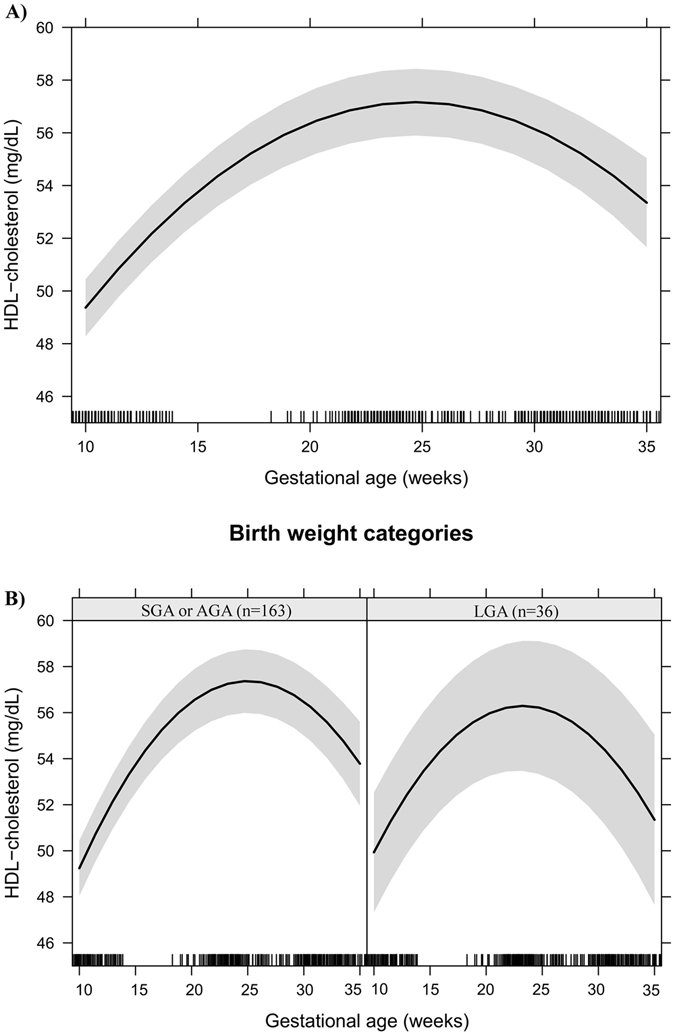
HDL-cholesterol changes during pregnancy in a sample of 199 women and their newborns followed at a public health centre in Rio de Janeiro city, Brazil, 2009–2012. (A) Change per gestational week. (B) Change per gestational week according to birth weight categories. Note: The models were adjusted for age, education, smoking habit, pre-pregnancy leisure time physical activity, pre-pregnancy energy intake, glycaemia, parity, early pregnancy BMI, gestational weight gain and quadratic gestational age. Data are presented as linear mixed effect coefficient (β) and 95% CI. p-value refers to the maximum likelihood estimator. (A) Linear gestational age: β = 1.80 (1.52; 2.08), p < 0.001; Quadratic gestational age: β = −0.04 (−0.04; −0.03), p < 0.001. (B) SGA or AGA - Linear gestational age: β = 1.76 (1.44; 2.08), p < 0.001; quadratic gestational age; β = −0.04 (−0.04; −0.03), p < 0.001. LGA - Linear gestational age: β = 2.04 (1.42; 2.65), p < 0.001; gestational age; β = −0.04 (−0.06; −0.03), p < 0.001.
Figure 6.
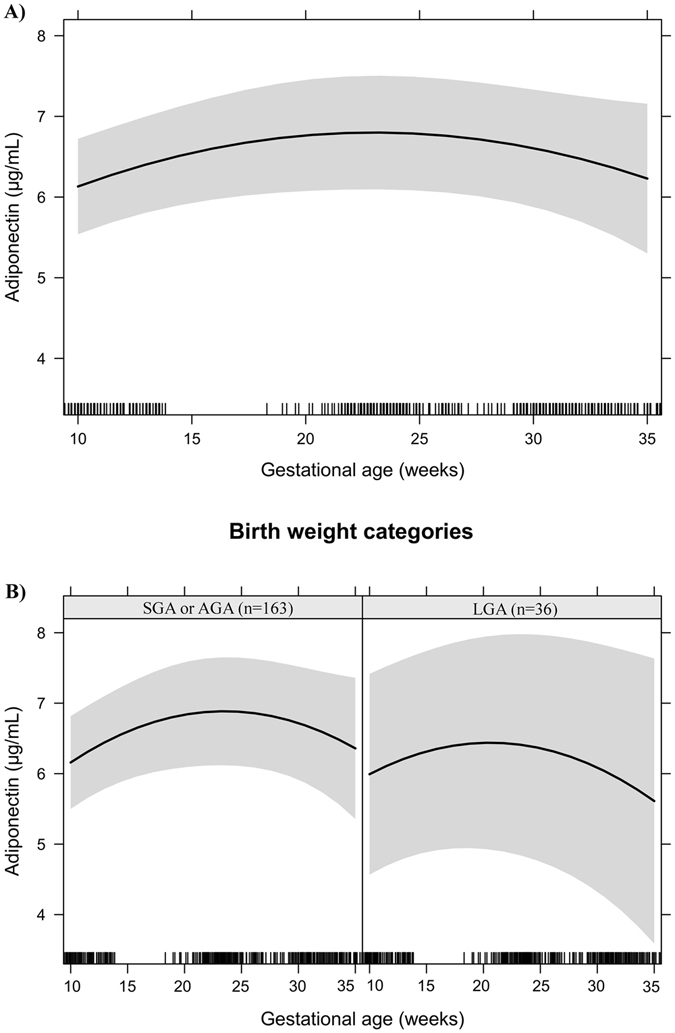
Adiponectin changes during pregnancy in a sample of 199 women and their newborns followed at a public health centre in Rio de Janeiro city, Brazil, 2009–2012. (A) Change per gestational week. (B) Change per gestational week according to birth weight categories. Note: The models were adjusted for age, education, smoking habit, pre-pregnancy leisure time physical activity, pre-pregnancy energy intake, glycaemia, parity, early pregnancy BMI, gestational weight gain and quadratic gestational age. Data are presented as linear mixed effect coefficient (β) and 95% CI. p-value refers to the maximum likelihood estimator. (A) Linear gestational age: β = 0.19 (0.03; 0.34), p = 0.018; Quadratic gestational age: β = −0.004 (−0.01; −0.0003), p = 0.033. (B) SGA or AGA - Linear gestational age: β = 0.21 (0.03; 0.39), p = 0.021; quadratic gestational age; β = −0.004 (−0.01; −0.0002), p = 0.042. LGA - Linear gestational age: β = 0.13 (−0.02; 0.29), p = 0.096; gestational age; β = −0.004 (−0.01; 0.0003), p = 0.031.
Figure 2.
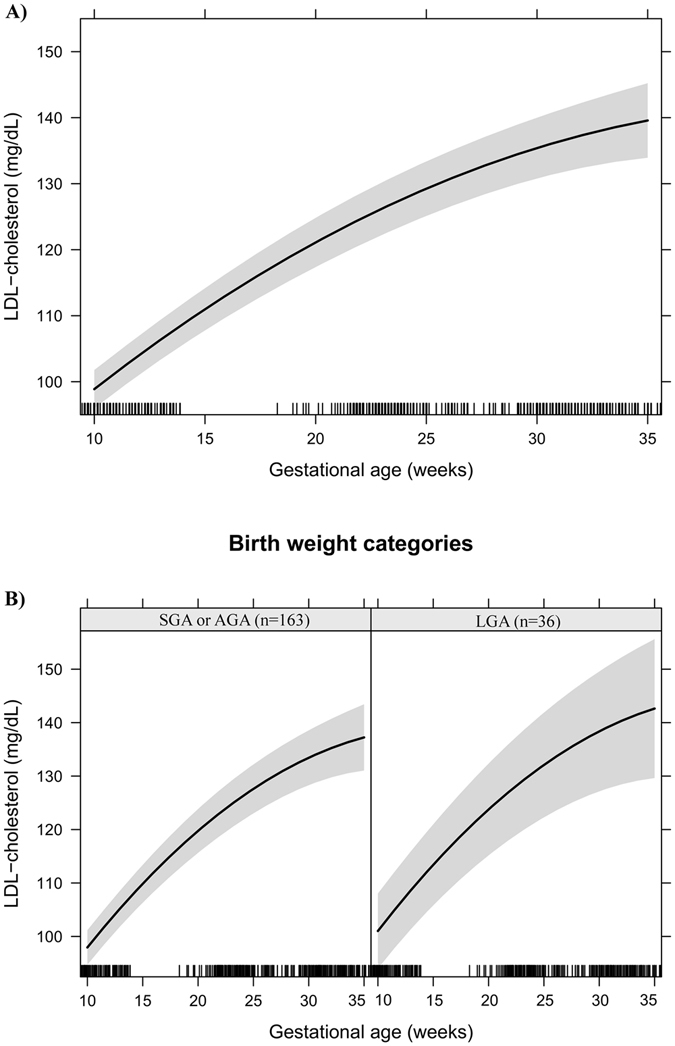
LDL-cholesterol changes during pregnancy in a sample of 199 women and their newborns followed at a public health centre in Rio de Janeiro city, Brazil, 2009–2012. (A) Change per gestational week. (B) Change per gestational week according to birth weight categories. Note: The models were adjusted for age, education, smoking habit, pre-pregnancy leisure time physical activity, pre-pregnancy energy intake, glycaemia, parity, early pregnancy BMI, gestational weight gain and quadratic gestational age. Data are presented as linear mixed effect coefficient (β) and 95% CI. p-value refers to the maximum likelihood estimator. (A) Linear gestational age: β = 3.46 (2.77; 4.14), p < 0.001; Quadratic gestational age: β = −0.042 (−0.06; −0.02), p < 0.001. (B) SGA or AGA - Linear gestational age: β = 3.11 (2.38; 3.83), p < 0.001; quadratic gestational age; β = −0.03 (−0.05; −0.02), p < 0.001. LGA - Linear gestational age: β = 4.956 (3.30; 6.62), p < 0.001; gestational age; β = −0.08 (−0.12; −0.04), p < 0.001.
Figure 3.
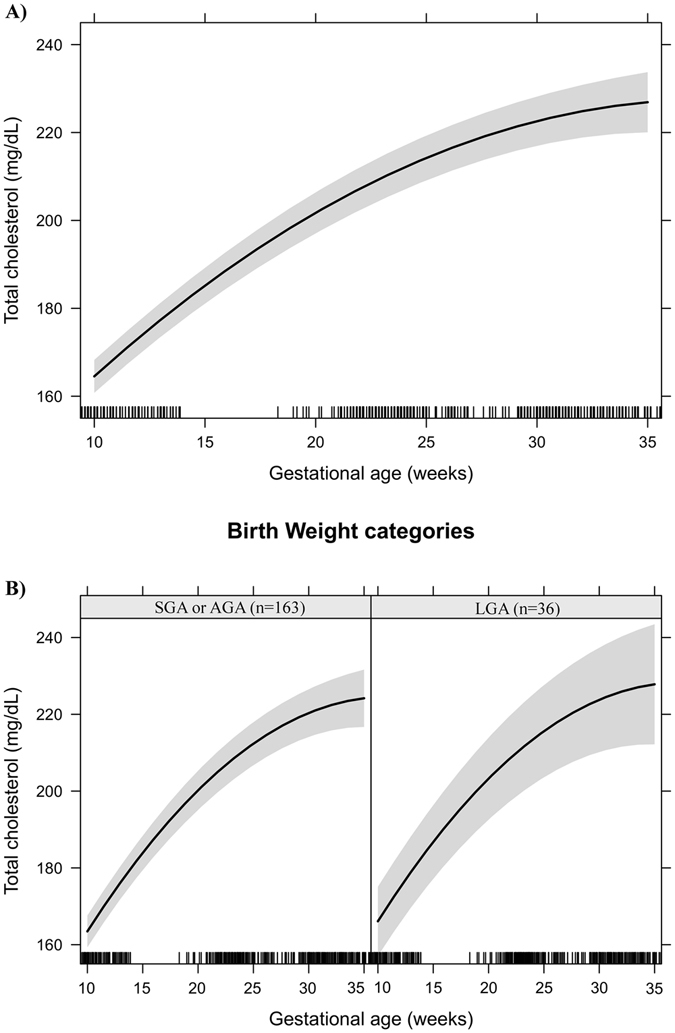
Total cholesterol changes during pregnancy in a sample of 199 women and their newborns followed at a public health centre in Rio de Janeiro city, Brazil, 2009–2012. (A) Change per gestational week. (B) Change per gestational week according to birth weight categories. Note: The models were adjusted for age, education, smoking habit, pre-pregnancy leisure time physical activity, pre-pregnancy energy intake, glycaemia, parity, early pregnancy BMI, gestational weight gain and quadratic gestational age. Data are presented as linear mixed effect coefficient (β) and 95% CI. p-value refers to the maximum likelihood estimator.(A) Linear gestational age: β = 6.21 (5.36; 7.05), p < 0.001; Quadratic gestational age: β = −0.085 (−0.10; −0.07), p < 0.001. (B) SGA or AGA - Linear gestational age: β = 5.88 (4.98; 6.78), p < 0.001; quadratic gestational age; β = −0.08 (−0.10; −0.06), p < 0.001. LGA - Linear gestational age: β = 7.67 (5.50; 9.83), p < 0.001; gestational age; β = −0.12 (−0.17; −0.07), p < 0.001.
Figure 4.
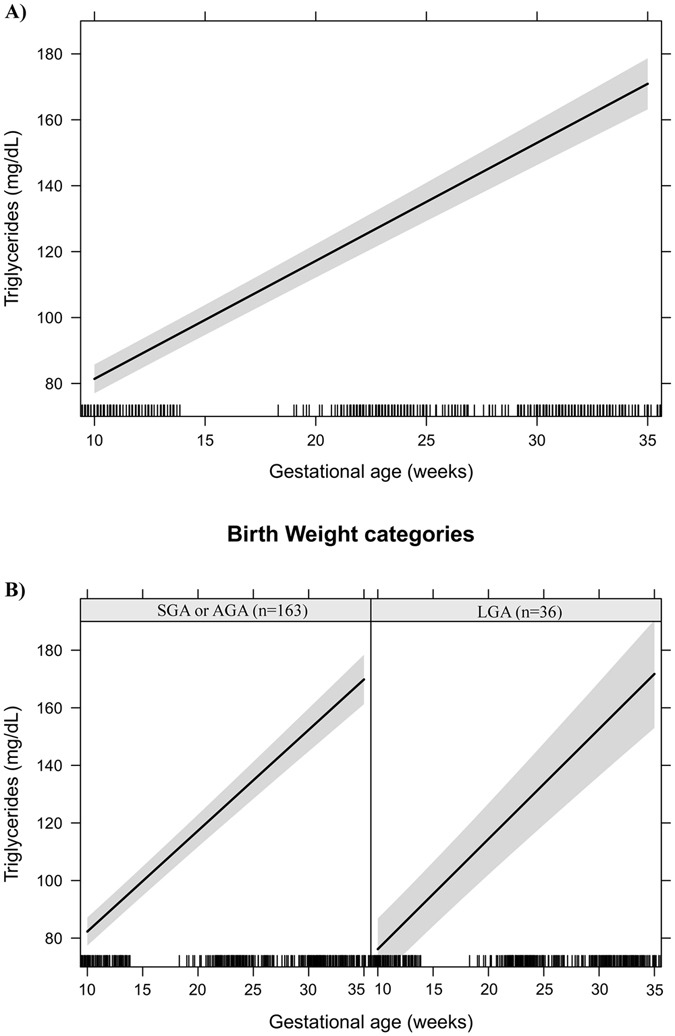
Triglycerides changes during pregnancy in a sample of 199 women and their newborns followed at a public health centre in Rio de Janeiro city, Brazil, 2009–2012. (A) Change per gestational week. (B) Change per gestational week according to birth weight categories. Note: The models were adjusted for age, education, smoking habit, pre-pregnancy leisure time physical activity, pre-pregnancy energy intake, glycaemia, parity, early pregnancy BMI, gestational weight gain and quadratic gestational age. Data are presented as linear mixed effect coefficient (β) and 95% CI. p-value refers to the maximum likelihood estimator. (A) Linear gestational age: β = 3.52 (3.26; 3.78), p < 0.001. (B) SGA or AGA - Linear gestational age: β = 3.45 (3.16; 3.74), p < 0.001. LGA - Linear gestational age: β = 3.79 (3.23; 4.35), p < 0.001.
Figure 5.
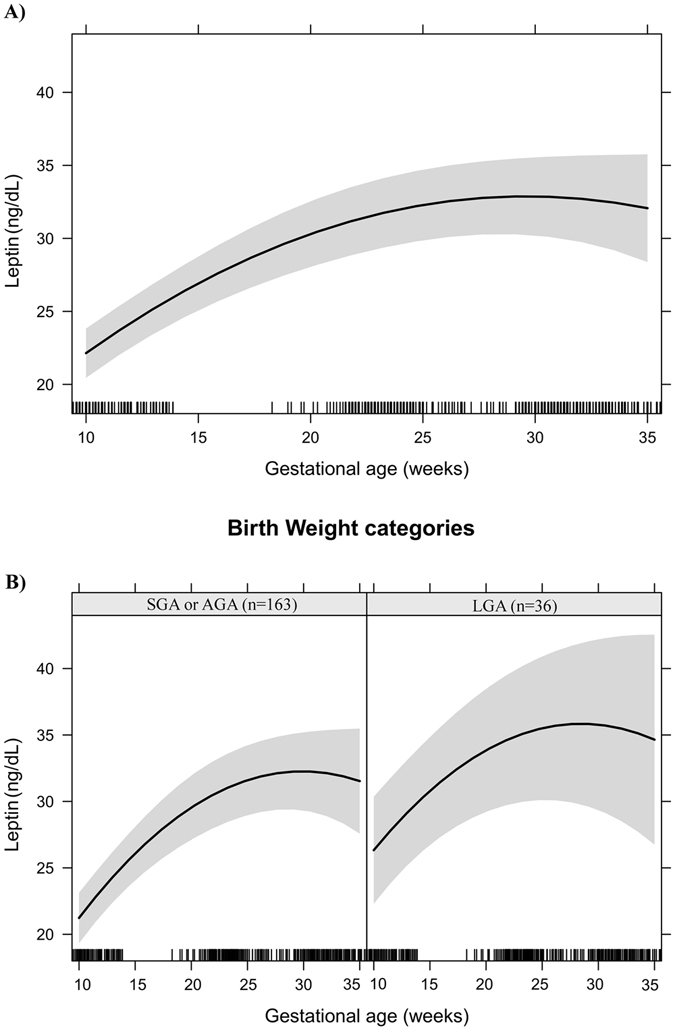
Leptin changes during pregnancy in a sample of 199 women and their newborns followed at a public health centre in Rio de Janeiro city, Brazil, 2009–2012. (A) Change per gestational week. (B) Change per gestational week according to birth weight categories. Note: The models were adjusted for age, education, smoking habit, pre-pregnancy leisure time physical activity, pre-pregnancy energy intake, glycaemia, parity, early pregnancy BMI, gestational weight gain and quadratic gestational age. Data are presented as linear mixed effect coefficient (β) and 95% CI. p-value refers to the maximum likelihood estimator. (A) Linear gestational age: β = 1.60 (0.98; 2.22), p < 0.001; Quadratic gestational age: β = −0.027 (−0.04; −0.01), p = 0.001. (B) SGA or AGA - Linear gestational age: β = 1.74 (1.07; 2.42), p < 0.001; quadratic gestational age; β = −0.029 (−0.04; −0.01), p < 0.001. LGA - Linear gestational age: β = 1.33 (−0.14; 2.81), p = 0.077; gestational age; β = −0.02 (−0.06; −0.01), p = 0.233.
Mean BW z-scores tended to be higher in women who practiced leisure time physical activity (LTPA) before pregnancy than in those who did not (0.52 vs. 0.25; p = 0.119), with one or more parturitions than in nulliparous (0.42 vs. 0.14; p = 0.072), and in women with overweight/obesity than in those with a normal weight at early pregnancy (0.48 vs. 0.22; p = 0.103) (Table 3).
Table 3.
Mean birth weight z-score according to maternal characteristics in a sample of pregnant women and their newborns followed at a public health centre in Rio de Janeiro city, Brazil, 2009–2012.
| Variables | N | Birth weight z-score1 | |
|---|---|---|---|
| Mean (SD) | p 2 | ||
| Age (years) | |||
| ≤30 | 141 | 0.28 (1.09) | 0.470 |
| >30 | 58 | 0.40 (1.01) | |
| Education (years of schooling) | |||
| ≤8 | 87 | 0.30 (1.03) | 0.893 |
| >8 | 112 | 0.32 (1.09) | |
| Smoking habit | |||
| No | 187 | 0.33 (1.07) | 0.210 |
| Yes | 12 | −0.06 (0.98) | |
| Alcohol consumption | |||
| No | 163 | 0.32 (1.05) | 0.835 |
| Yes | 36 | 0.28 (1.13) | |
| Pre-pregnancy LTPA | |||
| No | 147 | 0.25 (1.00) | 0.119 |
| Yes | 50 | 0.52 (1.22) | |
| Parity (parturitions) | |||
| 0 | 77 | 0.14 (1.08) | 0.072 |
| ≥1 | 122 | 0.42 (1.04) | |
| Pre-pregnancy BMI (kg/m²) | |||
| 18.5–24.9 | 112 | 0.22 (1.07) | 0.103 |
| ≥25.0 | 76 | 0.48 (1.05) | |
1Birth weight z-score was classified according to the international foetal and newborn growth consortium for the 21st Century (Intergrowth-21st) curves. 2p-value refers to unpaired Student’s t test.
Abbreviations: BMI = body mass index; LGA = large for gestational age; LTPA = leisure time physical activity; SD = standard deviation.
HDL-c rate of change during pregnancy was negatively associated with LGA birth (slope OR = 0.01; 95%CI: 0.0002 to 0.29; p = 0.009), while pregnancy baseline concentrations of log leptin were positively associated with LGA birth (intercept OR = 3.88; 95%CI: 1.49 to 10.09; p = 0.005) (Table 4). The association between HDL-c (rate of change/slope OR = 0.02; 95%CI: 0.0003 to 0.88; p = 0.043) and log leptin (pregnancy baseline concentrations/intercept OR = 3.92; 95%CI: 1.18 to 12.95; p = 0.025) with LGA births persisted even in the fully adjusted model (Table 4 , model 3).
Table 4.
Logistic regression between maternal lipids, log leptin and log adiponectin time trends during pregnancy and large-for-gestational-age (LGA)1 in a sample of women and their newborns followed at a public health centre in Rio de Janeiro city, Brazil, 2009–2012.
| LGA1 | ||||||
|---|---|---|---|---|---|---|
| Model 1 (n = 199) | Model 2 (n = 186) | Model 3 (n = 186) | ||||
| OR2 (95% CI) | p3 | OR2 (95% CI) | p3 | OR2 (95% CI) | p3 | |
| HDL-cholesterol | ||||||
| Intercept | 1.11 (1.00 to 1.24) | 0.050 | 1.09 (0.96 to 1.23) | 0.170 | 1.10 (0.97 to 1.24) | 0.135 |
| Slope | 0.01 (0.0002 to 0.29) | 0.009 | 0.02 (0.0004 to 1.09) | 0.055 | 0.02 (0.0003 to 0.88) | 0.043 |
| LDL-cholesterol | ||||||
| Intercept | 0.99 (0.95 to 1.03) | 0.553 | 1.00 (0.96 to 1.04) | 0.898 | 0.99 (0.95 to 1.03) | 0.751 |
| Slope | 1.69 (0.95 to 2.99) | 0.073 | 1.46 (0.77 to 2.74) | 0.245 | 1.52 (0.80 to 2.88) | 0.203 |
| Log triglycerides | ||||||
| Intercept | 0.96 (0.19 to 4.83) | 0.965 | 1.30 (0.23 to 7.42) | 0.772 | 1.09 (0.18 to 6.51) | 0.922 |
| Slope | 4.5e + 34 (2.8e–07 to 7.2e + 75) | 0.099 | 9.3e + 42 (0.005 to 1.8e + 88) | 0.063 | 1.0e + 43 (0.001 to 9.5e + 88) | 0.067 |
| Log leptin | ||||||
| Intercept | 3.89 (1.49 to 10.09) | 0.005 | 5.35 (1.84 to 15.57) | 0.002 | 3.92 (1.18 to 12.95) | 0.025 |
| Slope | 0.04 (3.6e–46 to 3.4e + 42) | 0.948 | 7.1e–15 (3.0e–62to 1.7e + 32) | 0.558 | 1.1e–10 (7.4e–59 to 1.5e–38) | 0.685 |
| Log adiponectin | ||||||
| Intercept | 0.34 (0.12 to 1.00) | 0.049 | 0.53 (0.16 to 1.81) | 0.314 | 0.54 (0.16 to 1.83) | 0.321 |
| Slope | 45.47 (1.5e–18 to 1.4e + 21) | 0.868 | 76.4 (1.0e–19 to 5.6e + 22) | 0.860 | 0.26 (1.4e–22 to 4.6e + 20) | 0.957 |
| Age (years) | — | — | 0.94 (0.86 to 1.04) | 0.236 | 0.95 (0.86 to 1.04) | 0.266 |
| Education | — | — | 1.03 (0.86 to 1.22) | 0.765 | 1.03 (0.87 to 1.22) | 0.732 |
| Pre-pregnancy LTPA (no/yes) | — | — | 1.76 (0.65 to 4.80) | 0.268 | 1.82 (0.66 to 4.98) | 0.246 |
| Parity (n of parturitions) | — | — | 1.55 (1.01 to 2.40) | 0.045 | 1.52 (0.98 to 2.35) | 0.061 |
| Pre-pregnancy energy intake (kcal/day) | — | — | 1.00 (1.00 to 1.001) | 0.597 | 1.00 (1.00 to 1.00) | 0.662 |
| Glycaemia (mg/dL) | — | — | 0.97 (0.92 to 1.02) | 0.287 | 0.97 (0.92 to 1.02) | 0.232 |
| Gestational weight gain (kg) | — | — | 1.08 (0.97 to 1.21) | 0.146 | 1.09 (0.97 to 1.21) | 0.142 |
| Early pregnancy BMI (kg/m2) | — | — | — | — | 1.07 (0.94 to 1.21) | 0.292 |
1LGA was classified according to the international foetal and newborn growth consortium for the 21st Century (Intergrowth-21st) curves. 2Odds ratio. 3p-value refers to the logistic regression.
Notes: Intercept variables represent the prediction of the mean exposure level, i.e. biomarkers concentrations when the gestational age was zero and the slope the trend of change in concentrations during pregnancy. Model 1 included lipids, leptin and adiponectin intercepts and slopes variables; Model 2 was additionally adjusted for women’s age, education, parity, pre-pregnancy practice of leisure time physical activity, pre-pregnancy energy intake, glycaemia and gestational weight gain. Model 3 was additionally adjusted for early pregnancy BMI. The models were not adjusted by smoking habit since none of the mothers of LGA smoked during pregnancy.
Abbreviations: CI = confidence interval; HDL-c = high-density lipoprotein; LDL-c = low-density lipoprotein; LGA = large-for-gestational-age; LTPA = leisure time physical activity.
LDL-c rate of change per gestational week during pregnancy (slope) was positively associated with BW z-score (β = 0.31; 95%CI: 0.10 to 0.52; p = 0.004), whereas HDL-c rate of change was negatively associated with BW z-score (β = −1.99; 95%CI: −3.30 to −0.68; p = 0.003), even after adjustments. The pregnancy baseline log leptin concentrations were directly associated with BW z-scores after adjustment for confounders (β = 0.43; 95%CI: 0.10 to 0.75; p = 0.010), but the associations were no longer significant after inclusion of early pregnancy BMI in the model (0.19; 95%CI: −0.18 to 0.56; p = 0.306) (Table 5). The log TG and log adiponectin pregnancy baseline concentrations and rates of change during pregnancy were not significantly associated with BW z-score or LGA birth (Tables 4 and 5).
Table 5.
Linear regression between maternal lipids, log leptin and log adiponectin time trends during pregnancy and birth weight z-score1 in a sample of women and their newborns followed at a public health centre in Rio de Janeiro city, Brazil, 2009–2012.
| Birth weight z-score1 | ||||||
|---|---|---|---|---|---|---|
| Model 1 (n = 199) | Model 2 (n = 186) | Model 3 (n = 186) | ||||
| β2 (95% CI) | p3 | β2 (95% CI) | p3 | β2 (95% CI) | p3 | |
| HDL-cholesterol | ||||||
| Intercept | 0.06 (0.01 to 0.10) | 0.008 | 0.04 (−0.01 to 0.08) | 0.095 | 0.04 (−0.001 to 0.82) | 0.054 |
| Slope | −2.15 (−3.47 to −0.83) | 0.002 | −1.85 (−3.18 to −0.53) | 0.006 | −1.99 (−3.30 to −0.68) | 0.003 |
| LDL-cholesterol | ||||||
| Intercept | −0.01 (−0.02 to 0.01) | 0.376 | −0.01 (−0.02 to 0.01) | 0.354 | −0.01 (−0.02 to 0.01) | 0.204 |
| Slope | 0.36 (0.15 to 0.58) | 0.001 | 0.27 (0.06 to 0.48) | 0.012 | 0.31 (0.10 to 0.52) | 0.004 |
| Log triglycerides | ||||||
| Intercept | 0.11 (−0.46 to 0.68) | 0.702 | 0.21 (−0.38 to 0.80) | 0.444 | 0.11 (−0.48 to 0.68) | 0.714 |
| Slope | 13.50 (−18.60 to 45.60) | 0.408 | 14.04 (−18.35 to 47.08) | 0.387 | 12.37 (−19.89 to 44.64) | 0.450 |
| Log leptin | ||||||
| Intercept | 0.42 (0.10 to 0.74) | 0.010 | 0.43 (0.10 to 0.75) | 0.010 | 0.19 (−0.18 to 0.56) | 0.306 |
| Slope | −15.96 (−53.67 to 21.76) | 0.405 | −21.97 (−60.43 to 16.49) | 0.261 | −14.34 (−52.71 to 24.02) | 0.461 |
| Log adiponectin | ||||||
| Intercept | −0.13 (−0.48 to 0.22) | 0.469 | 0.06 (−0.29 to 0.42) | 0.736 | 0.10 (−0.25 to 0.45) | 0.555 |
| Slope | 11.43 (−5.22 to 28.08) | 0.177 | 10.77 (−5.67 to 27.20) | 0.171 | 8.31 (−8.09 to 24.72) | 0.359 |
| Age (years) | — | — | −0.001 (−0.03 to 0.03) | 0.963 | −0.001 (−0.03 to 0.03) | 0.959 |
| Education (years of schooling) | — | — | 0.01 (−0.04 to 0.07) | 0.707 | 0.01 (−0.04 to 0.07) | 0.699 |
| Smoking habit (no/yes) | — | — | −0.03 (−0.70 to 0.64) | 0.924 | −0.08 (−0.74 to 0.58) | 0.816 |
| Pre-pregnancy LTPA (no/yes) | — | — | 0.18 (−0.17 to 0.54) | 0.308 | 0.21 (−0.14 to 0.55) | 0.243 |
| Parity (n of parturitions) | — | — | 0.14 (−0.004 to 0.30) | 0.055 | 0.13 (−0.02 to 0.29) | 0.083 |
| Pre-pregnancy energy intake (kcal/day) | — | — | −0.0001 (−0.003 to 0.0001) | 0.246 | −0.0001 (−0.0003 to 0.0001) | 0.246 |
| Glycaemia (mg/dL) | — | — | −0.01 (−0.02 to 0.01) | 0.294 | −0.01 (−0.03 to 0.01) | 0.185 |
| Gestational weight gain (kg) | — | — | 0.04 (0.01 to 0.08) | 0.016 | 0.05 (0.01 o 0.09) | 0.009 |
| Early pregnancy BMI (kg/m2) | — | — | — | — | 0.06 (0.01 to 0.10) | 0.014 |
1Birth weight was classified according to the international foetal and newborn growth consortium for the 21st Century (Intergrowth-21st) curves. 2Linear regression coefficient.3p-value refers to the linear regression. Notes: Intercept variables represent the prediction of the mean exposure level, i.e. biomarkers concentrations when the gestational age was zero and the slope variables represent the trend of change in concentrations during pregnancy. Model 1 included lipid, leptin and adiponectin intercepts and slopes variables; Model 2 was additionally adjusted for women’s age, education, parity, smoking habit, pre-pregnancy practice of leisure time physical activity, pre-pregnancy energy intake, glycaemia and gestational weight gain. Model 3 was additionally adjusted for early pregnancy body mass index. Abbreviations: CI = confidence interval; HDL-c = high-density lipoprotein; LDL-c = low-density lipoprotein; LTPA = leisure time physical activity.
We did not find significant interactions between maternal BMI and lipids, leptin or adiponectin on BW z-score or LGA births in crude or adjusted models (data not shown in tables).
Discussion
This study has two main findings. First, the HDL-c rate of change during pregnancy was negatively associated with BW z-score and the delivery of LGA newborns, whereas the pregnancy baseline log leptin concentrations, but not the rate of change, were positively associated with these outcomes. Secondly, the LDL-c rate of change over time was positively associated with BW z-score. We did not observe significant associations between gestational changes of log TG and log adiponectin and BW z-score or LGA births in the adjusted models. Moreover, BMI was not an effect modifier of the associations of lipids and leptin with BW z-score and LGA births in our sample.
One limitation of this study was the lack of an oral glucose tolerance test to diagnose gestational diabetes mellitus (GDM), which is strongly associated with BW24–26. Thirteen women reported a diagnosis of GDM during pregnancy (6.4%). We compared the analyses with and without these women and found no significant changes in the results. Furthermore, all the adjusted models were controlled for fasting glucose. Multiple regression models were additionally adjusted for other established confounders such as early pregnancy BMI, gestational weight gain (GWG) and smoking habit3, 5, 7, 27. A large number of statistical comparisons were carried out, but no adjustments were made for multiple comparisons. This is also a limitation of our study, as it inflates the likelihood of Type I errors. The small number of cases of LGA can be considered another limitation of the study. However, even with a modest sample size, we were able to find statistically significant associations, indicating a stronger relationship between lipids and log leptin and BW z-score/LGA. We only measured total adiponectin in our study. Therefore, the lack of information regarding the high-molecular-weight (HMW) adiponectin, which is the form that has been reported as more strongly correlated to many outcomes such as diabetes and cardiovascular disease28–30, limits our conclusions regarding the effect of adiponectin in BW. The measurement of lipid, leptin and adiponectin concentrations during all three trimesters of pregnancy is a strength of this study. Furthermore, BW z-score and LGA were calculated using a population-based international growth curve that has evaluated 20,486 women and their newborns in eight geographically defined urban populations, including Brazil31. The study design enabled us to better understand the relationship between the metabolic changes in maternal biomarkers and infant BW. The use of a two-stage procedure32 to model the association between time-dependent exposures and a non-time-varying outcome was also a strength of this study. This procedure considers that the repeated measures are correlated, accounts for different rates of change in the exposures and uses their longitudinal predictions to evaluate the association with the outcome.
The HDL-c rate of change during pregnancy was inversely associated with BW z-score and the delivery of LGA newborns. In a case-control study, Kramer et al.33 also found that HDL-c concentrations were inversely associated with BW, i.e., women who delivered SGA infants had higher concentrations of HDL-c compared to women who delivered AGA infants. Misra et al.14 evaluated the association between HDL-c concentrations at 10–14, 16–20, 22–26 and 32–36 gestational weeks and BW in 143 American women stratified for pre-pregnancy BMI. The authors found an inverse and statistically significant association at all time points, but only in overweight/obese women. Misra et al.14 also tested the influence of time-dependent changes in maternal serum HDL-c on BW and concluded that the trajectory of HDL-c change over time was not significantly associated with BW in any BMI category.
In our theoretical model, maternal BMI was considered a possible confounder of the relation between maternal biomarkers (lipids, leptin and adiponectin) and BW since BMI is associated with both exposures and outcome. Previous publications also tested BMI as an effect modifier of the relation between maternal lipids and BW14. To test if BMI had the same effect in our sample, we carried out regression models including interaction terms between lipids, leptin and adiponectin (intercept and slope) with early pregnancy BMI. In contrast to Misra et al.14, we did not find significant interactions in crude or adjusted models between BMI with any of the maternal biomarkers on BW. The difference observed between the two studies can be attributed to BW classifications and the statistical procedure adopted.
We observed that the rate of maternal LDL-c change during pregnancy was positively associated with BW z-score. Although some previous studies did not report this association6, 14, 17, Pecks et al.34 found that the mean LDL-c concentrations were lower in mothers of term (n = 5) and preterm (n = 10) intrauterine growth restricted newborns compared with term (n = 5) and preterm (n = 10) controls, respectively. The association reached statistical significance only between preterm groups. Merzouk et al.35 found that obese women who gave birth to macrosomic newborns had significantly higher concentrations of LDL-c than those who delivered newborns with a healthy weight.
We performed additional analyses to understand if the results of the present study remained the same when only the AGA subsample was considered. When LGA and SGA cases were simultaneously removed from the analysis, LDL-c and HDL-c lost the significant association with BW z-score. However, when only SGA cases were removed, HDL-c remained significantly associated. When only LGA cases were excluded, only LDL-c remained significantly associated with BW z-score. These analyses revealed that the associations between lipids and BW z-score were partially driven by the extremes of the BW distribution.
Cholesterol is essential for foetal development; it is part of cell membranes, necessary for activation of various signalling pathways and a precursor of steroid hormones. Although most of foetal cholesterol is endogenously obtained by de novo synthesis in the liver, there is evidence that maternal cholesterol (exogenous source) crosses the placenta and is important for foetal growth and impacts metabolic function of extraembryonic foetal tissues10, 36. Little is known about the biological mechanism by which maternal cholesterol affects BW, but it seems to include altered sterol hormone metabolism and impaired cell cycle and signalling of growth factors (including insulin) and is indirectly by affecting placental transport of nutrients12, 13, 36. This mechanism may be involved in the positive association between LDL-c and BW; however, it does not fully explain the inverse association between HDL-c and BW and LGA. We suppose that it may also be related to its antioxidant and anti-inflammatory properties37.
We did not find significant associations between maternal serum concentrations of TG and BW or LGA births, in line with results from Retnakaran et al.17 and Crume et al.38. TG concentrations are known to affect foetal growth in women who have gestational diabetes16, 39; however, in studies with non-diabetic women, it seems not to have the same impact on BW40.
We found a positive association between log leptin pregnancy baseline concentrations (intercept) and LGA births and no association between log leptin rate of change during pregnancy and BW z-score or LGA. Experimental studies have indicated a role of leptin in the regulation of the transfer of amino acids and lipids through the placenta41, 42; however, the literature remains contradictory, and there is no consensus regarding the association between leptin concentrations and infant BW in humans. Our findings are in line with a study by Shrof et al.23, which evaluated 1,304 American women and found that those who delivered LGA neonates had higher leptin concentrations than women who delivered term AGA neonates. Franco-Sena et al.43 evaluated 195 women between 8 and 13 weeks of gestation and found an association between lower concentrations of leptin and a higher risk of SGA. However, other authors have identified an inverse association between leptin concentrations and BW or LGA17 or did not find a significant association44. One possible explanation for these contradictory results is the difference in sample size or in the times of leptin assessment between these studies.
We did not find significant associations between total adiponectin and BW z-score or LGA births. Ong et al.28 also did not find significant associations between total adiponectin and BW in a sample of 58 women of Caucasian descent with singleton pregnancies. However, they found a borderline significant association between HMW adiponectin and BW and a significant inverse association between the ratio of HMW to total adiponectin and BW (β = −19.2; p = 0.018). In contrast, Retnakaran et al.17 found a significant inverse association between total adiponectin in the third trimester and BW in a sample of 422 women without GDM. Although we did not find statistically significant associations between total adiponectin and BW, we observed the same trend reported by Retnakaran et al.17. We hypothesize that the lack of association observed in our study and in the one conducted by Ong et al.28 could be attributed to the sample sizes.
This prospective study of low-income women found that maternal HDL-c and LDL-c rates of change during pregnancy were associated with BW z-score, even after adjusting for important confounders such as maternal early pregnancy BMI, GWG and fasting glucose. We also observed that leptin concentrations were positively associated with LGA births. The association between HDL-c and log leptin with LGA births persists even when we enter both variables in the fully adjusted model. There are no established gestational cut-off points for the assessment of lipid concentrations, so any alteration is considered a physiological adaptation of pregnancy. However, our results indicate that lipids and leptin are important to foetal growth and that in the future, the evaluation of lipid changes and leptin concentrations during pregnancy may be used as an additional strategy to screen women at risk of delivering LGA newborns. Although we found relevant associations, additional studies exploring these relationships in different populations and with lager sample sizes are needed to propose specific cut-off points.
Methods
Setting and participants
We conducted a prospective cohort study in pregnant women at a municipal health centre in Rio de Janeiro, Brazil from November 2009 to June 2012. Eligibility criteria were: age between 20 to 40 years and pregnancy between 5 and 13 completed weeks of gestation, with no known chronic non-communicable diseases (except obesity).
Women were studied at three time points during pregnancy: weeks 5–13 [median (IQR) = 9.4 (7.8; 11.3)], 20–26 [median (IQR) = 23.4 (22.1; 24.4)], and 30–36 [median (IQR) = 31.8 (30.4; 33.8)] and at a fourth visit between 30 and 45 days post-partum. A total of 322 women were invited to participate and 299 were enrolled in the study. After baseline clinical evaluation 50 women were excluded for the following reasons: a confirmed pre-pregnancy diagnosis of chronic non-communicable diseases, including women with fasting glucose values ≥126 mg/dL at the 1st trimester (n = 12); the presence of infectious or parasitic diseases (n = 9); twin pregnancy (n = 4); and miscarriage (n = 25). We further excluded women with missing values for BW or gestational age at birth (n = 24), with baseline underweight (BMI < 18.5 kg/m²; n = 4) and women with no lipid measurements at the first trimester (n = 22). The baseline sample comprised 199 pregnant women. Thirteen women reported a diagnosis of GDM during pregnancy (6.5%), and two developed hypertension (>140 and/or >90 mmHg systolic and diastolic respectively) during pregnancy.
Measurements
BW (g) was obtained from the child vaccination booklet at the post-partum interview. We also evaluated BW z-score for gestational age and sex according to the international foetal and newborn growth consortium for the 21st Century (Intergrowth-21st) curves31. We classified newborns as LGA when the BW, according to the gestational age and sex-specific Intergrowth-21st curves, was above the 90th percentile and as SGA when it was below the 10th percentile.
The gestational age was calculated based on data from the first ultrasonography examination if it was performed prior to 24 weeks of gestation (n = 189; 95.0%). In cases where this measure was unavailable, the date of the last menstrual period was used (n = 10; 5.0%). The gestational age at delivery was calculated based on the date of birth reported at the post-partum visit.
During each trimester of pregnancy, a nurse technician collected two fasting blood samples (2.5 mL) from each woman in vacutainer tubes containing EDTA or separator gel. The samples were centrifuged (5 minutes, 5031 g), and the serum and plasma were immediately stored at −80 °C.
Serum samples were analysed at the Faculty of Pharmacy Clinical Analysis Laboratory (Rio de Janeiro Federal University) for total cholesterol (TC; mg/dL), HDL-c (mg/dL) and TG (mg/dL) by using the enzymatic colorimetric method and an automated analyser (Labmaxplenno®, LabtestDiagnóstica, Minas Gerais, Brazil) and commercial kits (LabtestDiagnóstica). LDL-c (mg/dL) was calculated as follows: TC - HDL-c - (TG/5)45.
Plasma leptin (ng/mL) and total adiponectin (µg/mL) concentrations were measured during the three pregnancy trimesters using commercial ELISA kits (Millipore, St. Charles, Missouri, USA), with sensitivities of 0.50 ng/dL and 0.78 µg/mL, respectively.
Maternal characteristics recorded at baseline included age (years), monthly per capita family income (US$), education (years of schooling), current smoking habits (no or yes), alcohol consumption (no or yes), parity (0 or ≥1 parturitions), and pre-pregnancy LTPA (no or yes). The sex of the newborn (male or female) was reported in the post-partum questionnaire.
Maternal body weight (kg) was obtained using a digital scale (Filizzola PL 150, FilizzolaLtda, Brazil). Height was measured twice, using a portable stadiometer at baseline (Seca Ltd., Hamburgo, Germany). Early pregnancy BMI [weight (kg)/height (m)2] was calculated based on first trimester weight and height. The cutoff point proposed by the Institute of Medicine46 was used to classify the women during early pregnancy as normal weight (18.5 to 24.9 kg/m2) or as overweight/obese (≥25.0 kg/m2). Anthropometric measures were collected according to standardized procedures and performed by trained interviewers47.
GWG (kg) was calculated as the difference between the last weight measured before delivery (mean gestational age = 37.9 weeks; SD = 2.3) and the first trimester weight (mean gestational age = 9.6 weeks; SD = 2.2).
Fasting glucose (mg/dL) was measured in all pregnancy trimesters using the glucose oxidase-peroxidase enzymatic colorimetric method and a Wiener Lab kit (Rosario, Argentina).
Total energy intake was assessed using a semi-quantitative food frequency questionnaire (FFQ) validated for the adult population of Rio de Janeiro48. The FFQ was composed of 81 food items, eight frequency options and household measure portion options. The FFQ was administered at the first gestational trimester (5–13 weeks of gestation) and referred to food intake 6 months prior to pregnancy. For statistical analysis, frequency options were transformed into daily frequencies and household measures into grams (g) or milliliters (ml)49. The daily amount consumed (g or ml/day) of each food item was obtained by multiplying the daily frequency (3x/day; 2 to 3x/day; 1x/day; 5 to 6x/week; 2 to 4x/week; 1x/week; 1 a 3x/month and never or almost never) per portion size. The Brazilian Food Composition Table (TACO)50 was used as the main database to determine food nutritional composition and The National Nutrient Database for Standard Reference provided by the United States Department of Agriculture51 was considered as a secondary option when a food item was not available in the TACO database.
Ethics
The research ethics committee of the Municipal Secretary of Health of Rio de Janeiro Municipality (Protocol number: 0139.0.314.000-09, approved on 13 August 2009) approved the study protocol. All participants signed a consent agreement, which was obtained freely and spontaneously, after all necessary clarifications had been provided. All ethical procedures of this study involving human beings followed the Brazilian Resolution 196/96.
Statistical analysis
General characteristics of the sample were described as the means and standard deviations (SD) for continuous variables and proportions (%) for categorical variables. Student’s unpaired t test was used to compare means, and the chi-square test was used for proportions. The mean variation (SD) between the first and the third trimester biomarkers values was calculated.
To evaluate the association between biomarker changes during pregnancy and BW z-scores and LGA, we used a two-stage method. (1) We constructed a linear mixed-effect model (LME) for each exposure (maternal lipids, leptin and adiponectin) including gestational age at sampling as fixed and random effects and estimated the best linear unbiased prediction (BLUP) of random coefficients. The predicted intercept refers to the mean lipid, leptin or adiponectin exposure level, i.e., the biomarker concentrations when the gestational age was zero, and was labelled as the pregnancy baseline concentration. The predicted slope refers to the rate in concentration changes per gestational age during pregnancy. (2) The BLUP predicted intercept and slope were simultaneously included as continuous predictors in linear and logistic regression models having BW z-score and LGA as outcomes, respectively. This approach considers that repeated measures are correlated and estimates time trends of exposure even for women with missing values across pregnancy, increasing the power of the analysis32. Since the LME model assumes that the dependent variable is normally distributed, we have log transformed variables with skewed distribution (TG, leptin and adiponectin).
The modelling process was performed in three steps. We constructed three linear (outcome: BW z-score) and three logistic (outcome: LGA) regression models to test the association between maternal biomarkers (lipids, leptin and adiponectin) and BW z-score or LGA births, reporting the regression coefficient (β) and odds ratio (OR), respectively, and their 95% confidence intervals (95% CI). In the first models, lipids, leptin and adiponectin intercept and slope variables were included together in the same model. The second models were additionally adjusted for age (years), education (years of schooling), pre-pregnancy LTPA (no/yes), smoking habit (no/yes), parity (number of parturitions), total pre-pregnancy energy intake (kcal/day), fasting glucose (mg/dL) and GWG (kg). In the third models, the early pregnancy BMI variable was added. We also tested if there was an interaction between maternal BMI and lipids, leptin or adiponectin on BW z-score and LGA births. The adjustment variables were chosen based on the biological plausibility of the association.
Since the models were adjusted for variables that could be correlated with each other, we tested the correlation between them. Variables with strong correlations (Pearson or Spearman coefficient ≥0.7) were candidates to be excluded. The TC was not included in the fully adjusted models due to its strong correlation with HDL-c and LDL-c.
We further investigated the occurrence of multicollinearity in the full models using the variance inflation factor. We predicted residuals and fitted values of the outcomes for our final models. We checked normality of the residuals and constructed two-way scatter plots between the residuals and predicted values of BW to detect outlying observations and to check the assumption of constant variability of outcomes across values of exposure (homoscedasticity) and scatter patterns of the residuals52.
Effect plots were created to present the longitudinal prediction of maternal biomarker changes during pregnancy for the total sample and according to BW categories (SGA or AGA vs. LGA). In these plots, the longitudinal prediction and 95% CI (black line and shaded area, respectively) represent the effect of gestational age and quadratic gestational age, when applicable, on maternal lipids, leptin and adiponectin. The effect plots were adjusted for age, education, smoking habit, pre-pregnancy LTPA, pre-pregnancy energy intake, glycaemia, parity, early pregnancy BMI, and gestational weight gain, but no adjustments were made for multiple comparisons.
Statistical analyses were performed using Stata Data Analysis and Statistical Software (STATA) version 12.0 (Stata Corp., College Station, Texas, USA). Values were considered statistically significant when the p-value was lower than 0.05.
Acknowledgements
The National Council for Scientific and Technological Development (CNPq), the Carlos Chagas Filho Foundation for Research Support of Rio de Janeiro State (FAPERJ) and the Medical Research Council (MRC) Newton grant funded the study. Kac G. and Da Silva A.A.M. are researchers fellow from CNPq. Farias D.R. has received scholarships from the Coordination for the Improvement of Higher Education Personnel and Franco-Sena A.B. from FAPERJ during the development of the study.
Author Contributions
All authors have made substantial contributions on analysis and interpretation of data; have drafted the article and revised it critically; have seen and approved the contents of the submitted manuscript. MSc. Farias carried out the initial analyses, drafted the initial manuscript, and approved the final manuscript as submitted. Dr. Franco-Sena, MSc. Pinto and Dr. Oliveira collected study data, carried out laboratory experiments, reviewed and revised the manuscript, and approved the final manuscript as submitted. Dr. Silva and Dr. Poston critically reviewed the manuscript, and approved the final manuscript as submitted. Dr. Kac conceptualized and designed the study, critically reviewed the manuscript, and approved the final manuscript as submitted.
Competing Interests
The authors declare that they have no competing interests.
Footnotes
Publisher's note: Springer Nature remains neutral with regard to jurisdictional claims in published maps and institutional affiliations.
References
- 1.Eriksson J, Forsen T, Tuomilehto J, Osmond C, Barker D. Size at birth, childhood growth and obesity in adult life. International journal of obesity and related metabolic disorders: journal of the International Association for the Study of Obesity. 2001;25:735–740. doi: 10.1038/sj.ijo.0801602. [DOI] [PubMed] [Google Scholar]
- 2.Hermann GM, Dallas LM, Haskell SE, Roghair RD. Neonatal macrosomia is an independent risk factor for adult metabolic syndrome. Neonatology. 2010;98:238–244. doi: 10.1159/000285629. [DOI] [PMC free article] [PubMed] [Google Scholar]
- 3.Gao W, Paterson J, Carter S, Percival T. Risk factors for preterm and small-for-gestational-age babies: a cohort from the Pacific Islands Families Study. Journal of paediatrics and child health. 2006;42:785–792. doi: 10.1111/j.1440-1754.2006.00978.x. [DOI] [PubMed] [Google Scholar]
- 4.Johnsson IW, Haglund B, Ahlsson F, Gustafsson J. A high birth weight is associated with increased risk of type 2 diabetes and obesity. Pediatric obesity. 2015;10:77–83. doi: 10.1111/ijpo.230. [DOI] [PubMed] [Google Scholar]
- 5.Avci ME, et al. Effects of maternal obesity on antenatal, perinatal and neonatal outcomes. The journal of maternal-fetal & neonatal medicine: the official journal of the European Association of Perinatal Medicine, the Federation of Asia and Oceania Perinatal Societies, the International Society of Perinatal Obstet. 2015;28:2080–2083. doi: 10.3109/14767058.2014.978279. [DOI] [PubMed] [Google Scholar]
- 6.Emet T, et al. Plasma lipids and lipoproteins during pregnancy and related pregnancy outcomes. Archives of gynecology and obstetrics. 2013;288:49–55. doi: 10.1007/s00404-013-2750-y. [DOI] [PubMed] [Google Scholar]
- 7.Orskou J, Henriksen TB, Kesmodel U, Secher NJ. Maternal characteristics and lifestyle factors and the risk of delivering high birth weight infants. Obstetrics and gynecology. 2003;102:115–120. doi: 10.1016/s0029-7844(03)00402-2. [DOI] [PubMed] [Google Scholar]
- 8.Wen LM, Simpson JM, Rissel C, Baur LA. Maternal “junk food” diet during pregnancy as a predictor of high birthweight: findings from the healthy beginnings trial. Birth. 2013;40:46–51. doi: 10.1111/birt.12028. [DOI] [PubMed] [Google Scholar]
- 9.Baardman ME, et al. The origin of fetal sterols in second-trimester amniotic fluid: endogenous synthesis or maternal-fetal transport? American journal of obstetrics and gynecology. 2012;207:e219–225. doi: 10.1016/j.ajog.2012.06.003. [DOI] [PubMed] [Google Scholar]
- 10.Baardman ME, et al. The role of maternal-fetal cholesterol transport in early fetal life: current insights. Biology of reproduction. 2013;88:24. doi: 10.1095/biolreprod.112.102442. [DOI] [PubMed] [Google Scholar]
- 11.Palinski W. Maternal-fetal cholesterol transport in the placenta: good, bad, and target for modulation. Circulation research. 2009;104:569–571. doi: 10.1161/CIRCRESAHA.109.194191. [DOI] [PubMed] [Google Scholar]
- 12.McConihay JA, Horn PS, Woollett LA. Effect of maternal hypercholesterolemia on fetal sterol metabolism in the Golden Syrian hamster. Journal of lipid research. 2001;42:1111–1119. [PubMed] [Google Scholar]
- 13.McConihay JA, Honkomp AM, Granholm NA, Woollett LA. Maternal high density lipoproteins affect fetal mass and extra-embryonic fetal tissue sterol metabolism in the mouse. Journal of lipid research. 2000;41:424–432. [PubMed] [Google Scholar]
- 14.Misra VK, Trudeau S, Perni U. Maternal serum lipids during pregnancy and infant birth weight: the influence of prepregnancy BMI. Obesity (Silver Spring) 2011;19:1476–1481. doi: 10.1038/oby.2011.43. [DOI] [PubMed] [Google Scholar]
- 15.Kulkarni SR, et al. Response to comment on Kulkarni et Al. Maternal lipids are as important as glucose for fetal growth: findings from the pune maternal nutrition study. Diabetes care 2013;36:2706–2713. Diabetes care. 2014;37:e39. doi: 10.2337/dc13-2270. [DOI] [PMC free article] [PubMed] [Google Scholar]
- 16.Whyte K, et al. Offspring birth weight and maternal fasting lipids in women screened for gestational diabetes mellitus (GDM) European journal of obstetrics, gynecology, and reproductive biology. 2013;170:67–70. doi: 10.1016/j.ejogrb.2013.04.015. [DOI] [PubMed] [Google Scholar]
- 17.Retnakaran R, et al. Effect of maternal weight, adipokines, glucose intolerance and lipids on infant birth weight among women without gestational diabetes mellitus. CMAJ: Canadian Medical Association journal = journal de l’Association medicale canadienne. 2012;184:1353–1360. doi: 10.1503/cmaj.111154. [DOI] [PMC free article] [PubMed] [Google Scholar]
- 18.Lain KY, Catalano PM. Metabolic changes in pregnancy. Clinical obstetrics and gynecology. 2007;50:938–948. doi: 10.1097/GRF.0b013e31815a5494. [DOI] [PubMed] [Google Scholar]
- 19.Hauguel-de Mouzon S, Lepercq J, Catalano P. The known and unknown of leptin in pregnancy. American journal of obstetrics and gynecology. 2006;194:1537–1545. doi: 10.1016/j.ajog.2005.06.064. [DOI] [PubMed] [Google Scholar]
- 20.Haghiac M, et al. Patterns of adiponectin expression in term pregnancy: impact of obesity. The Journal of clinical endocrinology and metabolism. 2014;99:3427–3434. doi: 10.1210/jc.2013-4074. [DOI] [PMC free article] [PubMed] [Google Scholar]
- 21.Lepsch J, et al. Serum saturated fatty acid decreases plasma adiponectin and increases leptin throughout pregnancy independently of BMI. Nutrition (Burbank, Los Angeles County, Calif.) 2016;32:740–747. doi: 10.1016/j.nut.2016.01.016. [DOI] [PubMed] [Google Scholar]
- 22.Franco-Sena AB, et al. Factors associated with prospective leptin concentrations throughout pregnancy in pregestational normal weight, overweight and obese women. Clinical endocrinology. 2015;82:127–135. doi: 10.1111/cen.12487. [DOI] [PubMed] [Google Scholar]
- 23.Shroff MR, Holzman C, Tian Y, Evans RW, Sikorskii A. Mid-pregnancy maternal leptin levels, birthweight for gestational age and preterm delivery. Clinical endocrinology. 2013;78:607–613. doi: 10.1111/cen.12029. [DOI] [PMC free article] [PubMed] [Google Scholar]
- 24.Mitanchez D, Burguet A, Simeoni U. Infants born to mothers with gestational diabetes mellitus: mild neonatal effects, a long-term threat to global health. The Journal of pediatrics. 2014;164:445–450. doi: 10.1016/j.jpeds.2013.10.076. [DOI] [PubMed] [Google Scholar]
- 25.Wendland EM, et al. Gestational diabetes and pregnancy outcomes–a systematic review of the World Health Organization (WHO) and the International Association of Diabetes in Pregnancy Study Groups (IADPSG) diagnostic criteria. BMC pregnancy and childbirth. 2012;12:23. doi: 10.1186/1471-2393-12-23. [DOI] [PMC free article] [PubMed] [Google Scholar]
- 26.Lindsay KL, et al. Longitudinal Metabolomic Profiling of Amino Acids and Lipids across Healthy Pregnancy. PloS one. 2015;10:e0145794. doi: 10.1371/journal.pone.0145794. [DOI] [PMC free article] [PubMed] [Google Scholar]
- 27.Farias, D. et al. Lipid changes throughout pregnancy according to pre-pregnancy BMI: results from a prospective cohort. BJOG: an international journal of obstetrics and gynaecology, 10.1111/1471-0528.13293 (2015). [DOI] [PubMed]
- 28.Ong GK, et al. Maternal serum adiponectin and infant birthweight: the role of adiponectin isoform distribution. Clinical endocrinology. 2007;67:108–114. doi: 10.1111/j.1365-2265.2007.02846.x. [DOI] [PubMed] [Google Scholar]
- 29.Waki H, et al. Impaired multimerization of human adiponectin mutants associated with diabetes. Molecular structure and multimer formation of adiponectin. The Journal of biological chemistry. 2003;278:40352–40363. doi: 10.1074/jbc.M300365200. [DOI] [PubMed] [Google Scholar]
- 30.Whitehead JP, Richards AA, Hickman IJ, Macdonald GA, Prins JB. Adiponectin–a key adipokine in the metabolic syndrome. Diabetes, obesity & metabolism. 2006;8:264–280. doi: 10.1111/j.1463-1326.2005.00510.x. [DOI] [PubMed] [Google Scholar]
- 31.Villar J, et al. International standards for newborn weight, length, and head circumference by gestational age and sex: the Newborn Cross-Sectional Study of the INTERGROWTH-21st Project. Lancet. 2014;384:857–868. doi: 10.1016/S0140-6736(14)60932-6. [DOI] [PubMed] [Google Scholar]
- 32.Chen YH, Ferguson KK, Meeker JD, McElrath TF, Mukherjee B. Statistical methods for modeling repeated measures of maternal environmental exposure biomarkers during pregnancy in association with preterm birth. Environmental health: a global access science source. 2015;14:9. doi: 10.1186/1476-069X-14-9. [DOI] [PMC free article] [PubMed] [Google Scholar]
- 33.Kramer MS, et al. Maternal lipids and small for gestational age birth at term. The Journal of pediatrics. 2013;163:983–988. doi: 10.1016/j.jpeds.2013.05.014. [DOI] [PubMed] [Google Scholar]
- 34.Pecks U, et al. Oxidatively modified LDL particles in the human placenta in early and late onset intrauterine growth restriction. Placenta. 2013;34:1142–1149. doi: 10.1016/j.placenta.2013.10.006. [DOI] [PubMed] [Google Scholar]
- 35.Merzouk H, Meghelli-Bouchenak M, Loukidi B, Prost J, Belleville J. Impaired serum lipids and lipoproteins in fetal macrosomia related to maternal obesity. Biology of the neonate. 2000;77:17–24. doi: 10.1159/000014190. [DOI] [PubMed] [Google Scholar]
- 36.Woollett LA. Review: Transport of maternal cholesterol to the fetal circulation. Placenta. 2011;32(Suppl 2):S218–221. doi: 10.1016/j.placenta.2011.01.011. [DOI] [PMC free article] [PubMed] [Google Scholar]
- 37.Ansell BJ, Watson KE, Fogelman AM, Navab M, Fonarow GC. High-density lipoprotein function recent advances. Journal of the American College of Cardiology. 2005;46:1792–1798. doi: 10.1016/j.jacc.2005.06.080. [DOI] [PubMed] [Google Scholar]
- 38.Crume TL, et al. Maternal fuels and metabolic measures during pregnancy and neonatal body composition: the healthy start study. The Journal of clinical endocrinology and metabolism. 2015;100:1672–1680. doi: 10.1210/jc.2014-2949. [DOI] [PMC free article] [PubMed] [Google Scholar]
- 39.Schaefer-Graf UM, et al. Maternal lipids as strong determinants of fetal environment and growth in pregnancies with gestational diabetes mellitus. Diabetes care. 2008;31:1858–1863. doi: 10.2337/dc08-0039. [DOI] [PMC free article] [PubMed] [Google Scholar]
- 40.Schaefer-Graf UM, et al. Differences in the implications of maternal lipids on fetal metabolism and growth between gestational diabetes mellitus and control pregnancies. Diabetic medicine: a journal of the British Diabetic Association. 2011;28:1053–1059. doi: 10.1111/j.1464-5491.2011.03346.x. [DOI] [PubMed] [Google Scholar]
- 41.Lager S, Powell TL. Regulation of nutrient transport across the placenta. Journal of pregnancy. 2012;2012:179827. doi: 10.1155/2012/179827. [DOI] [PMC free article] [PubMed] [Google Scholar]
- 42.Mousiolis AV, Kollia P, Skentou C, Messinis IE. Effects of leptin on the expression of fatty acid-binding proteins in human placental cell cultures. Molecular medicine reports. 2012;5:497–502. doi: 10.3892/mmr.2011.686. [DOI] [PubMed] [Google Scholar]
- 43.Franco-Sena AB, Goldani MZ, Tavares do Carmo M, Velasquez-Melendez G, Kac G. Low leptin concentration in the first gestational trimester is associated with being born small for gestational age: prospective study in Rio de Janeiro, Brazil. Neonatology. 2010;97:291–298. doi: 10.1159/000255160. [DOI] [PubMed] [Google Scholar]
- 44.Tamura T, Goldenberg RL, Johnston KE, Cliver SP. Serum leptin concentrations during pregnancy and their relationship to fetal growth. Obstetrics and gynecology. 1998;91:389–395. doi: 10.1016/S0029-7844(97)00670-4. [DOI] [PubMed] [Google Scholar]
- 45.Friedewald WT, Levy RI, Fredrickson DS. Estimation of the concentration of low-density lipoprotein cholesterol in plasma, without use of the preparative ultracentrifuge. Clinical chemistry. 1972;18:499–502. [PubMed] [Google Scholar]
- 46.IOM. in Weight Gain During Pregnancy: Reexamining the GuidelinesThe National Academies Collection: Reports funded by National Institutes of Health (ed K. M. Rasmussen & A. L. Yaktine) (2009). [PubMed]
- 47.Lohman, T. G., Roche, A. F. & Martorell, R. Anthropometric standardization reference manual. (Human Kinetics Books, 1988).
- 48.Sichieri R, Everhart JE. Validity of a Brazilian food frequency questionnaire against dietary recalls and estimated energy intake. Nutrition Research. 1998;18:10. doi: 10.1016/S0271-5317(98)00151-1. [DOI] [Google Scholar]
- 49.Pinheiro, A. B. V., Lacerda, E. M. A., Benzecry, E. H., Gomes, M. C. S. & Costa, V. M. Tabela para avaliação de consumo alimentar em medidas caseiras. 5th edn. (Atheneu, 2004).
- 50.NEPA–UNICAMP. TACO - Tabela Brasileira de Composição de Alimentos. 4 edn, 161 (Núcleo de Estudos e Pesquisas em Alimentação, 2011).
- 51.USDA. USDA National Nutrient Database for Standard Reference. 24 edn (United States Department of Agriculture, Agricultural Research Service, 2011).
- 52.Pagano, M. & Gauvreau, K. Principles of biostatistics. 2nd edn (Duxbury, 2000).