Abstract
The tuberous sclerosis complex 1/2 (TSC1/2) is an endogenous regulator of the mechanistic target of rapamycin (mTOR). While mTOR has been shown to play an important role in health and aging, the role of TSC1/2 in aging has not been fully investigated. In the current study, a constitutive TSC1 transgenic (Tsc1 tg) mouse model was generated and characterized. mTORC1 signaling was reduced in majority of the tissues, except the brain. In contrast, mTORC2 signaling was enhanced in Tsc1 tg mice. Tsc1 tg mice are more tolerant to exhaustive exercises and less susceptible to isoproterenol-induced cardiac hypertrophy at both young and advanced ages. Tsc1 tg mice have less fibrosis and inflammation in aged as well as isoproterenol-challenged heart than age-matched wild type mice. The female Tsc1 tg mice exhibit a higher fat to lean mass ratio at advanced ages than age-matched wild type mice. More importantly, the lifespan increased significantly in female Tsc1 tg mice, but not in male Tsc1 tg mice. Collectively, our data demonstrated that moderate increase of TSC1 expression can enhance overall health, particularly cardiovascular health, and improve survival in a gender-specific manner.
Introduction
mTOR is a central regulatory component for cell growth, proliferation, and cell size1. Through the interaction with a complex network of signaling pathways, mTOR regulates a wide spectrum of biological processes, including autophagy, protein translation, metabolism, appetite, energy, stress responses, and inflammatory response/immunity. The pivotal role of mTOR in health is reflected in the fact that deregulation of mTOR is associated with the development of many diseases, including inflammation, cancer, cardiac hypertrophy, and diabetes2, 3. Inhibition of mTOR signaling through either genetic or pharmaceutical approaches has been shown to slow aging in a variety of biological species4–16, indicating that mTOR is an important modulator of aging17.
mTOR exists in two complexes in mammalian cells, mTORC1 and mTORC2 (mTOR complex 1 and 2), with distinct roles in the regulation of biological processes18, 19. mTORC1, which is sensitive to the drug rapamycin, regulates ribosome biogenesis, protein translation and autophagy by phosphorylation of downstream targets, including S6K1, 4EBP1, and ULK120. mTORC2, which is less sensitive to rapamycin, regulates the cytoskeleton and metabolism through the phosphorylation of a set of targets distinct from mTORC1, including AKT, PKCα, and SGK1.
mTORC1 is negatively regulated by a critical upstream inhibitor complex, the TSC1/2 complex21. Mutation of TSC1 or TSC2 leads to tuberous sclerosis, an autosomal-dominant genetic disease with the formation of benign tumors in multiple organ systems associated with hyperactivation of mTOR signaling22. TSC1/2 complex inhibits specifically mTORC1 by stimulating the conversion of a mTORC1 activator Rheb from an active form Rheb-GTP to an inactive form Rheb-GDP23. Interestingly, TSC1/2 has also been found to physically interact with and activate mTORC2, independent of Rheb24. TSC1/2 has been described as a molecular switchboard for multiple signals to activate or inhibit mTORC1 activity21, including growth hormone (insulin-IGF-Akt pathway), stresses (ERK/RSK), energy (the AMPK pathway), hypoxia (Redd1), and cytokines (IKKβ/NFκB). Because of its important role in mTOR signaling, animal models with TSC1/2 deletion or overexpression could be very useful for further understanding the role of mTOR signaling in different diseases and in aging. Previous study demonstrated that overexpression of TSC1 or TSC2 increased lifespan in Drosophila12. However, transgenic mammalian models of TSC1/2 have not been reported in aging studies, although a mouse model with muscle-specific overexpression of TSC1 or TSC2 has been reported to develop muscle atrophy, depending on the levels of transgene expression25. Besides its involvement in mTOR signaling, TSC1/2 has also been reported to function independently of mTOR26. It is therefore important to know the role of TSC1/2 in health and aging in both mTOR-dependent and –independent manner.
To help understand the role of TSC1/2 in health and aging, we initiated a study to establish a TSC1 transgenic mouse model, which was designed to overexpress a human TSC1 full length gene ubiquitously. Our study found that Tsc1 tg mice exhibit alterations in multiple signaling pathways and biological processes that are associated with the mTOR-TSC1/2 axis, improvements in overall health, and specifically in females an improvement of survival.
Results
Generation of TSC1 transgenic mice
Transgenic mice with hTSC1 expression were generated using the construct described in the materials and methods section (Fig. 1a). The integration of the transgene of hTSC1 was first confirmed in the founders and its offspring by detecting hTSC1 DNA using genomic DNA isolated from the tail of transgenic mice. As shown in Fig. 1b, the presence of the lower band which is specific for hTSC1 confirms the presence and transmission of hTSC1 gene in transgenic mice (the top band is the endogenous mouse TSC1). The expression of hTSC1 gene was subsequently confirmed by western blot analysis using TSC1 specific antibody. As shown in Fig. 1c, the expression of TSC1 protein increased approximately 30% in multiple tissues from Tsc1 tg mice, including the heart, kidney, liver, and skeletal muscle. However, due to high levels of endogenous mouse TSC1 expression, the level of hTSC1 protein expression did not significantly altered the overall TSC1 protein pool in the brain of transgenic mice. Noticeably, the much higher level of endogenous TSC1 protein in adult mouse brain relative to other tissues is similar to what has been reported in human tissues27. The relatively small increase of TSC1 in the brain did not significantly affect downstream signaling and brain function as described in later sections of this report. The hTSC1 protein was still detectable in aged Tsc1 tg mice (24–30 months of age) (liver and heart shown in, detected using a hTSC1-specific antibody), indicating a persistent expression of hTSC1 transgene in transgenic mice during aging.
Figure 1.
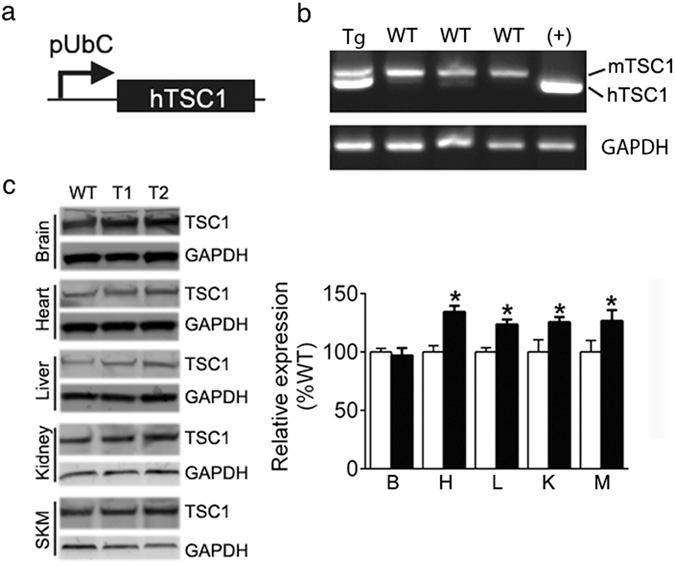
Generation of Tsc1 tg mice. (a) Diagram of DNA construct used for generating hTSC1 transgenic mice. pUbC: ubiquitin C promoter. (b) Detection of hTSC1 transgene by PCR using genomic DNA isolated from the tail of one of the founder lines. Tg – hTSC1 transgenic founder #1; WT – wild type pups; (+) – positive control DNA for hTSC1. (c) Quantification of TSC1 protein expression in different tissues of Tsc1 tg mice using western blot (n = 6 mice/group). B – brain; L – liver; H – heart; K – kidney; M – skeletal muscle. The asterisks indicate statistical significance between Tsc1 tg and wild type mice (*p < 0.05).
Phenotyping of Tsc1tg mice
A high incidence of infant/newborn death was observed in Tsc1 tg mice, with the survival rate of newborns around 50%. We suspect that the levels of hTSC1 transgene expression may be high in these groups of neonates, leading to the abnormally high neonatal death rate. We then performed quantitative real-time PCR analysis of hTSC1 transcription in the neonates. We found that the levels of hTSC1 mRNA were indeed significantly higher in a subpopulation of the dead neonates that were examined in this study (Figure S2A).
The breeding is successful and the litter size is not different from wild type mice (Supplemental Figure S2B). The average litter size is 4–5 for the following different breeding schemes: crossing wild male with transgenic female, or crossing transgenic male to wild type female, or crossing transgenic male to transgenic female mice. The average frequency of births is about one per month for all the aforementioned breeding schemes. The gender ratio of the offspring is normal (close to 1:1). When using homozygous male Tsc1 tg mice to breed with wild type female mice or vice versa, the frequency of hemizygous Tsc1 tg mice is close to 50%, indicating a normal Mendelian ratio in the transgene inheritance.
The surviving Tsc1 tg pups developed without obvious gross abnormality. The body weight and body composition was similar between wild type and Tsc1 tg mice at younger ages in both sexes. However, female Tsc1 tg mice had a small but significant reduction of lean body mass and increase of fat mass (as a percentage of body weight) at advanced ages (>20 months) than age-matched wild type control littermates (Fig. 2a). Male Tsc1 tg mice, however, display no significant difference from age-matched wild type mice in body composition at any ages.
Figure 2.
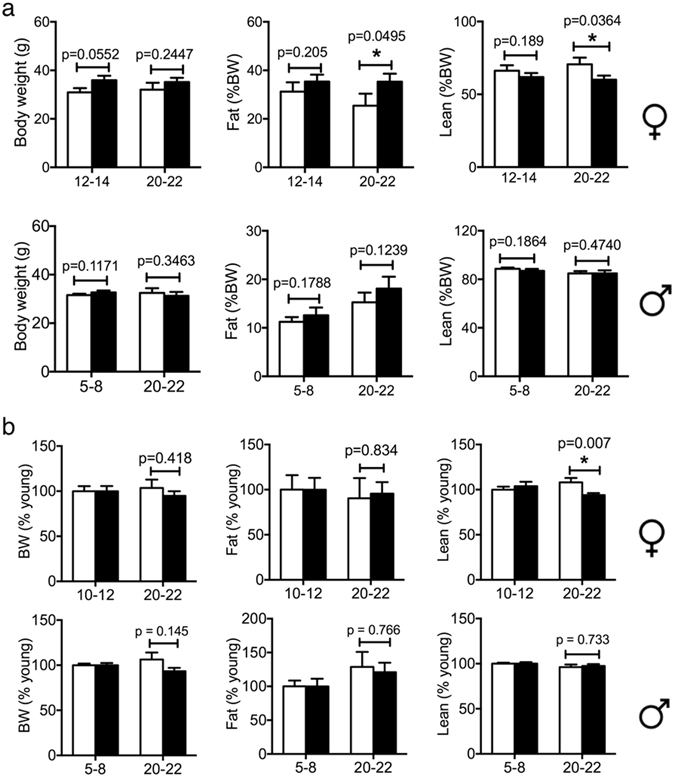
Body weight and composition. Body weight and composition of mice at different ages (specified in the figure) were determined using magnetic resonance imaging approach as described in the method section. (a) Body weight, lean and fat mass to body weight ratio. (b) Body weight, lean and fat mass normalized to young mice with the same gender and genotype. Male: 5–8 m mice, n = 17 for WT, n = 13 for TSC1 tg; 20–22 m mice, n = 18 for WT, n = 10 for TSC1 tg. Female: 12–14 m mice, n = 14 for WT, n = 15 for TSC1 tg; 20–22 m mice, n = 12 for WT, n = 19 for TSC1 tg. The asterisks indicate statistical significance between Tsc1 tg and wild type mice (*p < 0.05).
After normalizing the values against young mice, only significant age-associated changes between female Tsc1 tg mice and wild type mice are the lean body mass ratio (Fig. 2b). The changes of fat mass and whole body weight from young to old mice were similar between both male and female Tsc1 tg mice and wild type mice.
We further tested several behavioral and cognition parameters. No significant differences were detected between Tsc1 tg mice and age-matched wild type mice in grip strength (Figure S2C), passive avoidance (Figure S2D), and motor neuron nerve conductivity (Figure S2E).
Tsc1tg mice have moderate but significant changes in multiple signaling pathways
Because TSC1 functions as a complex with TSC2 to inhibit mTOR signaling by preventing the degradation of TSC228, we first investigated whether overexpression of TSC1 leads to stabilization of TSC2 in Tsc1 tg mice. As shown in Fig. 3a, the levels of TSC2 proteins were indeed higher in heart and liver from Tsc1 tg mice than age-matched wild type control littermates, suggesting that overexpression of TSC1 was able to stabilize TSC2 in Tsc1 tg mice. However, the level of TSC2 did not change significantly in the brain of Tsc1 tg mice.
Figure 3.
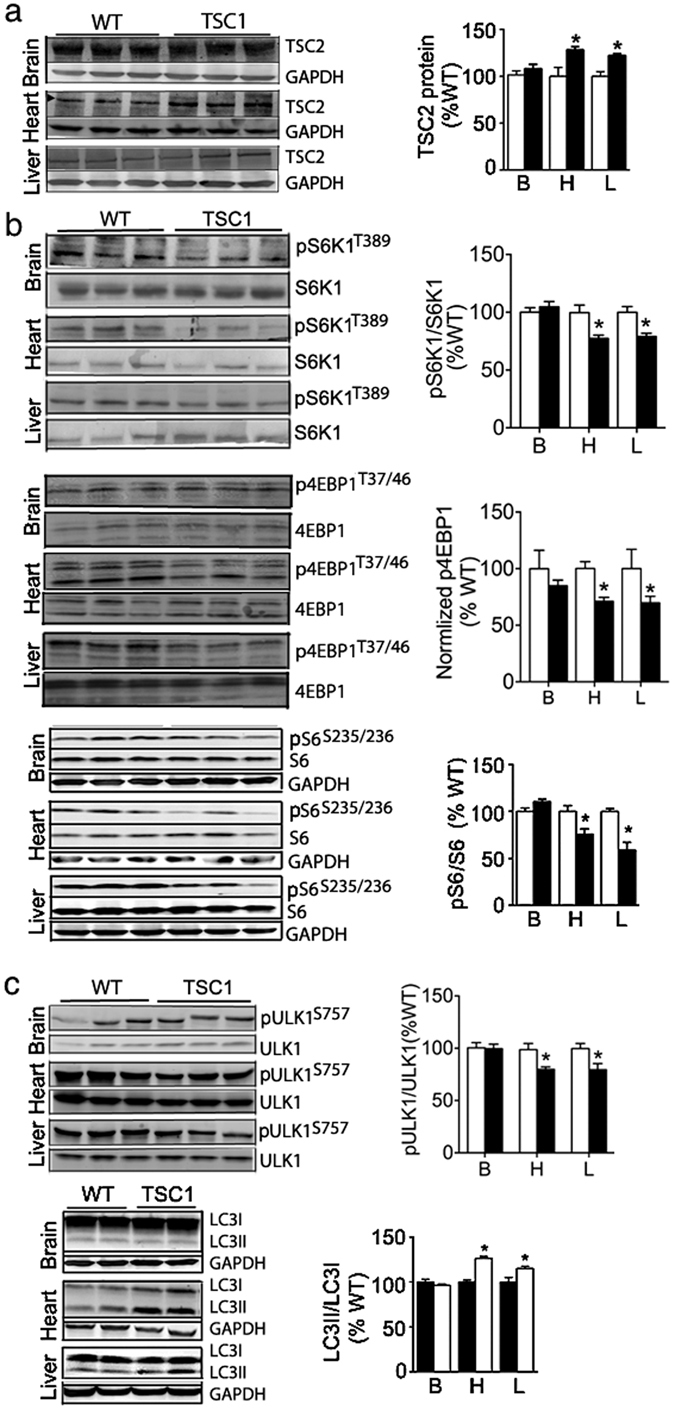
Effects of TSC1 overexpression on cell signaling. Proteins extracted from different tissues were subjected to western blot analysis as described in the methods section (n > = 6 mice at 4–6 month of age for each genotype, includes both male and female mice). (a) TSC2 protein expression in different tissues. (b) mTOR signaling was monitored as the level of phosphorylation of S6K1 (threonine 389), ULK1 (serine 757), 4EBP1 (threonine 37/46), and S6 (serine 235/236). (c) The detection of autophagy related changes: Phosphorylation of ULK1 (serine 757) and the conversion of an autophagy marker LC3 from LC3I to LC3II (LC3II/LC3I ratio). WT – wild type littermates; TSC1 - Tsc1 tg mice. B – brain; L – liver; H – heart. The band intensity was normalized to wild type mice in each group. The asterisks indicate statistical significance between Tsc1 tg and wild type mice in a specific tissue (*p < 0.05).
Next, mTORC1 signaling was investigated by quantifying the phosphorylation of three mTORC1 subunits, S6K1, ULK1 and 4EBP1, as well as ribosome subunit 6 (S6), which is a substrate for S6K129. As shown in Fig. 3b and c, the levels of phosphorylation of S6K1(T389), ULK1(S757), 4EBP1(T37/46), and S6(S235/236) decreased moderately but significantly (15–30%) in different tissues from Tsc1 tg mice, including the heart and liver. Other tissues, including the kidney, spleen and skeletal muscle also exhibit reduced phosphorylation in S6 (Figure S1A). Correlated to the reduction of mTORC1 signaling, the conversion of LC3 (LC3II/LC3I ratio), which is a marker of autophagy30, increased moderately but significantly in the heart, kidney, liver, skeletal muscle, and spleen, suggesting an enhancement of autophagy in these tissues (Figs 3c and S1B). In the brain, the mTORC1 signaling and the ratio of LC3II/LC3I were not significantly altered in Tsc1 tg mice when compared to age-matched wild type mice.
While mTORC1 signaling was reduced, the signaling pathway associated with mTORC2 appears to be enhanced in Tsc1 tg mice, indicated by the increases of the phosphorylation of AKT at serine 473 and PCKα at serine 657, which are two known substrates for mTORC231. As shown in Fig. 4, the levels of phosphorylated AKT(S473) and PKCα(S657) increased moderately but significantly in the heart, liver, and skeletal muscle of Tsc1 tg mice, suggesting an increase of mTORC2 activity. Interestingly, the phosphorylation of GSK3β at serine 9 was also increased (Fig. 4c). Because GSK3β (S9) phosphorylation is mediated by AKT, our data further support the activation of mTORC2 in Tsc1 tg mice. However, the phosphorylation of ATK at threonine 308 was no significantly affected in Tsc1 tg mice (Figure S1D).
Figure 4.
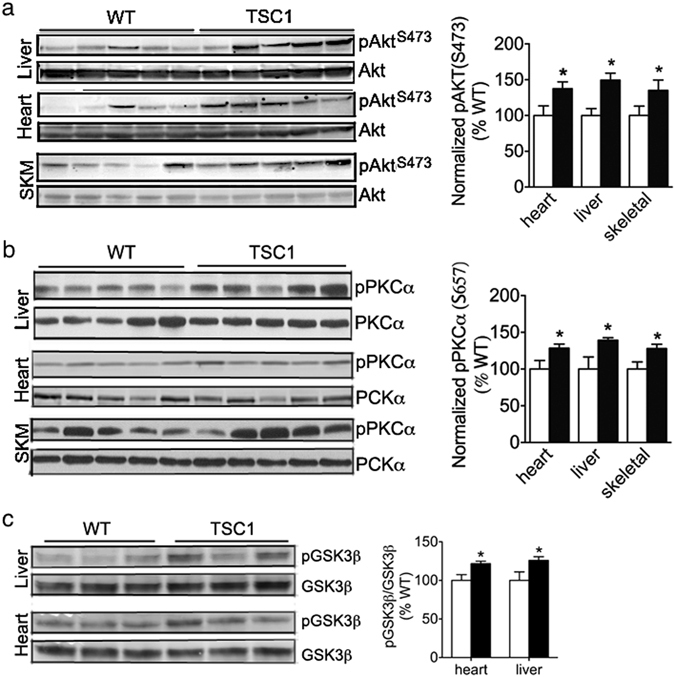
Changes of mTORC2 related signaling in TSC1 tg mice. (a) Phosphorylation of ATK at serine 473 and (b) Phosphorylation of PCKα at serine 657 in the heart, liver and skeletal muscle (SKM). (c) Phosphorylation of GSK3β at serine 9 in liver and heart. The protein band intensity was normalized to wild type mice in each group. The asterisks indicate statistical significance between Tsc1 tg and wild type mice (*p < 0.05, n = 6 for each group, includes both male and female mice).
Food consumption, glucose tolerance and insulin sensitivity
Because mTOR signaling is associated with nutrition, energy metabolism and appetite, we next determined whether reduction of mTOR in Tsc1 tg mice affected food consumption. Food consumption was measured for both male and female Tsc1 tg mice at 4–6 months of age. As shown in Figure S3, both male and female Tsc1 tg mice consumed similar amount of food per gram of body weight as that of age-matched wild type mice, indicating that a moderate reduction of mTOR signaling did not affect food consumption in young Tsc1 tg mice. At advanced ages, both male and female Tsc1 tg mice showed no alteration in the resting metabolic rate (RMR) and spontaneous activity (Supplemental Table S1) when measured at 18–20 months of age. However, during either light or dark cycle, the respiratory quotient (RQ) measured as the ratio between the volume of carbon oxide production and the volume of oxygen consumption in 18–20 month old female Tsc1 tg mice is significantly higher than age-matched wild type littermates (Supplemental Table S1), suggesting female Tsc1 tg mice preferentially utilize carbohydrate energy sources over fat. No difference was observed in male Tsc1 tg mice.
It has been reported previously that inhibition of mTOR signaling by rapamycin leads to glucose intolerance and insulin resistance32–35. We therefore compared the responses to glucose and insulin injection between Tsc1 tg and wild type mice. First, the levels of blood glucose and insulin were measured. As shown in Figure S4A and S4B, the fasting blood glucose levels are not different between either young or old Tsc1 tg mice and age-matched wild type mice. The plasma insulin level is also similar between female Tsc1 tg mice and wild type mice under normal feeding conditions at both young and advanced ages (Figure S4C). We then compared the blood glucose clearance between Tsc1 tg mice and age-matched wild type mice using GTT and ITT tests. As shown in Fig. 5a, female Tsc1 tg mice at 22–24 months of age are similar in the clearance of blood glucose as age-matched wild type mice. Young Tsc1 tg mice (4–6 month of age) also have similar responses to glucose injection as age-matched wild type mice (Figure S4D). Finally, Tsc1 tg mice have similar insulin sensitivity as age-matched wild type mice at 22–24 months of age (Fig. 5b).
Figure 5.
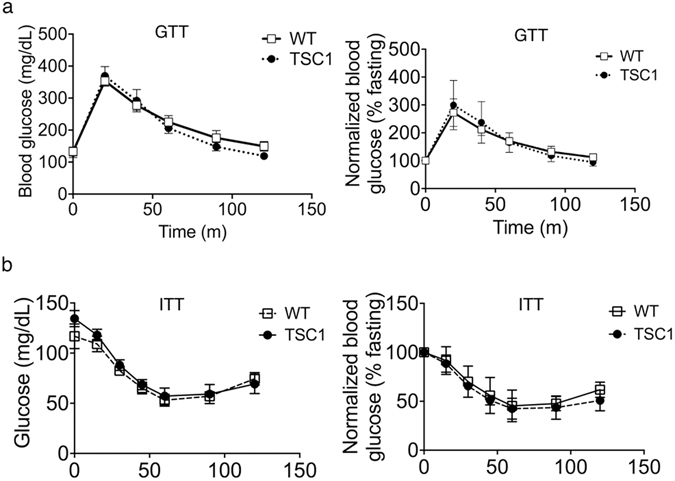
Glucose tolerance and insulin sensitivity in TSC1 tg mice. (a) Glucose tolerance test (GTT) in 22–24 month old female mice (n = 6 mice in each group). (b) Insulin sensitivity test (ITT) in female 22–24 month old mice (n = 6 mice in each group). Blood glucose was measured every 15 or 30 minutes after either glucose or insulin injection. The left graphs corresponding to each graph on the left are plotted after normalizing to the levels of blood glucose just prior to the injection. WT – wild type mice (white square); TSC1 - TSC1 tg mice (Solid black circle).
Tsc1tg mice are more tolerant to exhaustive exercise
mTOR signaling is associated with energy metabolism, hence animal physical activity and strength36. One of the aging manifestations is the decline of physical activity and strength with age37. In this study, we investigated the tolerance of Tsc1 tg mice to the treadmill exhaustive exercise running test at different ages. As shown in Fig. 6a, both male and female Tsc1 tg mice have a statistically significant increase in treadmill running capacity at both young and old ages (4–6 and 22–27 months, respectively) compared to age-matched wild type littermates. Tsc1 tg mice reached exhaustion and collapsed significantly later than age-matched wild type control mice. Blood lactate level was measured before and after treadmill running. The increase of blood lactate level in Tsc1 tg mice after exercise is significantly less than that of wild type control mice (Fig. 6b).
Figure 6.
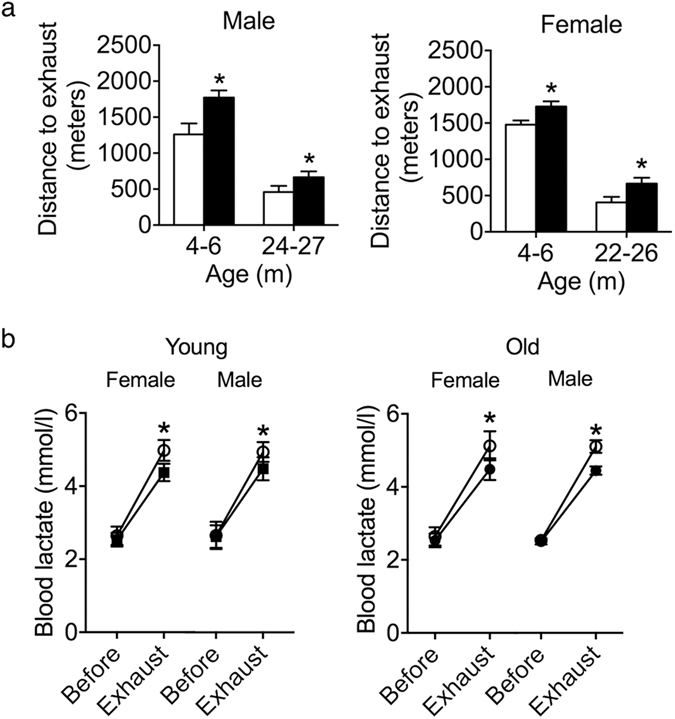
Exhaustive exercise on treadmill. (a) Running distance on treadmill till exhaustion for male and female mice at different ages (6–8, 24–27(female), 22–26 (male) months of age; n = 8 mice for each group). (b) Blood lactate levels before and after treadmill running test (n = 8 mice for each group). The asterisks indicate statistical significance between Tsc1 tg (black solid bar or circle) and wild type mice (white blank bar or circle) (*P < 0.05). WT – wild type mice; TSC1 - Tsc1 tg mice.
Tsc1tg mice are more resistant to cardiac hypertrophy
Down regulation of mTOR signaling by rapamycin has been shown to reduce the development of cardiovascular diseases such as cardiac hypertrophy38–45. We therefore tested whether increased expression of TSC1 could affect cardiac function in a similar manner. Without any challenge, the cardiac function is similar between Tsc1 tg mice and age-matched wild type littermates (data obtained from mice at 6–8 months of age, Supplemental S2). However, after challenged with isoproterenol, a compound used to induce pathological cardiac hypertrophy46, Tsc1 tg mice developed significantly less cardiac hypertrophy with better preservation of cardiac function than age-matched wild type littermates. As shown in Fig. 7a, after isoproterenol injection, female Tsc1 tg mice exhibited significantly less increases in heart size than age-matched wild type littermates at both young (6–8 month), middle (10–14 month), and advanced ages (22–24 month). Similar results were also observed in male Tsc1 tg mice. The ejection fraction is significantly smaller in Tsc1 tg mice than in wild type littermates as measured post isoproterenol challenge (data obtained from mice of 6–8 months of age were shown) (Figure S5).
Figure 7.
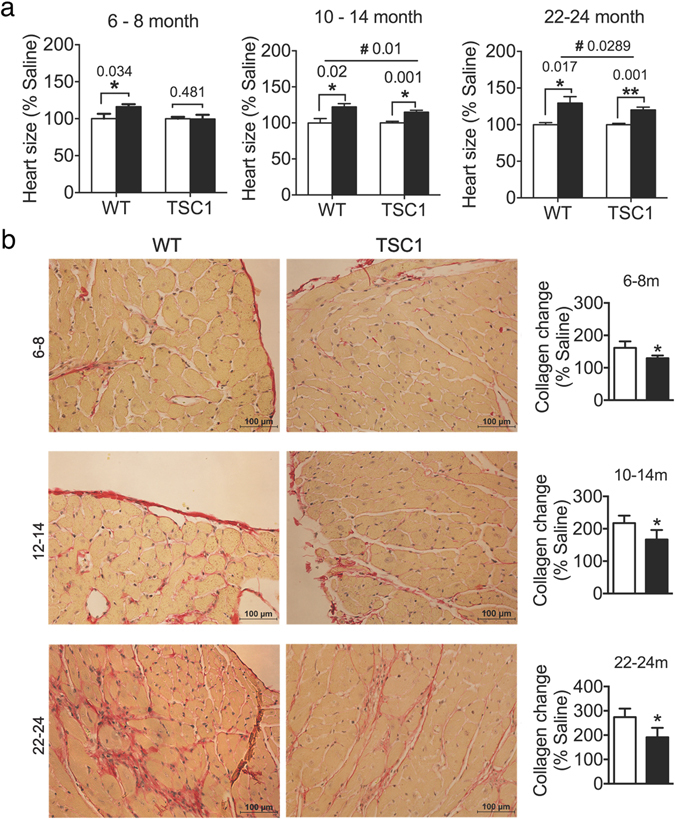
Cardiac function analysis after isoproterenol injection. (a) Heart size (ratio to body weight) in young (6–8 month, n = 8 for each group), middle aged (10–14 months, n = 8 WT, n = 12 TSC1 tg), and old (22–24 months, n = 13 WT, n = 15 TSC1 tg) female mice before and after isoproterenol challenge. White bar – mice with saline; black bar – mice with isoproterenol injection. Asterisks (*p < 0.05 and **p < 0.01) indicate statistical significance between isoproterenol injected mice and saline injected mice. Ampersand (#p < 0.05) indicates statistical significance in the degree of hypertrophy after isoproterenol injection between Tsc1 tg mice and wild type mice. (b) Histological examination of left cardiac tissue from young (6–8 month), middle aged (12–14 month), and old (22–24 month) female mice using Picrosirius Red Staining as described in the method section (n = 6 mice in each group). Collagen content changes during hypertrophy were calculated as a percentage of collagen content after isoproterenol against saline injected mice of the same genotype. Asterisks (*p < 0.05) indicate statistical significance between Tsc1 tg mice and wild type mice.
Histological examination revealed that TSC1 tg mice had significantly less fibrosis and collagen deposition in the heart after challenged with isoproterenol. As shown in Fig. 7b, the appearance of collagen fibers in the heart of female TSC1 tg mice after ISO challenge increased significantly less than that of wild type control mice in all three age groups: young (6–8 months of age), middle (10–14 months of age), and old (22–24 months of age). The changes of collagen content after ISO challenge vs. saline control in each age group was quantified, as shown in the right of the histological staining images, to reflect the quantitative difference between TSC1 tg mice and wild type control mice across different ages. These data further suggest that moderate TSC1 overexpression is beneficial to the heart against pathological hypertrophic stimulation.
Several signaling pathways involved in fibrosis and inflammation in the heart underwent changes in patterns that are significantly different between Tsc1 tg mice and wild type mice at advanced ages and after ISO challenge. As shown in Fig. 8, two extracellular matrix metalloproteinases involved in cardiac remodeling, MMP2 and MMP947, exhibit different patterns of changes between Tsc1 tg and wild type mice at 22–24 months of age. The levels of cardiac MMP2 in aged wild type mice are significantly higher than that in Tsc1 tg mice, while the levels of MMP9 remain similar between wild type and Tsc1 tg mice. After ISO challenge, MMP2 increased significantly in both wild type and Tsc1 tg mice, while MMP9 increased only significantly in wild type mice. In addition, FGF2 (Fibroblast Growth Factor 2), a growth factor involved in cardiac remodeling48, is expressed in significantly higher levels in aged wild type mice than Tsc1 tg mice. After ISO injection, FGF2 increased further in wild type mice and also increased significantly in Tsc1 tg mice. Finally, two pathways that are involved in inflammatory responses, the NFkB and Stat3 signaling pathways49, were less activated in the hearts of aged as well as ISO-challenged Tsc1 tg mice than that in wild type mice, indicated by the lower levels of phosphorylation of NFkBp65 and Stat3. Our data therefore suggest that the hearts of aged as well as ISO-challenged Tsc1 tg mice have less fibrosis and inflammation than wild type mice.
Figure 8.
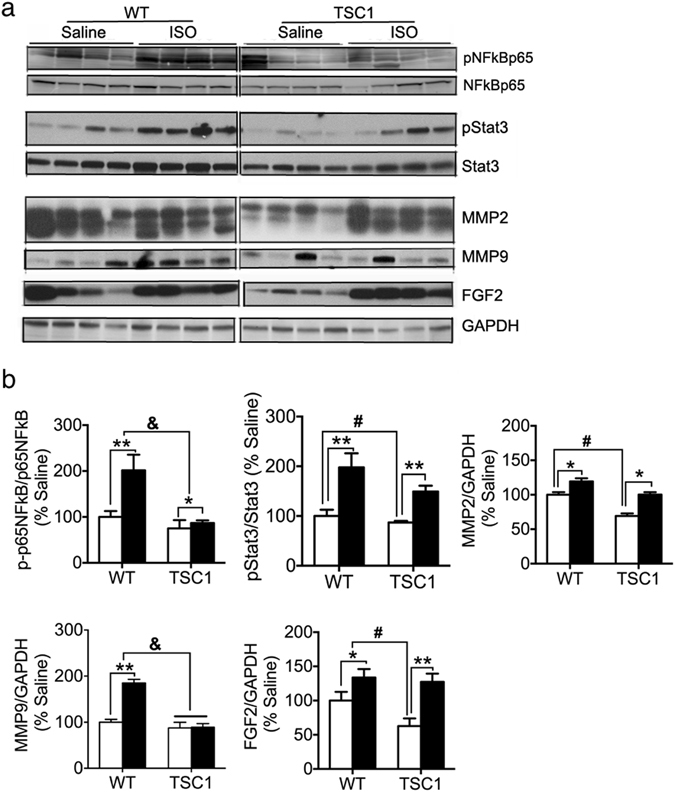
Fibrosis and inflammatory response in the heart of aged mice and the heart of mice after isoproterenol challenge. (a) Western blot analysis of NFκB, Stat3, FGF2 and MMP2/9 in heart protein extracts from old female mice (22–24 months of age, n = 6). (b) Quantification of protein band intensity (n = 6). WT – wild type mice; TSC1 - Tsc1 tg mice. White bar – saline-injected mice; black bar – isoproterenol-injected mice. Asterisks (*p < 0.05 and **p < 0.01) indicate statistical significance between isoproterenol injected and saline injected mice of the same genotype as indicated in the graph.
Survival of TSC1tg mice
A survival study was conducted using both male and female mice. As shown in Fig. 9 and Table S2, the survival is different between female and male TSC1 tg mice. The lifespan of female TSC1 tg mice is extended significantly (p = 0.028, one-sided Log-rank test), with an increase of 12.3% in median lifespan (893 vs. 795 days for TSC1 tg mice and wild type mice, respectively). However, the survival of male TSC1 tg mice is not significantly different from that of wild type mice (p = 0.195, one-sided Log-rank test), indicating a sex difference in the effect of TSC1 overexpression on lifespan extension.
Figure 9.
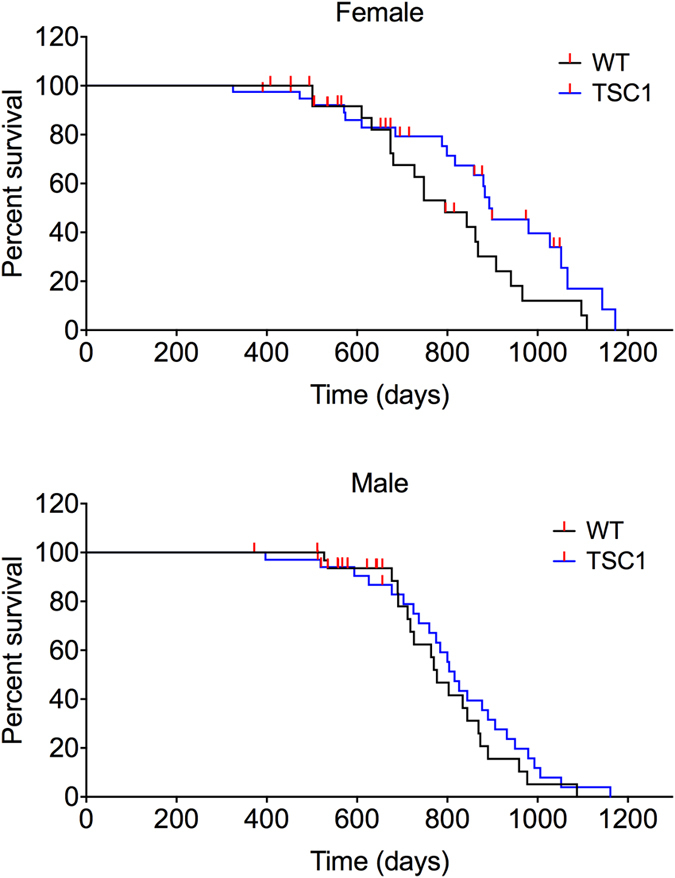
Lifespan analysis of TSC1 tg mice. Survival curves are shown for female and male mice separately (67 females: 27 and 40 for wild type and TSC1 tg mice separately; 67 males: 32 and 35 for wild type and TSC1 tg mice respectively). The survival curve for female mice is significant, while not for male mice (p = 0.0282 for female mice; p = 0.195 for male mice, determined by one sided Log-rank test analysis).
Discussion
In the current study we developed and characterized for the first time a mouse model that overexpresses TSC1 ubiquitously. Our data demonstrated that: (1) TSC1 overexpression did not lead to adverse health consequences to mice; (2) In fact, Tsc1 tg mice are more tolerant to exhaustive exercises and more resistant to cardiac hypertrophic challenge during aging than wild littermates; (3) the survival of female Tsc1 tg mice is significantly improved. These data suggest that TSC1 transgenic animal models could serve as new tools to understand the role of the TSC1/2 complex (mTOR related vs. non-mTOR related roles) in aging and age-associated diseases in vivo.
TSC1/2 is an important upstream regulator of mTOR signaling, which is a molecular switchboard for mTOR to respond to multiple signals21. Deregulated mTOR signaling has been implicated in major diseases, including cancer, metabolic disorders, neurological diseases, and inflammation3. Inhibition of mTOR using either genetic or pharmaceutical approaches has been found to extend lifespan in a wide spectrum of species from yeast to mammals6–16, 50. Previously, it has been shown that overexpression of TSC1 or TSC2 extended lifespan in Drosophila and improved cardiac function12. Our study using mouse model provide new evidence to support the notion that intervention in the gene expression of TSC1/2 complex can alter animal survival and health.
The observed gender differences in lifespan extension in Tsc1 tg mice is not surprising. In fact, it is a common phenomenon observed in many genetic and pharmacological models51. Such gender differences in lifespan extension by mTOR inhibition have been reported in different animal models. Deletion of S6K1 in mice, a downstream target of mTORC1, led to significant increase of lifespan in female but not male mice16. Heterozygous deletion of both mTOR and mLST8 in mice led to lifespan extension in female but not male mice33. Pharmacological inhibition of mTOR in mice using rapamycin revealed that rapamycin has greater effect on female lifespan than on male lifespan6, 7, 9. It will be important to understand the mechanisms underlying this gender differences in lifespan extension by the intervention of mTOR signaling.
Although earlier studies using continuous rapamycin administration had some unexpected negative effects on mice, rats or human cells, including glucose intolerance34, 35 and insulin resistance32, 33, we did not observe changes in glucose homeostasis and metabolism in Tsc1 tg mice, which is consistent with several recent studies. Wu et al.10 demonstrated that reduced mTOR expression in mice with mTOR hypomorphic alleles did not affect glucose tolerance, overall metabolic rate and energy expenditure. Lamming’s group recently demonstrated that intermittent rapamycin feeding did not alter glucose homeostasis52. Bartke’s group reported that the metabolic changes in rapamycin-fed mice was dependent on the duration of rapamycin treatment53. Insulin resistance and glucose intolerance occurred at short term rapamycin treatment (2 weeks), while insulin resistance disappeared after long term treatment (20 weeks).
Mice with rapamycin administration has also been reported to develop testicular degeneration and cataracts50. However, the male Tsc1 tg mice are fertile with similar breeding capacity as wild type mice, indicating no testicular degeneration in male Tsc1 tg mice. Interestingly, there is a noticeable difference in the survival rate of newborns between male Tsc1 tg mice and wild type mice. The neonatal death is more than 50%, which is significantly higher comparing to wild type mice with less than 30% neonatal death rate. We speculate that at least two causes led to this abnormal neonatal death rate in Tsc1 tg mice. First, the TSC1 transgene expression may be much higher in some embryos during development that leads to greater suppression of mTOR signaling. Because mTOR is critical to animal development31, the greater level of suppression of mTORC1 in the embryos may eventually lead to their demise. Second, the suppression of mTORC1 signaling may affect the mother’s nursing function (e.g., lack of enough milk for all the pups, etc.), which leads to the death of some pups. Some studies have linked mTOR signaling to milk production and lactation54, 55. Our data suggest that higher levels of hTSC1 expression during development may be one of the causes of the high neonatal death rate. Therefore, a different TSC1 transgenic animal model may serve the purpose better, such as an inducible model that expresses TSC1 or TSC2 transgene in a timely controlled manner to overcome its negative effect on development.
A previous study using rapamycin in C57BL/6 mice showed that male mice fed rapamycin experienced a reduction in whole body mass initially (from 19 to 25 months), while female mice did not9. Neither male nor female Tsc1 tg mice lose weight in our study. Interestingly, female Tsc1 tg mice have altered body composition with increased fat mass and decreased lean body mass (ratio to whole body mass) at advanced ages. The increase of fat deposit has been reported by Liu et al.56 in rapamycin- and high fat-fed male mice. However, Liu’s study did not report the effect of rapamycin on fat deposit in female mice. The cause of the gender difference in body composition in Tsc1 tg mice is unknown. It may be due to the intrinsic gender differences of mTOR signaling in different tissues with age57. The change in body composition in female Tsc1 tg mice is probably not due to food intake as being reported in mice fed rapamycin9, because we did not observe a significant difference in food consumption between Tsc1 tg mice and wild type mice. The alteration of the ratio between fat mass and lean body mass in female Tsc1 tg mice could be due to the changes of metabolism in fat usage and deposit. We further hypothesize that sex hormones may be involved in the differences between female and male Tsc1 tg mice. Nonetheless, the underlying mechanisms by which overexpression of TSC1 leads to more fat mass in female Tsc1 tg mice remains to be answered. It is worth to point out that the small gender differences did not affect the physiological outcomes tested in this study, including grip strength, motor neuron function, and cognition.
Although mTOR signaling plays an important role in cardiac development and function58, the heart appears to develop normally in Tsc1 tg mice. Reduction of mTOR signaling has been shown to be beneficial to cardiac health and aging, especially cardiac hypertrophy41–43, 59, 60. Tsc1 tg mice have increased resistance to cardiac hypertrophy challenge and are more resistant to exhaustive exercises, suggesting an improved cardiac function/health in Tsc1 tg mice. Tsc1 tg mice developed less fibrosis and inflammation in the heart during aging and when challenged with ISO, suggesting moderate TSC1 overexpression in our study improves cardiac health during aging. Our data further indicate that modulation of inflammation by TSC1 may play a very important role in aging and in cardiac response to hypertrophic stimulation. However, mTOR signaling has also been shown to be required for the protection of heart during ischemia/reperfusion (I/R) injury61, 62. Therefore, it is important to test whether reduction of mTOR signaling chronically by either genetic approaches or pharmaceutical approached will negatively affect the cardiac response to I/R injury during aging.
Although it has been shown to primarily affect the activation of mTORC1, TSC1/2 complex has also been reported to be required for proper activation of mTORC263. The present study observed a small but significant increase of the phosphorylation of two mTORC2 substrates, AKT at serine 473 and PCKα at serine 657, suggesting the enhancement of mTORC2 signaling in Tsc1 tg mice. The elevation of mTORC2 activity in Tsc1 tg mice may partially explain the resistance of Tsc1 tg mice to cardiac stresses and exhaustive exercises, which is in agreement with a recent study demonstrating that mTORC2 is required for normal cardiac function64.
It is worth to note that mTOR signaling was not altered in the brain of Tsc1 tg mice. This is due to the expression of high levels of endogenous TSC1 in the brain tissue, which wipes out the effect of exogenous TSC1 on mTOR signaling in the brain. This could be the primary reason that we did not observe any significant changes in neurological tests. This problem can be addressed using brain tissue specific overexpression of TSC1/2 with a strong promoter. Although it is unfortunate that we did not observe neurological changes in Tsc1 tg mice, this study still proves an important point that reduction of mTOR signaling in tissues other than the brain could still improve health and lifespan.
Finally, TSC1/2 complex has been found to function independently of mTOR26. Therefore, it is likely that the mTOR-independent function of TSC1/2 may also contribute to the lifespan extension and health improvement in Tsc1 tg mice. It will be of great interest to identify those mTOR-independent functions of TSC1/2 that may be involved in health and aging in future studies.
In conclusion, our study has demonstrated that overexpression of TSC1 could extend lifespan and lead to better health in mice, particularly cardiac health.
Materials and Methods
Animals
All mice were fed a standard NIH-31 chow (Teklad Diet LM485; Harlan Teklad, Madison, WI) ad libitum and maintained under barrier conditions in micro-isolator cages on a 12-h dark/light cycle. For tissue collection, animals were sacrificed by CO2 inhalation followed by cervical dislocation, and the tissues were immediately excised and placed in liquid nitrogen.
All the animal procedures performed confirm to NIH guidelines and were approved by the institute animal care and use committee (IACUC) of the University of Texas Health Science Center at San Antonio, San Antonio, Texas.
Generation of hTSC1 transgenic mice
Full-length hTSC1 cDNA (a kind gift from Dr. Kun-Liang Guan from the University of California at San Diego) was restriction digested and ligated into the mammalian expression vector pUB6-His (Invitrogen, CA) for ubiquitous expression under the control of ubiquitin C promoter (Fig. 1a). After the construct was confirmed by restriction digestion and DNA sequencing, the expression of hTSC1 protein was further determined and confirmed by transfecting in vitro tissue cultures. Transgenic mice were subsequently generated using this construct in the Transgenic Animal Model Core facility in University of Michigan. The genotypes of all offspring were determined by PCR amplification of mouse tail DNA using specific primers: 5′-TCAGTGTTAGACTAGTAAATTG-3′, and 5′-GCTGTTTCCCAGACTGTG-3′ for 35 cycles (94 °C 15 seconds, 52 °C 30 seconds, and 72 °C 50 seconds). Expression of hTSC1 in transgenic mice was determined at both transcription and protein levels using reverse transcriptional polymerase chain reaction (RT-PCR) with specific primers and western blotting analysis with TSC1 specific antibody respectively.
Body composition measurement
Body composition and food consumption of transgenic mice and wild type littermates was determined as described elsewhere65. Briefly, body composition was measured using quantitative Magnetic Resonance Imaging (EchoMRI 3-in-1 System, Houston, TX), following the manufacturer’s recommendations.
Western blot analysis
Protein expression and phosphorylation was determined by western blot analysis. Briefly, tissues were homogenized in ice-cold homogenization buffer (50 mM Tris-HCl, pH7.5, 0.5% Triton X-100) with the addition of cocktails of protease inhibitors and phosphatase inhibitors (Roche, Indianapolis, IN), followed by centrifugation at 10,000 g for 20 minutes at 4 °C. The supernatant was transferred to a new tube and protein concentration was determined using Bio-Rad protein assay reagents (Bio-Rad, CA). Equal amount of protein was separated by SDS-PAGE gel electrophoresis and transferred to nitrocellulose membrane. Individual protein was detected with species specific primary antibodies, followed by species specific secondary antibody conjugated with horse radish peroxidase (HRP). Primary antibodies used in this study are specific for: TSC1 (Cat. #4906), TSC2 (Cat. #3612), pTSC2(T1462) (Cat. #3611), S6 (Cat. #2217), pS6(Ser235/236) (Cat. #4856), 4EBP1 (Cat. #9452), p4EBP1(Thr37/46) (Cat. #9459), S6K1 (Cat. #9202), pS6K1(Thr389) (Cat. #9205), Akt (Cat. #9272), pAkt(Ser473) (Cat. #4060), pAkt(Thr308) (Cat. #9275), GSK3β (Cat. #9315), pGSK3β(Ser9) (Cat. #9336), ULK1 (Cat. #8054), Phospho-ULK1 (Ser757) (Cat. #6888), and LC3 (Cat. #2775) (all from Cell Signaling, Beverly, MA); hTSC1 (Epitomics, Cat. #1744-1; Cell Signaling, Cat. #3635); PKCα (Cat. ab32376), pPCKα(Ser657) (Cat. ab180848) (from Abcam, Cambridge, MA); GAPDH (from Santa Cruz Biotech., Dallas, Texas). The band signal was captured by a phosphor-imager (Typhoon scanner, GE, Piscataway, NJ) and quantified by the Image-Quant software (GE, Piscataway, NJ).
Glucose tolerance test (GTT) and insulin tolerance test (ITT)
GTT were performed in mice (6 mice in each group) fasted overnight. The mice were weighed next morning and the dose of glucose were calculated for each mouse. Blood glucose was measured before the injection as baseline fasting blood glucose level. Glucose (20% solution in saline) was injected intraperitoneally at a dose of 1.5 mg kg−1 body weight. Blood glucose levels were measured using hand-held glucometer (One Touch Ultra) every 15 minutes post glucose injection.
Insulin tolerance test was conducted in mice (6 mice in each group) after 6 hours fasting. Insulin (0.25 IU solution in saline) was administered intraperitoneally at a dose of 0.75 IU/g body weight. Blood glucose levels were measured at 15, 30, 40, 60, 90, and 120 minutes post insulin injection.
Insulin levels were determined in frozen plasma samples obtained from terminally sacrificed mice by ELISA following manufacturer’s instructions (Crystal Chem, Downer’s Grove, IL).
Treadmill running test
Mice were subjected to exhaustive exercise test on a treadmill as described elsewhere66. Briefly, the mice from all groups were initially acclimated to treadmill environment by performing a daily running session at 7 m/min for 15 min during three successive days (adaptation period). Then, the mice run on a treadmill to the point of exhaustion with the following protocol: the starting speed was 9 m/min; the speed was increased 2 m/min every 3 min until it reached 17 m/min; thereafter, the speed continued to increase by 1 m/min every 3 min until exhaustion. Exhaustion was defined as the point at which a mouse refused to run despite being given mild touches.
Blood lactate levels were measured using a lactate assay kit from Abcam following the manufacturer’s instruction. Blood was collected from the tail before and after exercises.
Isoproterenol-induced cardiac hypertrophy
Isoproterenol was injected peritoneally in mice at 30 mg·kg−1day−1 for 7 days. Control mice were injected with vehicle only (saline). At day 8, mice were sacrificed. The heart were perfused with saline and dissected into three parts perpendicularly: the apex tip and the aorta proximal part was flash frozen in liquid nitrogen and stored in −80 °C for protein and RNA isolation; the mid section was fixed in formalin for histological study.
Histological examination of heart tissue
Heart tissues were removed and kept in 10% formalin solution. After routine histologic procedures, they were embedded into paraffin; 4–5 μm thick sections were taken from paraffin-embedded tissues and stained with Picrosirius Red method. Briefly, the paraffin sections were de-waxed and hydrated, followed by staining the nuclei with Weigert’s haematoxylin (Sigma-Aldrich) for 8 minutes, and washing for 10 minutes in running tap water. Then the sections were stained in picro-sirius red (Sigma-Aldrich) for one hour, followed by washing in two changes of acidified water. After dehydrated in three changes of 100% ethanol, the sections were cleared in xylene and mounted in a resinous medium. The stained sections were examined under a Zeiss Axio Lab A1 light microscope (Carl Zeiss, Germany). In general, five heart sections from each mouse out of six mice in each group were examined for fibrosis and collagen content.
Animal lifespan studies
A total of 67 female mice (27 wild type, 40 Tsc1 tg mice) and 67 male mice (32 wild type, 35 Tsc1 tg mice) were used in the lifespan study. Mice were maintained in pathogen-free barrier conditions with 5 mice per cage and were permitted to live out their lives until death due to natural causes with occasional censoring of mice with severe diseases. The survival study was terminated earlier before its completion. The mice that were alive but sacrificed at the termination of the study (18 males on September 16 2014 and 8 females on September 9 2014) were considered censored. Survival data was analyzed using one-sided Log-rank test.
Statistical analysis
Data were expressed as means ± standard error. Student’s t-test or one-way ANOVA was used to compare between transgenic and wild type mice to determine statistical significances. A p-value of less than 0.05 was considered statistically significant. Survival data was analyzed using one-sided Log-rank test.
Electronic supplementary material
Acknowledgements
This work was supported by a grant from the American Federation for Aging Research (AFAR) (Y Zhang). H-M. Zhang was supported by grants from the National Natural Science Foundation of China (No. 81572699) and Science and Technology Development Program of Shaanxi province of China (2013KJXX-91). We are so grateful to Dr. Arlan Richardson (Reynolds Oklahoma Center on Aging, University of Oklahoma Health Science Center and Oklahoma City VA Medical Center, Oklahoma, OK, USA) for his support and help in this research. We are also grateful to Dr. Merry Lindsey (University of Mississippi Medical Center) for her generous support in cardiac function analysis (echocardiography).
Author Contributions
H-M.Z. and Y.Z. formulated the hypothesis, designed and performed majority of the studies, wrote and edited the manuscript. Y.Z. prepared the graphs and statistical analysis. V.D. maintained animal colony, conducted food consumption, body composition, and respirometry studies. M.W. conducted nerve conductivity velocity and passive avoidance experiments, and edited the manuscript.
Competing Interests
The authors declare that they have no competing interests.
Footnotes
Electronic supplementary material
Supplementary information accompanies this paper at doi:10.1038/s41598-017-00970-7
Publisher's note: Springer Nature remains neutral with regard to jurisdictional claims in published maps and institutional affiliations.
Contributor Information
Hong-Mei Zhang, Email: zhm@fmmu.edu.cn.
Yiqiang Zhang, Email: zhangy@uthscsa.edu.
References
- 1.Dazert, E. & Hall, M. N. mTOR signaling in disease. Current opinion in cell biology, doi:10.1016/j.ceb.2011.09.003 (2011). [DOI] [PubMed]
- 2.Tsang CK, Qi H, Liu LF, Zheng XF. Targeting mammalian target of rapamycin (mTOR) for health and diseases. Drug Discov Today. 2007;12:112–124. doi: 10.1016/j.drudis.2006.12.008. [DOI] [PubMed] [Google Scholar]
- 3.Laplante M, Sabatini DM. mTOR signaling in growth control and disease. Cell. 2012;149:274–293. doi: 10.1016/j.cell.2012.03.017. [DOI] [PMC free article] [PubMed] [Google Scholar]
- 4.Schieke SM, Finkel T. TOR and aging: less is more. Cell Metab. 2007;5:233–235. doi: 10.1016/j.cmet.2007.03.005. [DOI] [PubMed] [Google Scholar]
- 5.McCormick MA, Tsai SY, Kennedy BK. TOR and ageing: a complex pathway for a complex process. Philos Trans R Soc Lond B Biol Sci. 2011;366:17–27. doi: 10.1098/rstb.2010.0198. [DOI] [PMC free article] [PubMed] [Google Scholar]
- 6.Harrison DE, et al. Rapamycin fed late in life extends lifespan in genetically heterogeneous mice. Nature. 2009;460:392–395. doi: 10.1038/nature08221. [DOI] [PMC free article] [PubMed] [Google Scholar]
- 7.Miller RA, et al. Rapamycin-mediated lifespan increase in mice is dose and sex dependent and metabolically distinct from dietary restriction. Aging cell. 2014;13:468–477. doi: 10.1111/acel.12194. [DOI] [PMC free article] [PubMed] [Google Scholar]
- 8.Miller RA, et al. Rapamycin, but not resveratrol or simvastatin, extends life span of genetically heterogeneous mice. The journals of gerontology. Series A, Biological sciences and medical sciences. 2011;66:191–201. doi: 10.1093/gerona/glq178. [DOI] [PMC free article] [PubMed] [Google Scholar]
- 9.Zhang Y, et al. Rapamycin extends life and health in C57BL/6 mice. The journals of gerontology. Series A, Biological sciences and medical sciences. 2014;69:119–130. doi: 10.1093/gerona/glt056. [DOI] [PMC free article] [PubMed] [Google Scholar]
- 10.Wu JJ, et al. Increased mammalian lifespan and a segmental and tissue-specific slowing of aging after genetic reduction of mTOR expression. Cell Rep. 2013;4:913–920. doi: 10.1016/j.celrep.2013.07.030. [DOI] [PMC free article] [PubMed] [Google Scholar]
- 11.Vellai T, et al. Genetics: influence of TOR kinase on lifespan in C. elegans. Nature. 2003;426:620. doi: 10.1038/426620a. [DOI] [PubMed] [Google Scholar]
- 12.Kapahi P, et al. Regulation of lifespan in Drosophila by modulation of genes in the TOR signaling pathway. Curr Biol. 2004;14:885–890. doi: 10.1016/j.cub.2004.03.059. [DOI] [PMC free article] [PubMed] [Google Scholar]
- 13.Kaeberlein M, et al. Regulation of yeast replicative life span by TOR and Sch9 in response to nutrients. Science. 2005;310:1193–1196. doi: 10.1126/science.1115535. [DOI] [PubMed] [Google Scholar]
- 14.Powers RW, 3rd, Kaeberlein M, Caldwell SD, Kennedy BK, Fields S. Extension of chronological life span in yeast by decreased TOR pathway signaling. Genes Dev. 2006;20:174–184. doi: 10.1101/gad.1381406. [DOI] [PMC free article] [PubMed] [Google Scholar]
- 15.Hansen M, et al. Lifespan extension by conditions that inhibit translation in Caenorhabditis elegans. Aging Cell. 2007;6:95–110. doi: 10.1111/j.1474-9726.2006.00267.x. [DOI] [PubMed] [Google Scholar]
- 16.Selman C, et al. Ribosomal protein S6 kinase 1 signaling regulates mammalian life span. Science. 2009;326:140–144. doi: 10.1126/science.1177221. [DOI] [PMC free article] [PubMed] [Google Scholar]
- 17.Johnson SC, Rabinovitch PS, Kaeberlein M. mTOR is a key modulator of ageing and age-related disease. Nature. 2013;493:338–345. doi: 10.1038/nature11861. [DOI] [PMC free article] [PubMed] [Google Scholar]
- 18.Zoncu R, Efeyan A, Sabatini DM. mTOR: from growth signal integration to cancer, diabetes and ageing. Nature reviews. Molecular cell biology. 2011;12:21–35. doi: 10.1038/nrm3025. [DOI] [PMC free article] [PubMed] [Google Scholar]
- 19.Kennedy BK, Lamming DW. The Mechanistic Target of Rapamycin: The Grand ConducTOR of Metabolism and Aging. Cell Metab. 2016;23:990–1003. doi: 10.1016/j.cmet.2016.05.009. [DOI] [PMC free article] [PubMed] [Google Scholar]
- 20.Hsu PP, et al. The mTOR-regulated phosphoproteome reveals a mechanism of mTORC1-mediated inhibition of growth factor signaling. Science. 2011;332:1317–1322. doi: 10.1126/science.1199498. [DOI] [PMC free article] [PubMed] [Google Scholar]
- 21.Huang J, Manning BD. The TSC1-TSC2 complex: a molecular switchboard controlling cell growth. Biochem J. 2008;412:179–190. doi: 10.1042/BJ20080281. [DOI] [PMC free article] [PubMed] [Google Scholar]
- 22.Tee AR, et al. Tuberous sclerosis complex-1 and -2 gene products function together to inhibit mammalian target of rapamycin (mTOR)-mediated downstream signaling. Proc Natl Acad Sci USA. 2002;99:13571–13576. doi: 10.1073/pnas.202476899. [DOI] [PMC free article] [PubMed] [Google Scholar]
- 23.Inoki K, Li Y, Xu T, Guan KL. Rheb GTPase is a direct target of TSC2 GAP activity and regulates mTOR signaling. Genes Dev. 2003;17:1829–1834. doi: 10.1101/gad.1110003. [DOI] [PMC free article] [PubMed] [Google Scholar]
- 24.Huang J, Manning BD. A complex interplay between Akt, TSC2 and the two mTOR complexes. Biochem Soc Trans. 2009;37:217–222. doi: 10.1042/BST0370217. [DOI] [PMC free article] [PubMed] [Google Scholar]
- 25.Wan M, et al. Muscle atrophy in transgenic mice expressing a human TSC1 transgene. FEBS Lett. 2006;580:5621–5627. doi: 10.1016/j.febslet.2006.09.008. [DOI] [PubMed] [Google Scholar]
- 26.Zhu L, et al. TSC1 controls macrophage polarization to prevent inflammatory disease. Nature communications. 2014;5:4696. doi: 10.1038/ncomms5696. [DOI] [PubMed] [Google Scholar]
- 27.Plank TL, Logginidou H, Klein-Szanto A, Henske EP. The expression of hamartin, the product of the TSC1 gene, in normal human tissues and in TSC1- and TSC2-linked angiomyolipomas. Mod Pathol. 1999;12:539–545. [PubMed] [Google Scholar]
- 28.Benvenuto G, et al. The tuberous sclerosis-1 (TSC1) gene product hamartin suppresses cell growth and augments the expression of the TSC2 product tuberin by inhibiting its ubiquitination. Oncogene. 2000;19:6306–6316. doi: 10.1038/sj.onc.1204009. [DOI] [PubMed] [Google Scholar]
- 29.Hay N, Sonenberg N. Upstream and downstream of mTOR. Genes Dev. 2004;18:1926–1945. doi: 10.1101/gad.1212704. [DOI] [PubMed] [Google Scholar]
- 30.Mizushima N, Yoshimori T, Levine B. Methods in mammalian autophagy research. Cell. 2010;140:313–326. doi: 10.1016/j.cell.2010.01.028. [DOI] [PMC free article] [PubMed] [Google Scholar]
- 31.Guertin DA, et al. Ablation in mice of the mTORC components raptor, rictor, or mLST8 reveals that mTORC2 is required for signaling to Akt-FOXO and PKCalpha, but not S6K1. Dev Cell. 2006;11:859–871. doi: 10.1016/j.devcel.2006.10.007. [DOI] [PubMed] [Google Scholar]
- 32.Deblon N, et al. Chronic mTOR inhibition by rapamycin induces muscle insulin resistance despite weight loss in rats. British journal of pharmacology. 2012;165:2325–2340. doi: 10.1111/j.1476-5381.2011.01716.x. [DOI] [PMC free article] [PubMed] [Google Scholar]
- 33.Lamming DW, et al. Rapamycin-induced insulin resistance is mediated by mTORC2 loss and uncoupled from longevity. Science. 2012;335:1638–1643. doi: 10.1126/science.1215135. [DOI] [PMC free article] [PubMed] [Google Scholar]
- 34.Pereira MJ, et al. mTOR inhibition with rapamycin causes impaired insulin signalling and glucose uptake in human subcutaneous and omental adipocytes. Molecular and cellular endocrinology. 2012;355:96–105. doi: 10.1016/j.mce.2012.01.024. [DOI] [PubMed] [Google Scholar]
- 35.Yang SB, et al. Rapamycin induces glucose intolerance in mice by reducing islet mass, insulin content, and insulin sensitivity. J Mol Med (Berl) 2012;90:575–585. doi: 10.1007/s00109-011-0834-3. [DOI] [PMC free article] [PubMed] [Google Scholar]
- 36.Inoki K, Zhu T, Guan KL. TSC2 mediates cellular energy response to control cell growth and survival. Cell. 2003;115:577–590. doi: 10.1016/S0092-8674(03)00929-2. [DOI] [PubMed] [Google Scholar]
- 37.Fulop T, et al. Aging, frailty and age-related diseases. Biogerontology. 2010;11:547–563. doi: 10.1007/s10522-010-9287-2. [DOI] [PubMed] [Google Scholar]
- 38.Watorek E, Szymczak M, Boratynska M, Patrzalek D, Klinger M. Cardiovascular risk in kidney transplant recipients receiving mammalian target of rapamycin inhibitors. Transplantation proceedings. 2011;43:2967–2969. doi: 10.1016/j.transproceed.2011.08.009. [DOI] [PubMed] [Google Scholar]
- 39.Soesanto W, et al. Mammalian target of rapamycin is a critical regulator of cardiac hypertrophy in spontaneously hypertensive rats. Hypertension. 2009;54:1321–1327. doi: 10.1161/HYPERTENSIONAHA.109.138818. [DOI] [PMC free article] [PubMed] [Google Scholar]
- 40.Turska-Kmiec A, et al. Reversal of tacrolimus-related hypertrophic cardiomyopathy after conversion to rapamycin in a pediatric liver transplant recipient. Pediatr Transplant. 2007;11:319–323. doi: 10.1111/j.1399-3046.2006.00633.x. [DOI] [PubMed] [Google Scholar]
- 41.Kuzman JA, O’Connell TD, Gerdes AM. Rapamycin prevents thyroid hormone-induced cardiac hypertrophy. Endocrinology. 2007;148:3477–3484. doi: 10.1210/en.2007-0099. [DOI] [PubMed] [Google Scholar]
- 42.McMullen JR, et al. Inhibition of mTOR signaling with rapamycin regresses established cardiac hypertrophy induced by pressure overload. Circulation. 2004;109:3050–3055. doi: 10.1161/01.CIR.0000130641.08705.45. [DOI] [PubMed] [Google Scholar]
- 43.Shioi T, et al. Rapamycin attenuates load-induced cardiac hypertrophy in mice. Circulation. 2003;107:1664–1670. doi: 10.1161/01.CIR.0000057979.36322.88. [DOI] [PubMed] [Google Scholar]
- 44.Boluyt MO, et al. Rapamycin inhibits alpha 1-adrenergic receptor-stimulated cardiac myocyte hypertrophy but not activation of hypertrophy-associated genes. Evidence for involvement of p70 S6 kinase. Circ Res. 1997;81:176–186. doi: 10.1161/01.RES.81.2.176. [DOI] [PubMed] [Google Scholar]
- 45.Sadoshima J, Izumo S. Rapamycin selectively inhibits angiotensin II-induced increase in protein synthesis in cardiac myocytes in vitro. Potential role of 70-kD S6 kinase in angiotensin II-induced cardiac hypertrophy. Circulation research. 1995;77:1040–1052. doi: 10.1161/01.RES.77.6.1040. [DOI] [PubMed] [Google Scholar]
- 46.Leenen FH, White R, Yuan B. Isoproterenol-induced cardiac hypertrophy: role of circulatory versus cardiac renin-angiotensin system. American journal of physiology. Heart and circulatory physiology. 2001;281:H2410–2416. doi: 10.1152/ajpheart.2001.281.6.H2410. [DOI] [PubMed] [Google Scholar]
- 47.Smeets PJ, et al. Cardiac hypertrophy is enhanced in PPAR alpha−/− mice in response to chronic pressure overload. Cardiovasc Res. 2008;78:79–89. doi: 10.1093/cvr/cvn001. [DOI] [PubMed] [Google Scholar]
- 48.Itoh N, Ohta H. Pathophysiological roles of FGF signaling in the heart. Front Physiol. 2013;4:247. doi: 10.3389/fphys.2013.00247. [DOI] [PMC free article] [PubMed] [Google Scholar]
- 49.Smeets PJ, et al. Inflammatory pathways are activated during cardiomyocyte hypertrophy and attenuated by peroxisome proliferator-activated receptors PPARalpha and PPARdelta. J Biol Chem. 2008;283:29109–29118. doi: 10.1074/jbc.M802143200. [DOI] [PMC free article] [PubMed] [Google Scholar]
- 50.Wilkinson JE, et al. Rapamycin slows aging in mice. Aging cell. 2012;11:675–682. doi: 10.1111/j.1474-9726.2012.00832.x. [DOI] [PMC free article] [PubMed] [Google Scholar]
- 51.Austad SN, Bartke A. Sex Differences in Longevity and in Responses to Anti-Aging Interventions: A Mini-Review. Gerontology. 2015;62:40–46. doi: 10.1159/000381472. [DOI] [PubMed] [Google Scholar]
- 52.Arriola Apelo SI, Pumper CP, Baar EL, Cummings NE, Lamming DW. Intermittent Administration of Rapamycin Extends the Life Span of Female C57BL/6J Mice. J Gerontol A Biol Sci Med Sci. 2016;71:876–881. doi: 10.1093/gerona/glw064. [DOI] [PMC free article] [PubMed] [Google Scholar]
- 53.Fang Y, et al. Duration of rapamycin treatment has differential effects on metabolism in mice. Cell metabolism. 2013;17:456–462. doi: 10.1016/j.cmet.2013.02.008. [DOI] [PMC free article] [PubMed] [Google Scholar]
- 54.Jankiewicz M, Groner B, Desrivieres S. Mammalian target of rapamycin regulates the growth of mammary epithelial cells through the inhibitor of deoxyribonucleic acid binding Id1 and their functional differentiation through Id2. Mol Endocrinol. 2006;20:2369–2381. doi: 10.1210/me.2006-0071. [DOI] [PubMed] [Google Scholar]
- 55.Bionaz M, Loor JJ. Gene networks driving bovine mammary protein synthesis during the lactation cycle. Bioinform Biol Insights. 2011;5:83–98. doi: 10.4137/BBI.S7003. [DOI] [PMC free article] [PubMed] [Google Scholar]
- 56.Liu Y, et al. Rapamycin-induced metabolic defects are reversible in both lean and obese mice. Aging (Albany NY) 2014;6:742–754. doi: 10.18632/aging.100688. [DOI] [PMC free article] [PubMed] [Google Scholar]
- 57.Baar EL, Carbajal KA, Ong IM, Lamming DW. Sex- and tissue-specific changes in mTOR signaling with age in C57BL/6J mice. Aging Cell. 2016;15:155–166. doi: 10.1111/acel.12425. [DOI] [PMC free article] [PubMed] [Google Scholar]
- 58.Balasubramanian S, et al. mTOR in growth and protection of hypertrophying myocardium. Cardiovasc Hematol Agents Med Chem. 2009;7:52–63. doi: 10.2174/187152509787047603. [DOI] [PMC free article] [PubMed] [Google Scholar]
- 59.Das A, et al. Mammalian target of rapamycin (mTOR) inhibition with rapamycin improves cardiac function in type 2 diabetic mice: potential role of attenuated oxidative stress and altered contractile protein expression. The Journal of biological chemistry. 2014;289:4145–4160. doi: 10.1074/jbc.M113.521062. [DOI] [PMC free article] [PubMed] [Google Scholar]
- 60.Dai DF, et al. Altered proteome turnover and remodeling by short-term caloric restriction or rapamycin rejuvenate the aging heart. Aging cell. 2014;13:529–539. doi: 10.1111/acel.12203. [DOI] [PMC free article] [PubMed] [Google Scholar]
- 61.Aoyagi T, et al. Cardiac mTOR protects the heart against ischemia-reperfusion injury. American journal of physiology. Heart and circulatory physiology. 2012;303:H75–85. doi: 10.1152/ajpheart.00241.2012. [DOI] [PMC free article] [PubMed] [Google Scholar]
- 62.Hernandez G, et al. A novel cardioprotective p38-MAPK/mTOR pathway. Experimental cell research. 2011;317:2938–2949. doi: 10.1016/j.yexcr.2011.09.011. [DOI] [PMC free article] [PubMed] [Google Scholar]
- 63.Huang J, Dibble CC, Matsuzaki M, Manning BD. The TSC1-TSC2 complex is required for proper activation of mTOR complex 2. Mol Cell Biol. 2008;28:4104–4115. doi: 10.1128/MCB.00289-08. [DOI] [PMC free article] [PubMed] [Google Scholar]
- 64.Shende P, et al. Cardiac mTOR complex 2 preserves ventricular function in pressure-overload hypertrophy. Cardiovasc Res. 2016;109:103–114. doi: 10.1093/cvr/cvv252. [DOI] [PubMed] [Google Scholar]
- 65.Ikeno Y, et al. Housing density does not influence the longevity effect of calorie restriction. The journals of gerontology. Series A, Biological sciences and medical sciences. 2005;60:1510–1517. doi: 10.1093/gerona/60.12.1510. [DOI] [PubMed] [Google Scholar]
- 66.Yano H, et al. Exhaustive exercise reduces TNF-alpha and IFN-alpha production in response to R-848 via toll-like receptor 7 in mice. Eur J Appl Physiol. 2010;110:797–803. doi: 10.1007/s00421-010-1560-1. [DOI] [PMC free article] [PubMed] [Google Scholar]
Associated Data
This section collects any data citations, data availability statements, or supplementary materials included in this article.


