

Abstract
One of the important elements for most bacterial growth is iron, the bioavailability of which is limited in hosts. Riemerella anatipestifer (R. anatipestifer, RA), an important duck pathogen, requires iron to live. However, the genes involved in iron metabolism and the mechanisms of iron transport are largely unknown. Here, we investigated the transcriptomic effects of iron limitation condition on R. anatipestifer CH-1 using the RNA-Seq and RNA-Seq-based analysis. Data analysis revealed genes encoding functions related to iron homeostasis, including a number of putative TonB-dependent receptor systems, a HmuY-like protein-dependent hemin (an iron-containing porphyrin) uptake system, a Feo system, a gene cluster related to starch utilization, and genes encoding hypothetical proteins that were significantly upregulated in response to iron limitation. Compared to the number of upregulated genes, more genes were significantly downregulated in response to iron limitation. The downregulated genes mainly encoded a number of outer membrane receptors, DNA-binding proteins, phage-related proteins, and many hypothetical proteins. This information suggested that RNA-Seq-based analysis in iron-limited medium is an effective and fast method for identifying genes involved in iron uptake in R. anatipestifer CH-1.
1. Introduction
Riemerella anatipestifer (R. anatipestifer, RA) is a Gram-negative bacterium that belongs to the family Flavobacteriaceae in the rRNA superfamily V [1]. R. anatipestifer infection causes disease in ducks, geese, chickens, turkeys, and other waterfowl and birds [2]. The disease presents as an acute or chronic septicemia characterized by meningitis, fibrinous pericarditis, perihepatitis, and other symptoms [3]. The disease causes increased mortality and decreased weight and is estimated to result in huge economic losses to the duck industry each year worldwide. At present, at least 21 serotypes of R. anatipestifer have been identified in the world [2, 4].
Iron is one of the most important elements for bacterial growth, as it is an essential cofactor in many important enzymes involved in energy metabolism and nucleotide synthesis [5]. Iron is the second most abundant metal on earth, but it exists primarily in the insoluble ferric oxide form under aerobic conditions, which is not available for bacterial growth [5]. Inside the host, most iron is bound to iron-binding proteins, such as ferritin, transferrin, and lactoferrin. Iron could also be included in the heme of hemoproteins (the terminology “heme” was used when talking about hemoproteins) [6]. Bacteria employ various mechanisms to capture iron from the outside [7]. One of these mechanisms is the secretion of a small molecular compound, a siderophore, which sequesters iron from the outside environment by high-affinity interactions [8]. Then, iron-bound siderophores are taken up by the bacteria through specific siderophore receptors and transport systems [9]. Alternatively, some pathogens have specific cell surface receptors that bind hemin (the terminology “hemin” was used when talking about iron and protoporphyrin ring source) or hemoprotein and transport hemin to the cell or secreted hemophores that capture hemin from host hemoproteins and then deliver hemin to bacterial surface receptors [10]. Therefore, iron-limited conditions are able to prompt most bacteria to upregulate the expression of genes related to iron/hemin uptake, such as iron/hemin transporters and siderophore biosynthetic enzymes [11–13].
R. anatipestifer requires iron and hemin to survive [14]. Genome analysis has shown that R. anatipestifer codes for a large number of TonB-dependent receptors, a TonB family protein, two sets of TonB complexes, and an FeoAB system [15]. In a previous study, we demonstrated that TonB1 and TonB2 are involved in hemin uptake by R. anatipestifer ATCC11845 [14]. Moreover some hemin binding proteins were detected in R. anatipestifer CH-1 [16]. However, other genes involved in iron/hemin uptake by R. anatipestifer are largely unknown. In this study, we analyzed the global transcriptomic changes in R. anatipestifer CH-1 under iron-limited conditions. Here, we observed wide-ranging effects on the transcripts of iron-related genes of R. anatipestifer CH-1 and identified some new genes involved in iron/hemin uptake.
2. Materials and Methods
2.1. Bacterial Strains and Growth Conditions
For transcriptome analyses, R. anatipestifer CH-1 was grown in tryptone soy broth (TSB) medium (Sigma, China) as the iron-replete condition, while the iron-limited condition was TSB supplemented with 100 μM iron chelator 2,2′-dipyridyl (Dip). The bacteria were cultured at 37°C with shaking at 180 rpm/min. Then, they were harvested at OD600 = 0.6 for iron-limited cultures and OD600 = 1.1 for iron-replete cultures (Figure 1).
Figure 1.
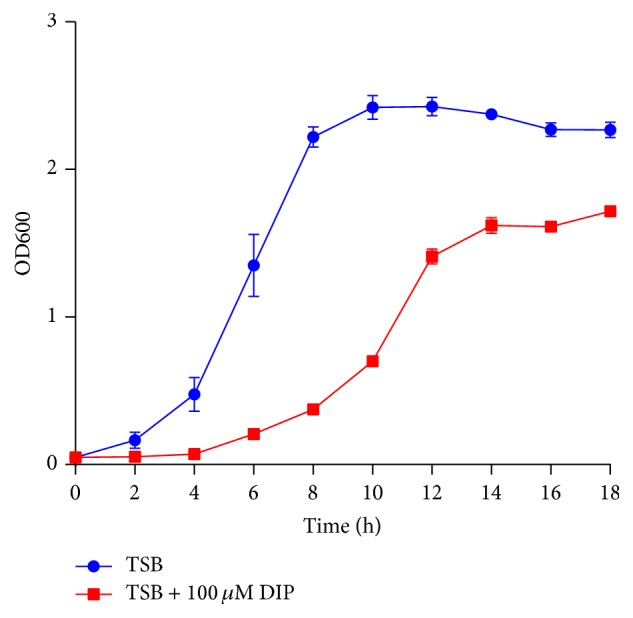
Growth curves of R. anatipestifer CH-1 in iron-limited and iron-replete media. Optical densities at a wavelength of 600 nm were taken from the 2nd to the 18th hours at intervals of 2 hours. Measurements were performed on triplicate samples.
2.2. RNA-Seq
Total RNA extraction was performed using the RNeasy Protect Bacteria Mini Kit (QIAGEN, Cat. number 74524) using the protocol described by Liu et al. [17]. A total amount of 3 μg RNA per sample was used for the RNA sample preparations. RNA quantification, library preparation, and sequencing were performed at Beijing Novogene as described elsewhere. Then the clean data were obtained by removing reads containing adapter, reads containing ploy-N, and low-quality reads from raw data [18]. The high-quality reads obtained for each library were shown in Table 1. Then the R. anatipestifer CH-1 genome (CP003787.1) and gene model annotation files were downloaded from genome website (https://www.ncbi.nlm.nih.gov/nuccore/CP003787.1) directly, using Bowtie2-2.2.3 to build index and align clean reads of the R. anatipestifer CH-1 genome [19].
Table 1.
Summary of Illumina RNA-Seq data.
| Sample | Total reads | Total mapped | Clean data∗ (Gb) | Percentage of sequence reads mapped |
|---|---|---|---|---|
| CH_1TSB | 17948156 | 17106745 | 2.24 | 95.31% |
| CH_1TSBD | 21489778 | 21099289 | 2.68 | 98.18% |
∗Clean data were obtained from raw data by removing reads containing adapter and poly-N and low-quality reads.
2.3. Real-Time PCR Validation of RNA-Seq
The differential expression of selected genes was validated by quantitative reverse transcription polymerase chain reaction (qRT-PCR) using the SYBR green-based detection system on a CFX Connect® Real-Time PCR Detection System (Bio-Rad Laboratories, Hercules, CA) using the KAPA SYBR® FAST qPCR kit (KAPABIOSYSTEMS, Boston, USA). cDNA was synthesized from each RNA sample (1 μg) using the HiScript™ Q RT SuperMix for qPCR (+gDNA wiper) (R123-01; Vazyme, Nanjing, China). Real-time PCR assays were conducted with the primers for real-time PCR listed in Table S1 in Supplementary Material, available online at https://doi.org/10.1155/2017/8682057. Quantitative PCR was performed on samples deposited in triplicate using the standard curve mode protocol in which the calibration curve was generated using serial fivefold dilutions of 100 ng of total RNA. The RNA quantity was normalized using a probe specific for 16S rRNA.
2.4. RNA-Seq Analysis
To quantify the expression level of genes, HTSeq v0.6.1 was used to count the read numbers mapped to each gene [20]. Then, the FPKM (expected number of Fragments Per Kilobase of transcript sequence per Million base pairs sequenced) of each gene was calculated based on the length of the gene and the read counts mapped to this gene. Prior to differential gene expression analysis, for each sequenced library, the read counts were adjusted by edgeR program package through one scaling normalized factor [21]. In this study, we used the DEGSeq R package (1.20.0) to execute the differential expression analysis of two conditions [22]. Corrected P value of 0.005 and log2 (fold change) of 1 were set as the threshold for significantly differential expression. To analyze the gene structure of R. anatipestifer CH-1, Rockhopper was used to identify operons and transcription start sites. This program can be used for efficient and accurate analysis of bacterial RNA-Seq data and can aid in the elucidation of bacterial transcriptomes [23]. Moreover we used the aligned paired-end reads to infer the operonic structure of R. anatipestifer CH-1 transcripts. If genes obtained >20 reads aligning on both genes in a sequencing sample, they would be selected as potential in an operonic structure. Sequential genes that are present in operonic structure were merged together to form potential operonic transcripts (Table S2).
3. Results and Discussion
3.1. Growth of R. anatipestifer CH-1 in TSB and TSB with Dip
To evaluate the effect of iron restriction on the growth of R. anatipestifer CH-1, we grew R. anatipestifer CH-1 in TSB and TSB with 100 μM Dip, which restricts most iron. Figure 1 showed that the growth of R. anatipestifer CH-1 was seriously hindered when iron was restricted, indicating that iron is an essential element for R. anatipestifer. Thus, this condition was suitable for performing RNA-Seq.
3.2. General Assessment of Iron Limitation Transcriptomic Datasets
Over 95% of all clean reads aligned to coding regions of the R. anatipestifer CH-1 genome (Table 1). Since only one sample in the different iron condition was used to perform RNA-Seq, qRT-PCR validation was performed on the transcriptome data using a subset of 20 differentially regulated genes (Table S1). The transcriptome data generally corresponded well with the qRT-PCR data, with a Pearson correlation coefficient of 0.806 (Figure 2), illustrating that our RNA-Seq data were of suitable quality for transcriptome analysis.
Figure 2.
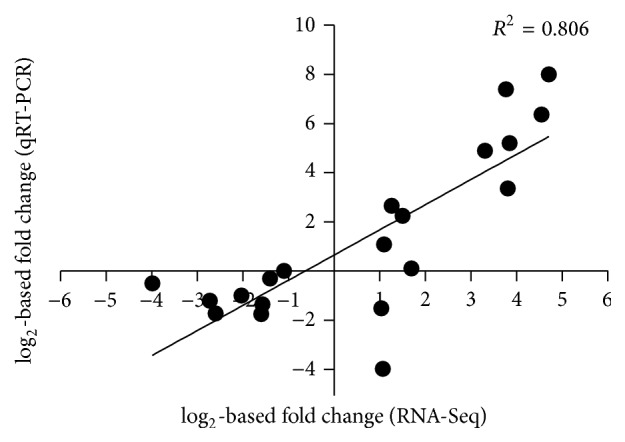
Validation of RNA-Seq data. Correlation analysis of log2-based fold changes between RNA-Seq data and qRT-PCR data for 20 genes of R. anatipestifer CH-1. The chart depicts a plot of RNA-Seq log2-based fold changes versus qRT-PCR log2-based fold changes for transcripts of genes in cultures of R. anatipestifer CH-1 grown in TSB+Dip medium versus TSB medium. A Pearson correlation coefficient of 0.806 was noted.
Upon comparing cultures grown in TSB and TSB with Dip, overall differences in gene expression were observed (Figure 3). To examine these differences further, DEGs (differentially expressed genes) were identified using the DEseq package [22]. A total of 463 DEGs were identified, including 80 upregulated (Table 2) and 383 downregulated genes (Table S3). These genes represent 23% of the genome (2038 genes) [15]. The large number of DEGs suggests that iron-limited environments have global effects on R. anatipestifer CH-1. Since samples of different OD were used to perform RNA-Seq, this study can not exclude the fact that cell density might influence gene expression.
Figure 3.
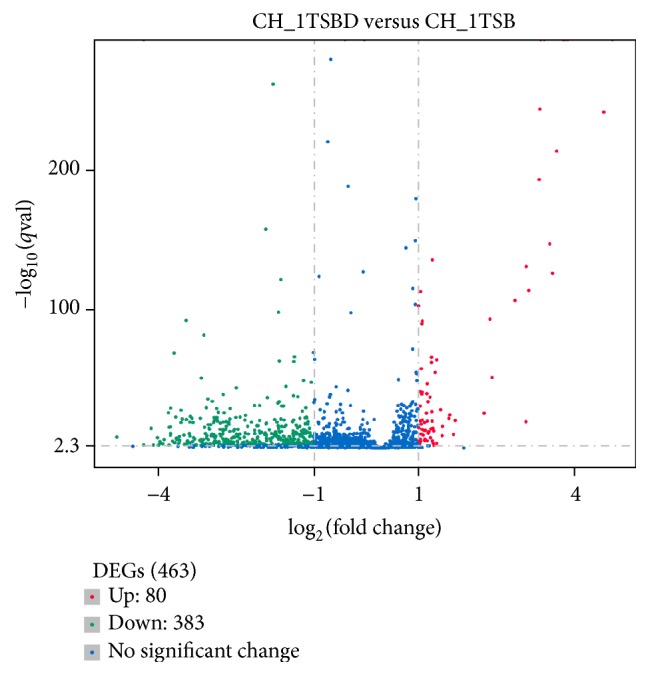
Differential gene transcription in cells grown in iron-limited TSB medium compared to TSB medium. The x-axis of the chart shows log2-based fold changes of transcripts in cells grown in iron-limited medium or TSB medium. The y-axis of the chart shows the statistical significance. Each dot in the chart represents one annotated gene. Red dots: upregulated, green dots: downregulated, and blue dots: no significant change.
Table 2.
Genes upregulated in Riemerella anatipestifer CH-1 in iron-depleted conditions.
| Gene ID | Gene name | log2.Fold_change. | P value | Description |
|---|---|---|---|---|
| 13715178 | B739_0074 | 1.289 | 0.00021641 | Hypothetical protein |
| 13715197 | B739_0093 | 2.8509 | 2.72E − 108 | Hypothetical protein |
| 13715198 | B739_0094 | 1.2615 | 8.08E − 28 | Outer membrane receptor for Fe3+FecA |
| 13715199 | B739_0095 | 1.5902 | 5.31E − 23 | Type I deoxyribonuclease HsdR |
| 13715200 | B739_0096 | 3.3265 | 4.50E − 246 | Hypothetical protein |
| 13715201 | B739_0097 | 3.1172 | 1.67E − 115 | Carbohydrate-binding protein |
| 13715202 | B739_0098 | 3.3417 | 0 | Hypothetical protein |
| 13715203 | B739_0099 | 3.5712 | 5.25E − 128 | Hypothetical protein |
| 13715204 | B739_0100 | 3.5135 | 5.06E − 149 | Hypothetical protein |
| 13715205 | B739_0101 | 3.0646 | 1.23E − 132 | Substrate import-associated zinc metallohydrolase |
| 13715206 | B739_0102 | 3.4075 | 0 | Glycan metabolism protein RagB |
| 13715207 | B739_0103 | 3.8099 | 0 | TonB-linked outer membrane protein, SusC/RagA family |
| 13715231 | B739_0127 | 1.275 | 1.56E − 06 | DNA-binding protein |
| 13715277 | B739_0173 | 3.3109 | 2.55E − 195 | TonB-dependent receptor CirA, mostly Fe transport |
| 13715278 | B739_0174 | 3.6434 | 5.92E − 216 | Hypothetical protein |
| 13715279 | B739_0175 | 2.413 | 5.96E − 53 | Ankyrin |
| 13715280 | B739_0176 | 3.0584 | 1.11E − 20 | Predicted periplasmic protein |
| 13715281 | B739_0177 | 1.0467 | 3.85E − 06 | Nitric oxide synthase |
| 13715373 | B739_2137 | 1.1196 | 6.02E − 07 | Camphor resistance protein CrcB; integral membrane protein possibly involved in chromosome condensation [cell division and chromosome partitioning] |
| 13715432 | B739_0891 | 1.0093 | 1.05E − 06 | Hypothetical protein |
| 13715452 | B739_0912 | 1.0968 | 6.65E − 11 | Ribonuclease III |
| 13715453 | B739_0913 | 1.0147 | 0.0019348 | Hypothetical protein |
| 13715513 | B739_0973 | 1.0814 | 1.74E − 42 | 50S ribosomal protein L16/L10E |
| 13715515 | B739_0975 | 1.0712 | 4.92E − 15 | 30S ribosomal protein S17 |
| 13715522 | B739_0982 | 1.1625 | 3.94E − 41 | 50S ribosomal protein L18 |
| 13715525 | B739_0985 | 1.2524 | 1.07E − 63 | 50S ribosomal protein L15 |
| 13715526 | B739_0986 | 1.0086 | 2.96E − 104 | Preprotein translocase subunit SecY |
| 13715542 | −//− | 1.4285 | 1.38E − 29 | tRNA-Glu |
| 13715606 | B739_1068 | 3.8593 | 0 | FecA |
| 13715627 | B739_1089 | 1.3526 | 1.76E − 65 | Hypothetical protein |
| 13715649 | B739_1112 | 1.0673 | 5.05E − 41 | 50S ribosomal protein L31 |
| 13715783 | B739_1246 | 1.0718 | 1.24E − 91 | 30S ribosomal protein S16 |
| 13715836 | B739_1299 | 1.2361 | 5.75E − 09 | Hypothetical protein |
| 13715897 | B739_1360 | 1.3576 | 0.0002407 | Hypothetical protein |
| 13715932 | B739_1395 | 1.4655 | 1.89E − 17 | 2-Amino-4-hydroxy-6-hydroxymethyldihydropteridine pyrophosphokinase |
| 13715934 | B739_1397 | 1.08 | 1.36E − 93 | Outer membrane protein-related peptidoglycan-associated (lipo)protein |
| 13715952 | B739_1415 | 4.7103 | 0 | Hypothetical protein |
| 13715953 | B739_1416 | 3.7691 | 0 | FepA |
| 13715954 | B739_1417 | 4.5479 | 5.15E − 244 | HmuY |
| 13715956 | B739_1419 | 1.2458 | 2.43E − 15 | Restriction endonuclease S subunits, Hsds |
| 13716000 | B739_1467 | 1.605 | 7.16E − 26 | Hypothetical protein |
| 13716023 | B739_1491 | 1.2534 | 2.55E − 67 | Hypothetical protein |
| 13716028 | B739_1496 | 1.0255 | 0.00022217 | Hypothetical protein |
| 13716038 | B739_1506 | 1.2051 | 1.41E − 13 | Phosphate transport regulator |
| 13716056 | B739_1525 | 1.0126 | 2.76E − 16 | OmpA |
| 13716068 | B739_1537 | 1.1923 | 2.42E − 35 | Thioredoxin |
| 13716179 | B739_1648 | 1.1687 | 1.56E − 06 | Hypothetical protein |
| 13716365 | B739_1842 | 1.4584 | 1.63E − 10 | Hypothetical protein |
| 13716406 | B739_1883 | 1.1398 | 2.85E − 14 | Preprotein translocase subunit SecG |
| 13716420 | B739_1898 | 1.1221 | 8.61E − 20 | 3-Oxoacyl-(acyl-carrier-protein) synthase III |
| 13716438 | B739_1916 | 1.1349 | 1.80E − 07 | Hypothetical protein |
| 13716459 | B739_1938 | 1.0469 | 7.76E − 115 | Hypothetical protein |
| 13716524 | B739_2003 | 1.1565 | 1.21E − 26 | Polyisoprenoid-binding protein; YceI-like domain |
| 13716533 | B739_2012 | 1.3031 | 0.0098864 | Prevent-host-death protein; Antitoxin Phd_YefM, type II toxin-antitoxin system |
| 13716610 | B739_2089 | 1.0236 | 0.00048509 | Porin |
| 13716613 | B739_2092 | 1.0406 | 3.79E − 32 | Starch binding outer membrane protein SusD |
| 13716712 | B739_0221 | 1.0457 | 3.80E − 21 | Gliding motility protein GldL |
| 13716745 | B739_0254 | 1.1712 | 1.78E − 48 | Hypothetical protein |
| 13716748 | B739_0257 | 1.0548 | 1.69E − 11 | Hypothetical protein |
| 13716800 | B739_0310 | 1.1729 | 4.55E − 21 | Carbohydrate-binding protein SusD |
| 13716803 | B739_0313 | 1.0601 | 2.33E − 59 | Ribonuclease G |
| 13716804 | B739_0314 | 1.3277 | 1.60E − 56 | Bacterial nucleoid DNA-binding protein |
| 13716824 | B739_0335 | 1.2846 | 9.72E − 16 | Hypothetical protein |
| 13716825 | B739_0336 | 1.0435 | 1.66E − 07 | Hypothetical protein |
| 13716826 | B739_0337 | 1.0406 | 3.10E − 06 | Ras_like_GTPase |
| 13716848 | B739_0360 | 1.2725 | 1.12E − 137 | 50S ribosomal protein L11 |
| 13716849 | B739_0361 | 1.0413 | 1.23E − 42 | Transcription antiterminator |
| 13716885 | B739_0397 | 1.0567 | 6.51E − 19 | IMP dehydrogenase/GMP reductase |
| 13716908 | B739_0420 | 1.0126 | 2.35E − 05 | Sec-independent protein secretion pathway component |
| 13716924 | B739_0436 | 1.019 | 0.00033736 | Predicted glycosyltransferases |
| 13716964 | B739_0476 | 1.2682 | 6.15E − 21 | Hypothetical protein |
| 13716978 | B739_0490 | 2.3711 | 4.94E − 95 | Ferritin-like domain |
| 13717035 | B739_0547 | 1.2256 | 9.53E − 39 | RNA polymerase Rpb6 |
| 13717082 | B739_0594 | 1.082 | 1.16E − 21 | Iron transporter FeoB |
| 13717083 | B739_0595 | 2.259 | 5.94E − 27 | Iron transporter FeoA |
| 13717096 | B739_0608 | 1.6768 | 3.57E − 11 | Oxidoreductase; siderophore-interacting protein [inorganic ion transport and metabolism]ViuB |
| 13717113 | B739_0625 | 1.7097 | 2.66E − 21 | RNA polymerase sigma factor |
| 13717239 | B739_0753 | 1.1957 | 3.41E − 12 | Transthyretin-like protein |
| 13717245 | B739_0759 | 1.1112 | 2.64E − 14 | Iron-sulfur binding protein |
3.3. Genome-Wide Identification of R. anatipestifer CH-1 Genes in Operonic Structures
In addition to identifying gene boundaries, we drew on paired-end sequencing information to identify the R. anatipestifer CH-1 global operonic structure. In total, 377 genes were determined to be in operonic structures using this analysis, thus constituting 230 operons (Table S2). These genes represent 18% of the genome (2038 genes) [15].
3.4. Gene Ontology (GO) Annotation and Kyoto Encyclopedia of Genes and Genomes (KEGG) Pathway Mapping of DEGs
The DEGs were assigned to 26 functional groups by enrichment analysis of Gene Ontology (GO) assignments [18]. In the three main GO categories of biological process, cellular component, and molecular function, genes in the role categories of “localization, transport, and establishment of localization” in biological process, “membrane” in cellular component or “receptor activity and transporter activity” in molecular function were notably up- or downregulated (Figure 4).
Figure 4.

Role categories of genes from the transcriptome data. The numbers of genes that are up- and downregulated in R. anatipestifer CH-1 grown in iron-limited TSB medium versus TSB medium are categorized according to role categories. Some genes are listed in more than one category and so may be counted more than once.
The biological functions associated with the DEGs were further analyzed in terms of enriched Kyoto Encyclopedia of Genes and Genomes (KEGG) pathways [24], and a total of 20 pathways were predicted (Figure 5). Among these pathways, “microbial metabolism in diverse environments,” “ribosome,” and “thiamine metabolism” were the most highly represented categories (Figure 5).
Figure 5.

KEGG pathway enrichment analysis of differentially expressed genes between TSB and TSB with Dip. The y-axis of the chart shows the pathway name. The x-axis of the chart shows the Richness factor. The size of each point shows the number of genes in the pathway. The color of each point shows the Q value range.
3.5. Iron Limitation Increased the Transcription of Putative Iron Acquisition Systems
Genome sequence analysis indicated that R. anatipestifer CH-1 encodes Fe2+ and Fe3+ acquisition systems [15]. Once in the periplasm, Fe2+ is taken across the inner membrane via a divalent metal uptake system, such as the Feo system of E. coli [25] and the Yfe system of Yersinia pestis [26]. In this study, the predicted genes feoB (B739_0594) and feoA (B739_0595), which encode an Fe2+ transporter, were highly upregulated in the iron-limited condition, suggesting a role in the uptake of ferrous iron (Table 2). Sequence comparison revealed that all of the sequenced R. anatipestifer genomes have homologues of FeoA and FeoB of R. anatipestifer CH-1, with similarities of 100% for FeoA and between 88% and 100% for FeoB. In turn, these R. anatipestifer CH-1 genes have 33.45% and 32.89% identities to the FeoA and FeoB products of E. coli, respectively. In E. coli, this operon is regulated by Fur and is induced in acidic conditions [27]. The functions of FeoA and FeoB and their regulation in R. anatipestifer are underinvestigated.
In aerobic conditions, many bacteria produce siderophores to solubilize Fe3+. Then, siderophore-bound Fe3+ is taken up by TonB-dependent receptors [5]. Genome analysis revealed that there are at least 33 predicted TonB-dependent receptors in R. anatipestifer CH-1, some of which are predicted transporters for ferric-siderophore complexes or heme. In this study, 5 TonB-dependent receptors were upregulated (B739_0094, B739_0103, B739_0173, B739_1068, and B739_1416) in the presence of iron depletion. The expression levels of seven other putative TonB-dependent transporters (B739_0115, B739_0876, B739_1045, B739_1343, B739_0216, B739_0329, and B739_0389) (Table S3) were downregulated in the presence of iron depletion. Upregulated TonB-dependent receptors would be predicted to be involved in iron or hemin uptake, while the functions of all downregulated TonB-dependent receptors are presently unknown. Similar results have been obtained in other bacteria, such as Pseudomonas fluorescens [28].
TonB-dependent receptors rely on the accessory proteins ExbB, ExbD, and TonB for energy transduction. One TonB family protein and two sets of ExbB-ExbD-TonB were found and identified in R. anatipestifer [14]. In other bacteria, such as E. coli [29] and Pseudomonas fluorescens [28], the tonB gene is negatively regulated by iron. However, the transcription of tonB genes in R. anatipestifer CH-1 was not significantly changed in the iron-limited condition. To ensure the validity of the result, we also used qRT-PCR to measure tonB gene transcription in iron-limited conditions. The result was coincident with that of RNA-Seq. These results suggested that, in contrast to many bacteria, the tonB systems of R. anatipestifer CH-1 are not regulated by iron.
Once siderophore-bound Fe3+ is transported into the cytoplasm, the iron must be released from the siderophore. The first mechanism is that siderophore-bound Fe(III) is reduced to siderophore-bound Fe(II) followed by its spontaneous release due to the low affinity of iron Fe(II) with the siderophore. Another mechanism is that siderophore-bound Fe(III) is hydrolyzed by specialized enzymes, leading to a dramatic loss of complex stability and facilitating the subsequent removal of the iron [30] in a reduction process. In this study, a gene coding for a siderophore-interacting protein (B739_0608) was upregulated significantly in the presence of iron depletion. This siderophore-interacting protein is involved in iron acquisition and virulence in R. anatipestifer strain CH-3 [31]. Surprisingly, among the upregulated genes, we did not find any homologue gene related to siderophore synthesis.
3.6. A Putative Polysaccharide Utilization Locus of R. anatipestifer CH-1 Was Upregulated in Iron-Limited Conditions
In Capnocytophaga canimorsus, a member of the Bacteroidetes, a polysaccharide utilization system uses serotransferrin as an iron source [32]. Each polypeptide encoded by this locus is required for this iron uptake activity [32]. This type of system was named the iron capture system (ICS), and it contains seven genes: icsA, icsC, icsD, icsE, icsF, icsG, and icsH [32]. In this study, we identified a gene cluster (B739_0094, B739_0095, B739_0096, B739_0097, B739_0098, B739_0099, B739_0100, B739_0101, B739_0102, and B739_0103) (Table 2) involved in polysaccharide utilization, the expression of which was upregulated in the presence of iron depletion. Sequence comparison showed that the homologues of icsC, icsD, icsE, icsF, icsG, and icsH from Capnocytophaga canimorsus are B739_0103, B739_0102, B739_0101, B739_0100, B739_0099, and B739_0098, respectively, in the R. anatipestifer CH-1 genome. The homologue of icsA, B739_1068, was not cotranscribed with the others. Interestingly, some genes that were upregulated in the gene cluster, such as B739_0094, B739_0095, B739_0096, and B739_0097, were not predicted to contribute to the ICS system. Additionally, the R. anatipestifer CH-1 genome contains at least 6 polysaccharide utilization systems. In iron-limited conditions, three of the genes (locus B739_0094–B739_0103, locus B739_2091–B739_2093, and locus B739_0310–B739_0312) were upregulated (Table 2), while three other genes (locus B739_0115–B739_0118, locus B739_0875-B739_0876, and locus B739_1044-B739_1045) were downregulated (Table S3). Why some loci were upregulated and some loci were downregulated in the iron-limited condition is not currently understood.
3.7. Iron Limitation Increased Transcription of Putative Hemin Acquisition Systems
In the host, heme-containing proteins, such as hemoglobin, can be used as the main iron source by pathogenic bacteria [33]. Hemin uptake systems are regulated by iron in other bacteria [34, 35]. Here, putative genes involved in hemin uptake were more highly expressed in iron-limited cultures of R. anatipestifer CH-1 than in iron-replete cultures. Within the upregulated genes, the most highly expressed gene cluster was FepA-hmuY (B739_1416, B739_1417), which encodes a putative outer membrane ferrienterochelin, a colicin receptor and an HmuY-like hemophore protein. In Porphyromonas gingivalis, HmuY is a heme-binding lipoprotein associated with the outer membrane or secreted to the outside environment [36, 37]. Gene (B739_1415) adjacent to the FepA-hmuY operon was also upregulated in iron-limited medium. The functions of B739_1415, B739_1416, and B739_1417 in hemin utilization are underinvestigated in our group.
3.8. Transcription of Respiratory Chain Genes
In aerobic metabolism, the respiratory chain typically uses proteins that require iron as a cofactor [38]. When R. anatipestifer CH-1 was grown in iron-limited medium, the expression of genes coding for cytochrome biogenesis protein (B739_0948), periplasmic cytochrome c552 subunit (B739_0946), and cytochrome C (B739_0186) were downregulated (Table S3). It indicated that iron restriction hindered R. anatipestifer aerobic metabolism. Similarly, in other bacteria, such as Pseudomonas fluorescens Pf-5, the transcription levels of genes encoding cytochrome c-type biogenesis proteins (PFL_1684-88) and subunits of cbb3-type cytochrome c oxidases (PFL_1922-25, PFL_2834) are downregulated in iron-limited versus iron-replete medium [28].
3.9. Transcription of Genes Related to Natural Competence
Natural transformation refers to the process by which bacteria can actively take up and integrate exogenous DNA. Natural transformation is a major mechanism of horizontal gene transfer (HGT) and plays a prominent role in bacterial evolution [39]. The process of Vibrio cholerae natural transformation involves four steps: DNA-binding via type IV pili, DNA pulling via ComEA, DNA translocation via ComEC, and DNA recombination by the single-strand DNA-binding proteins DprA and RecA [40]. Previously, we found that R. anatipestifer CH-1 is naturally competent [41]. In R. anatipestifer CH-1, no putative type IV pilus locus is evident in the genome. In R. anatipestifer CH-1, two proteins that are predicted to be involved in the DNA uptake process, a ComEC homologue (B739_1095) and a gene encoding a single-strand DNA-binding protein (B739_1757), were downregulated in iron-limited conditions. One possibility for this phenomenon is that these proteins require iron for activity, as well as iron being predicted to be involved in the natural transformation process. This relationship between natural transformation and iron availability has not yet been described.
4. Conclusion
In this study, we examined the transcriptomic impact of iron limitation on R. anatipestifer CH-1 by comparing iron-limited TSB cultures with iron-replete TSB cultures. This transcriptome analysis identified numerous genes involved in R. anatipestifer CH-1 iron utilization. Under iron limitation, we observed changes in the transcription levels of genes related to iron homeostasis functions, such as the Feo system, the ICS system, and other iron uptake systems. Iron limitation also resulted in several unexpected responses, particularly the increased transcription of the ribosomal protein genes L18, L15, and L31. The data in this study were useful for identifying genes involved in iron utilization in R. anatipestifer CH-1 and for shedding light on the adaptation mechanisms of R. anatipestifer CH-1 in iron-limited environments, such as hosts.
Supplementary Material
Table S1: Primer sequences for qRT-PCR validation of transcriptom data.
Table S2: The prediction of operons of R. anatipestifer CH-1 genes.
Table S3: Genes down-regulated in Riemerellaanatipestifer CH-1 in iron-depleted conditions.
Acknowledgments
This work was supported by the International S&T Cooperation Program of Sichuan Province (Grant no. 2016HH0052), the National Natural Science Foundation of China (Grant no. 31302131, http://www.nsfc.gov.cn/), the Research Fund for the Doctoral Program of Higher Education of China (Grant no. 20135103120006, http://www.cutech.edu.cn/cn/index.htm), the National Science and Technology Support Program (no. 2015BAD12B05), the China Agricultural Research System (CARS-43-8), and the Integration and Demonstration of Key Technologies for Duck Industrialization in Sichuan Province (2014NZ0030).
Abbreviations
- RNA-Seq:
RNA sequencing
- qRT-PCR:
Quantitative reverse transcription polymerase chain reaction
- HGT:
Horizontal gene transfer
- DEGs:
Differentially expressed genes
- KEGG:
Kyoto encyclopedia of genes and genomes
- GO:
Gene Ontology
- ICS:
Iron capture system
- FPKM:
Expected number of Fragments Per Kilobase of transcript sequence per Million base pairs sequenced.
Conflicts of Interest
The authors declare that they have no competing interests.
Authors' Contributions
MaFeng Liu and AnChun Cheng conceived and designed the experiments. MaFeng Liu and Mi Huang performed the experiments. Francis Biville, MingShu Wang, DeKang Zhu, RenYong Jia, Shun Chen, and KunFeng Sun analyzed the data. Ying Wu and Qiao Yang contributed reagents/materials/analysis tools. MaFeng Liu and Mi Huang wrote the paper. All authors have reviewed the manuscript. MaFeng Liu and Mi Huang contributed equally to this work.
References
- 1.Subramaniam S., Chua K.-L., Tan H.-M., Loh H., Kuhnert P., Frey J. Phylogenetic position of Riemerella anatipestifer based on 16S rRNA gene sequences. International Journal of Systematic Bacteriology. 1997;47(2):562–565. doi: 10.1099/00207713-47-2-562. [DOI] [PubMed] [Google Scholar]
- 2.Subramaniam S., Huang B., Loh H., et al. Characterization of a predominant immunogenic outer membrane protein of Riemerella anatipestifer. Clinical and Diagnostic Laboratory Immunology. 2000;7(2):168–174. doi: 10.1128/CDLI.7.2.168-174.2000. [DOI] [PMC free article] [PubMed] [Google Scholar]
- 3.Leavitt S., Ayroud M. Riemerella anatipestifer infection of domestic ducklings. Canadian Veterinary Journal. 1997;38(2):p. 113. [PMC free article] [PubMed] [Google Scholar]
- 4.Pathanasophon P., Phuektes P., Tanticharoenyos T., Narongsak W., Sawada T. A potential new serotype of Riemerella anatipestifer isolated from ducks in Thailand. Avian Pathology. 2002;31(3):267–270. doi: 10.1080/03079450220136576. [DOI] [PubMed] [Google Scholar]
- 5.Wandersman C., Delepelaire P. Bacterial iron sources: From siderophores to hemophores. Annual Review of Microbiology. 2004;58:611–647. doi: 10.1146/annurev.micro.58.030603.123811. [DOI] [PubMed] [Google Scholar]
- 6.Runyen-Janecky L. J. Role and regulation of heme iron acquisition in gram-negative pathogens. Frontiers in Cellular and Infection Microbiology. 2013;4, article 55 doi: 10.3389/fcimb.2013.00055. [DOI] [PMC free article] [PubMed] [Google Scholar]
- 7.Andrews S. C., Robinson A. K., Rodríguez-Quiñones F. Bacterial iron homeostasis. FEMS Microbiology Reviews. 2003;27(2-3):215–237. doi: 10.1016/S0168-6445(03)00055-X. [DOI] [PubMed] [Google Scholar]
- 8.Hider R. C., Kong X. Chemistry and biology of siderophores. Natural Product Reports. 2010;27(5):637–657. doi: 10.1039/b906679a. [DOI] [PubMed] [Google Scholar]
- 9.Noinaj N., Guillier M., Barnard T. J., Buchanan S. K. TonB-dependent transporters: regulation, structure, and function. Annual Review of Microbiology. 2010;64:43–60. doi: 10.1146/annurev.micro.112408.134247. [DOI] [PMC free article] [PubMed] [Google Scholar]
- 10.Cescau S., Cwerman H., Létoffé S., Delepelaire P., Wandersman C., Biville F. Heme acquisition by hemophores. BioMetals. 2007;20(3-4):603–613. doi: 10.1007/s10534-006-9050-y. [DOI] [PubMed] [Google Scholar]
- 11.McHugh J. P., Rodríguez-Quiñones F., Abdul-Tehrani H., et al. Global iron-dependent gene regulation in Escherichia coli: a new mechanism for iron homeostasis. Journal of Biological Chemistry. 2003;278(32):29478–29486. doi: 10.1074/jbc.M303381200. [DOI] [PubMed] [Google Scholar]
- 12.Yu C., McClure R., Nudela K., Daou N., Genco C. A. Characterization of the Neisseria gonorrhoeae Iron and Fur regulatory network. Journal of Bacteriology. 2016;198(16):2180–2191. doi: 10.1128/JB.00166-16. [DOI] [PMC free article] [PubMed] [Google Scholar]
- 13.Butcher J., Stintzi A. The transcriptional landscape of Campylobacter jejuni under iron replete and iron limited growth conditions. PLoS ONE. 2013;8(11) doi: 10.1371/journal.pone.0079475.e79475 [DOI] [PMC free article] [PubMed] [Google Scholar]
- 14.Liao H., Cheng X., Zhu D., et al. TonB energy transduction systems of riemerella anatipestifer are required for iron and hemin utilization. PLoS ONE. 2015;10(5) doi: 10.1371/journal.pone.0127506.e0127506 [DOI] [PMC free article] [PubMed] [Google Scholar]
- 15.Wang X., Liu W., Zhu D., et al. Comparative genomics of Riemerella anatipestifer reveals genetic diversity. BMC Genomics. 2014;15(1, article 479) doi: 10.1186/1471-2164-15-479. [DOI] [PMC free article] [PubMed] [Google Scholar]
- 16.Liao H., Liu M., Cheng X., et al. The detection of hemin-binding proteins in riemerella anatipestifer CH-1. Current Microbiology. 2016;72(2):152–158. doi: 10.1007/s00284-015-0932-5. [DOI] [PubMed] [Google Scholar]
- 17.Liu M., Wang M., Zhu D., et al. Investigation of TbfA in Riemerella anatipestifer using plasmid-based methods for gene over-expression and knockdown. Scientific Reports. 2016;6:p. 37159. doi: 10.1038/srep37159. [DOI] [PMC free article] [PubMed] [Google Scholar]
- 18.Liu J., Wang S., Qin T., et al. Whole transcriptome analysis of Penicillium digitatum strains treatmented with prochloraz reveals their drug-resistant mechanisms. BMC Genomics. 2015;16(1, article 855) doi: 10.1186/s12864-015-2043-x. [DOI] [PMC free article] [PubMed] [Google Scholar]
- 19.Langmead B., Salzberg S. L. Fast gapped-read alignment with Bowtie 2. Nature Methods. 2012;9(4):357–359. doi: 10.1038/nmeth.1923. [DOI] [PMC free article] [PubMed] [Google Scholar]
- 20.Anders S., Pyl P. T., Huber W. HTSeq—a Python framework to work with high-throughput sequencing data. Bioinformatics. 2015;31(2):166–169. doi: 10.1093/bioinformatics/btu638. [DOI] [PMC free article] [PubMed] [Google Scholar]
- 21.Robinson M. D., McCarthy D. J., Smyth G. K. edgeR: a Bioconductor package for differential expression analysis of digital gene expression data. Bioinformatics. 2010;26(1):139–140. doi: 10.1093/bioinformatics/btp616. [DOI] [PMC free article] [PubMed] [Google Scholar]
- 22.Anders S., Huber W. Differential expression analysis for sequence count data. Genome Biology. 2010;11(10, article R106) doi: 10.1186/gb-2010-11-10-r106. [DOI] [PMC free article] [PubMed] [Google Scholar]
- 23.McClure R., Balasubramanian D., Sun Y., et al. Computational analysis of bacterial RNA-Seq data. Nucleic Acids Research. 2013;41(14, article e140) doi: 10.1093/nar/gkt444. [DOI] [PMC free article] [PubMed] [Google Scholar]
- 24.Mao X., Cai T., Olyarchuk J. G., Wei L. Automated genome annotation and pathway identification using the KEGG Orthology (KO) as a controlled vocabulary. Bioinformatics. 2005;21(19):3787–3793. doi: 10.1093/bioinformatics/bti430. [DOI] [PubMed] [Google Scholar]
- 25.Lau C. K. Y., Krewulak K. D., Vogel H. J. Bacterial ferrous iron transport: the Feo system. FEMS Microbiology Reviews. 2016;40(2):273–298. doi: 10.1093/femsre/fuv049.fuv049 [DOI] [PubMed] [Google Scholar]
- 26.Bearden S. W., Perry R. D. The Yfe system of Yersinia pestis transports iron and manganese and is required for full virulence of plague. Molecular Microbiology. 1999;32(2):403–414. doi: 10.1046/j.1365-2958.1999.01360.x. [DOI] [PubMed] [Google Scholar]
- 27.Cao J., Woodhall M. R., Alvarez J., Cartron M. L., Andrews S. C. EfeUOB (YcdNOB) is a tripartite, acid-induced and CpxAR-regulated, low-pH Fe2+ transporter that is cryptic in Escherichia coli K-12 but functional in E. coli O157:H7. Molecular Microbiology. 2007;65(4):857–875. doi: 10.1111/j.1365-2958.2007.05802.x. [DOI] [PubMed] [Google Scholar]
- 28.Lim C. K., Hassan K. A., Tetu S. G., Loper J. E., Paulsen I. T. The effect of iron limitation on the transcriptome and proteome of Pseudomonas fluorescens Pf-5. PLoS ONE. 2012;7(6) doi: 10.1371/journal.pone.0039139.e39139 [DOI] [PMC free article] [PubMed] [Google Scholar]
- 29.Higgs P. I., Larsen R. A., Postle K. Quantification of known components of the Escherichia coli TonB energy transduction system: TonB, ExbB, ExbD and FepA. Molecular Microbiology. 2002;44(1):271–281. doi: 10.1046/j.1365-2958.2002.02880.x. [DOI] [PubMed] [Google Scholar]
- 30.Miethke M., Marahiel M. A. Siderophore-based iron acquisition and pathogen control. Microbiology and Molecular Biology Reviews. 2007;71(3):413–451. doi: 10.1128/MMBR.00012-07. [DOI] [PMC free article] [PubMed] [Google Scholar]
- 31.Tu J., Lu F., Miao S., et al. The siderophore-interacting protein is involved in iron acquisition and virulence of riemerella anatipestifer strain CH3. Veterinary Microbiology. 2014;168(2-4):395–402. doi: 10.1016/j.vetmic.2013.11.027. [DOI] [PubMed] [Google Scholar]
- 32.Manfredi P., Lauber F., Renzi F., Hack K., Hess E., Cornelis G. R. New iron acquisition system in Bacteroidetes. Infection and Immunity. 2015;83(1):300–310. doi: 10.1128/IAI.02042-14. [DOI] [PMC free article] [PubMed] [Google Scholar]
- 33.Rouault T. A. Pathogenic bacteria prefer heme. Science. 2004;305(5690):1577–1578. doi: 10.1126/science.1102975. [DOI] [PubMed] [Google Scholar]
- 34.Contreras H., Chim N., Credali A., Goulding C. W. Heme uptake in bacterial pathogens. Current Opinion in Chemical Biology. 2014;19(1):34–41. doi: 10.1016/j.cbpa.2013.12.014. [DOI] [PMC free article] [PubMed] [Google Scholar]
- 35.Sheldon J. R., Heinrichs D. E. Recent developments in understanding the iron acquisition strategies of gram positive pathogens. FEMS Microbiology Reviews. 2015;39(4):592–630. doi: 10.1093/femsre/fuv009. [DOI] [PubMed] [Google Scholar]
- 36.Olczak T., Sroka A., Potempa J., Olczak M. Porphyromonas gingivalis HmuY and HmuR: further characterization of a novel mechanism of heme utilization. Archives of Microbiology. 2008;189(3):197–210. doi: 10.1007/s00203-007-0309-7. [DOI] [PMC free article] [PubMed] [Google Scholar]
- 37.Wojtowicz H., Guevara T., Tallant C., et al. Unique structure and stability of HmuY, a novel heme-binding protein of Porphyromonas gingivalis. PLoS Pathogens. 2009;5(5):p. e1000419. doi: 10.1371/journal.ppat.1000419. [DOI] [PMC free article] [PubMed] [Google Scholar]
- 38.Ochsner U. A., Wilderman P. J., Vasil A. I., Vasil M. L. GeneChip® expression analysis of the iron starvation response in Pseudomonas aeruginosa: identification of novel pyoverdine biosynthesis genes. Molecular Microbiology. 2002;45(5):1277–1287. doi: 10.1046/j.1365-2958.2002.03084.x. [DOI] [PubMed] [Google Scholar]
- 39.Gogarten J. P., Townsend J. P. Horizontal gene transfer, genome innovation and evolution. Nature Reviews Microbiology. 2005;3(9):679–687. doi: 10.1038/nrmicro1204. [DOI] [PubMed] [Google Scholar]
- 40.Matthey N., Blokesch M. The DNA-uptake process of Naturally Competent Vibrio cholerae. Trends in Microbiology. 2016;24(2):98–110. doi: 10.1016/j.tim.2015.10.008. [DOI] [PubMed] [Google Scholar]
- 41.Liu M., Zhang L., Huang L., et al. Use of Natural Transformation To Establish an Easy Knockout Method in Riemerella anatipestifer. Applied and Environmental Microbiology. 2017;83(9) doi: 10.1128/AEM.00127-17. [DOI] [PMC free article] [PubMed] [Google Scholar]
Associated Data
This section collects any data citations, data availability statements, or supplementary materials included in this article.
Supplementary Materials
Table S1: Primer sequences for qRT-PCR validation of transcriptom data.
Table S2: The prediction of operons of R. anatipestifer CH-1 genes.
Table S3: Genes down-regulated in Riemerellaanatipestifer CH-1 in iron-depleted conditions.