

Abstract
The mitochondrial citrate transport protein (CTP), encoded by SLC25A1, accommodates bidirectional trafficking of citrate between the mitochondria and cytosol, supporting lipid biosynthesis and redox homeostasis. Genetic CTP deficiency causes a fatal neurodevelopmental syndrome associated with the accumulation of L- and D-2-hydroxyglutaric acid, and elevated CTP expression is associated with poor prognosis in several types of cancer, emphasizing the importance of this transporter in multiple human pathologies. Here we describe the metabolic consequences of CTP deficiency in cancer cells. As expected from the phenotype of CTP-deficient humans, somatic CTP loss in cancer cells induces broad dysregulation of mitochondrial metabolism, resulting in accumulation of lactate and of the L- and D- enantiomers of 2-hydroxyglutarate (2HG) and depletion of TCA cycle intermediates. It also eliminates mitochondrial import of citrate from the cytosol. To quantify the impact of CTP deficiency on metabolic flux, cells were cultured with a set of 13C-glucose and 13C-glutamine tracers with resulting data integrated by metabolic flux analysis (MFA). CTP-deficient cells displayed a major restructuring of central carbon metabolism, including suppression of pyruvate dehydrogenase (PDH) and induction of glucose-dependent anaplerosis through pyruvate carboxylase (PC). We also observed an unusual lipogenic pathway in which carbon from glucose supplies mitochondrial production of alpha-ketoglutarate (AKG), which is then trafficked to the cytosol and used to supply reductive carboxylation by isocitrate dehydrogenase 1 (IDH1). The resulting citrate is cleaved to produce lipogenic acetyl-CoA, thereby completing a novel pathway of glucose-dependent reductive carboxylation. In CTP deficient cells, IDH1 inhibition suppresses lipogenesis from either glucose or glutamine, implicating IDH1 as a required component of fatty acid synthesis in states of CTP deficiency.
Keywords: SLC25A1, Citrate Transporter, 2HG, IDH1, Lung Cancer, Cancer Metabolism
Graphical Abstract
1. Introduction
The mitochondrial citrate transport protein (CTP, known elsewhere in the literature as the citrate carrier, CIC) mediates the transport of citrate across the inner mitochondrial membrane in electroneutral exchange with either another tricarboxylate, phosphoenoylpyruvate (PEP) or a dicarboxylate such as malate (Palmieri, 2004). CTP is encoded by the SLC25A1 gene located on chromosome 22q11.2. SLC25A1 expression is highest in lipogenic tissues (such as liver and renal cortex) and pancreas, reflecting key functions of mitochondrial citrate export. The first is to use cytosolic citrate as a ‘signal of plenty’, regulating glycolysis via allosteric inhibition of phosphofructokinase, and fatty acid synthesis via allosteric activation of acetyl-CoA carboxylase. Citrate exported from the mitochondria in excess of the demands for oxidative metabolism also provides a source of activated acetyl units for lipogenesis and for the post-translational modification of proteins including enzymes (Xiong and Guan, 2012), transporters (Palmieri et al., 2015) and histones (Wellen et al., 2009).
In humans, biallelic germline loss of function mutations in SLC25A1 have been linked to two distinct phenotypes. The first is a neurodevelopmental syndrome associated with combined L-/D-2-hydroxyglutaric acidaemia (Nota et al., 2013) and lactic acidosis (Prasun et al., 2015) alongside variable dysmorphic features (Smith et al., 2016). The second is an isolated early-onset congenital myasthenia (muscle weakness) in the absence of accumulated organic acids (Chaouch et al., 2014). In the latter phenotype, it appears that a moderate degree of residual CTP activity tempers the clinical severity. Haploinsufficiency of SLC25A1 is also observed in 22q11.2 deletion syndrome (22qDS), the most common human chromosomal microdeletion, which is associated with developmental defects of the heart, face, palate, thymus and hypoparathyroid glands. Six of the 30 genes hemizygously deleted in 22qDS, including SLC25A1, encode mitochondrial proteins, and elevated lactate and 2HG have occasionally been observed in affected children (Napoli et al., 2015). SLC25A1-deficient mice are stunted and succumb to early death (Brommage et al., 2014).
Oncogenic reprogramming of metabolism in cancer cells involves many activities contributing to cellular fitness and growth, including increased rates of de novo fatty acid synthesis (Menendez and Lupu, 2007) and alterations in the acetylation of histones and other proteins (Taylor et al., 2014). Several lines of evidence implicate SLC25A1 in cancer progression. High levels of SLC25A1 expression are associated with poor prognosis in lung and estrogen receptor negative breast cancer (Kolukula et al., 2014). Breast cancer cell lines require CTP to maintain mitochondrial integrity and cell proliferation, with CTP inhibition resulting in enhanced lactate secretion and reduced oxidative phosphorylation (Catalina-Rodriguez et al., 2012). Oncogenic p53 mutants induce CTP expression and enhance the growth of xenografts derived from non-small cell lung cancer cell lines, and CTP inhibition blunts the tumorigenic effects of mutant p53 (Kolukula et al., 2014). In ovarian cancer patients, tumor SLC25A1 mRNA levels are also associated with resistance to platinum-based chemotherapy, and blocking CTP function enhances platinum sensitivity in cultured ovarian carcinoma cells (Kolukula et al., 2014).
In this study, we sought to test whether somatic deletion of CTP in cultured cells recapitulates the phenotype of germline CTP deficiency, including alterations in lactate and 2HG metabolism. We also sought to broadly characterize the effects of CTP loss on metabolic flux in cancer cells, thereby obtaining a detailed understanding of how CTP participates in metabolic reprogramming and how compensatory metabolic activities help to sustain cell viability and growth under conditions of CTP loss.
2. Materials and methods
2.1 Materials
Culture materials were purchased from Sigma-Aldrich (St. Louis, MO). The IDH1 inhibitor GSK864 was obtained from The Structural Genomics Consortium organization (www.thesgc.org). [U-13C]glucose, [U-13C]glutamine, [5-13C]glutamine, [3,4-13C]glucose and [3-2H]glucose tracers were purchased from Cambridge Isotope Laboratories (Andover, MA).
2.2 Cell lines and culture
SLC25A1-deficient H460 cells were generated using the CRISPR/Cas9 system as described (Jiang et al., 2016). H460 cells were cultured in RPMI supplemented with penicillin/streptomycin, 5% fetal bovine serum (FBS), 4mM L-glutamine and 1mM HEPES. Conventional tissue culture dishes were used for monolayer culture, and dishes with an Ultra-Low Attachment surface were used for spheroid culture. Identical culture medium was used for monolayer and spheroid cultures. For spheroids, 2×10⁵ H460 cells were plated in a 10cm Ultra-Low Attachment dish. The medium was changed on days 4, 6 and 7 of culture, by centrifuging at 50xg for 3 minutes, then gently re-suspending in fresh medium (Jiang et al., 2016).
2.3 Western blotting
Whole cell lysates were prepared in RIPA buffer and quantified using the BCA Protein Assay (ThermoFisher Scientific). Proteins were separated on 4-20% SDS-PAGE gels, transferred to PVDF membranes, and probed with antibodies against PDH (#459400, TheromoFisher Scientific), PDH-pSer293 (AP1062, Millipore), Actin (A3853, Sigma), PC (sc-67021) and CTP (sc-86392) from Santa Cruz Biotechnology.
2.4 Extracellular Acidification Rate (ECAR) and Oxygen Consumption Rate (OCR)
H460 cells were plated in growth media at 1×10⁴ cells per well in XF96 microplates (Seahorse Bioscience; Billerica, MA) 18 hours prior to the assay following manufacturer’s recommendations for cell seeding. One hour prior to the assay, cells were washed and transferred to phenol-red free RPMI (ThermoFisher Scientific) and then incubated at 37°C in a non-CO2 incubator. ECAR and OCR were monitored through the Seahorse Cell Mito Stress Test, and data were normalized by protein content.
2.5 Metabolic assays and stable isotope tracing
Glucose, lactate, glutamine and glutamate were measured in culture medium using an automated electrochemical analyzer (BioProfile Basic-4 analyzer, NOVA). Stable isotope tracing experiments to determine isotopologue distributions in soluble metabolites and fatty acids were performed as described previously (Jiang et al., 2016; Yang et al., 2014).
2.6 Metabolomics
For metabolomics experiments, 3×10⁶ cells were plated 24 hours prior to extraction using standard culture medium. Two hours prior to extraction, the culture medium was replaced with fresh medium. Sample preparation, LC/MS and data analysis were performed as previous described (Mullen et al., 2014). Data were analyzed using a supervised partial least squares-discriminant analysis (PLS-DA) analysis, and variable importance in the projection (VIP) scores were calculated using MetaboAnalyst (Xia et al., 2015).
2.7 Measurement of 2-Hydroxyglutaric Acid (2HG)
Intracellular metabolites were extracted with 1ml 50% methanol. Intracellular L and D enantiomers of 2HG were then measured using a LC-MS/MS based method as previous described (Rakheja et al., 2011)
2.8 Metabolic flux analysis (MFA)
Steady state metabolic fluxes were calculated by combining extracellular flux rates (glucose/glutamine utilization, lactate/glutamate secretion) and 13C mass isotopologue distributions (MIDs) for lactate, citrate, glutamate, fumarate, malate and palmitate, using the isotopomer network compartmental analysis (INCA) software package (Young, 2014), which applies an elementary metabolite unit framework to efficiently simulate MIDs (Antoniewicz et al., 2007; Young et al., 2008). We developed reaction networks describing the stoichiometry and transitions of central carbon metabolism, with assumptions as previously described (Jiang et al., 2016). Parallel labeling data from cultures fed [5-13C]glutamine, [U-13C]glutamine or [U-13C]glucose were used to simultaneously fit the same network model to estimate intracellular fluxes. To ensure that a global minimum of fluxes was identified, flux estimations were initiated from random values and repeated a minimum of 50 times. A chi-square test was applied to test goodness-of-fit, and accurate 95% confidence intervals were calculated by assessing the sensitivity of the sum of squared residuals to flux parameter variations. Table 1 contains the degrees of freedom and sum-of-squared residuals (SSR) for the best fit model and the lower and upper bounds of 95% confidence intervals for all fluxes.
Table 1.
Calculated fluxes used in the metabolic network illustrated in Figure 5.
| CTP-WT | CTP-KO | ||||||
|---|---|---|---|---|---|---|---|
|
| |||||||
| ID | Equation | Value | 95% C.I. | Value | 95% C.I. | Ratio | |
| v1 | Glc Uptake | Glucose.x -> Glucose | 1.2369 | [1.0901,1.3770] | 1.4088 | [1.2735,1.545] | 1.1390 |
| v2 | Glycolysis | Glucose -> Pyr.c + Pyr.c | 1.2369 | [1.0901,1.3770] | 1.4088 | [1.2735,1.545] | 1.1390 |
| v3 | LDHa | Pyr.c -> Lac | 2.0938 | [1.7935,2.4052] | 2.7439 | [2.4547,3.0338] | 1.3105 |
| v4 | Lac Sec | Lac -> Lac.x | 2.0938 | [1.7935,2.4052] | 2.7439 | [2.4547,3.0338] | 1.3105 |
| v5 | MPC | Pyr.c -> Pyr.m | 0.5952 | [0.3711,0.7377] | 0.2785 | [0.2047,0.3532] | 0.4679 |
| v6 | PDH | Pyr.m -> AcCoA.m + CO2 | 0.5167 | [0.2962,0.6440] | 0.1488 | [0.1205,0.1778] | 0.2880 |
| v7 | FAO | AcCoA.d -> AcCoA.m | 0.0428 | [0.0230,0.0598] | 0.0245 | [0.0173,0.0329] | 0.5724 |
| v8 | PC | Pyr.m + CO2 -> OAA.m | 0.0785 | [0.0610,0.1004] | 0.1297 | [0.0702,0.1868] | 1.6522 |
| v9 | CS | AcCoA.m + OAA.m -> Cit.m | 0.5594 | [0.3214,0.6973] | 0.1733 | [0.1404,0.2071] | 0.3098 |
| v10 | IDH.m | Cit.m -> aKG.m + CO2 | 0.1376 | [0.1135,0.1627] | 0.1643 | [0.1328,0.1975] | 1.1940 |
| v11 | OGDH | aKG.m -> Suc + CO2 | 0.2578 | [0.2020,0.3471] | 0.1998 | [0.0933,0.3039] | 0.7750 |
| v12 | SDH.m | Suc -> Fum | 0.2578 | [0.2020,0.3471] | 0.1998 | [0.0933,0.3039] | 0.7750 |
| v13 | FH.m | Fum <-> Mal.m | 0.2578 | [0.2020,0.3471] | 0.1998 | [0.0933,0.3039] | 0.7750 |
| v14 | MDH.m | Mal.m <-> OAA.m | 0.4809 | [0.2459,0.6043] | 0.0436 | [-0.0011,0.1124] | 0.0907 |
| v15 | Gln Uptake | Gln.x -> Gln | 0.2362 | [0.1978,0.2747] | 0.2226 | [0.1836,0.2617] | 0.9424 |
| v16 | GLS | Gln -> Glu | 0.2362 | [0.1978,0.2747] | 0.2226 | [0.1836,0.2617] | 0.9424 |
| v17 | Glu Dilution | Glu.p -> Glu | 0.0520 | [0.0425,0.0624] | 0.0453 | [0.0359,0.0558] | 0.8712 |
| v18 | GDH | Glu <-> aKG.m | 0.2153 | [0.1644,0.2664] | 0.1880 | [0.1369,0.2394] | 0.8732 |
| v19 | Glu Sec | Glu -> Glu.x | 0.0730 | [0.0534,0.0925] | 0.0799 | [0.0603,0.0995] | 1.0945 |
| v20 | aKG trans | aKG.m <-> aKG.c | 0.0951 | [0.0452,0.1208] | 0.1526 | [0.0780,0.2827] | 1.6046 |
| v21 | IDH.c | aKG.c + CO2 -> Cit.c | 0.0951 | [0.0452,0.1208] | 0.1526 | [0.0780,0.2827] | 1.6046 |
| v22 | CTP | Cit.m -> Cit.c | 0.4219 | [0.1967,0.5396] | 0.0090 | [0.0021,0.0230] | 0.0213 |
| v23 | ACLY | Cit.c -> OAA.c + AcCoA.c | 0.5169 | [0.2423,0.6581] | 0.1615 | [0.0820,0.2996] | 0.3124 |
| v24 | AST | OAA.c <-> Asp | 0.0786 | [0.0000,0.1604] | 0.1129 | [0.0095,0.2186] | 1.4364 |
| v25 | Asp sec | Asp -> Asp.x | 0.0786 | [0.0000,0.1604] | 0.1129 | [0.0095,0.2186] | 1.4364 |
| v26 | MDH.c | OAA.c <-> Mal.c | 0.4383 | [0.1504,0.5462] | 0.0486 | [-0.0994,0.1772] | 0.1109 |
| v27 | ME | Mal.c -> Pyr.c + CO2 | 0.2152 | [0.1654,0.2689] | 0.2048 | [0.1234,0.2894] | 0.9517 |
| v28 | Mal trans | Mal.c <-> Mal.m | 0.2231 | [-0.0425,0.3062] | -0.1562 | [-0.2976,-0.0074] | -0.7001 |
| v29 | FASN | 8*AcCoA.c -> pal | 0.0646 | [0.0303,0.0823] | 0.0202 | [0.0103,0.0374] | 0.3127 |
| v30 | Pal Dilution | pal.d -> pal | 0.0194 | [0.0090,0.0251] | 0.0104 | [0.0052,0.0194] | 0.5361 |
Fluxes were determined using the network illustrated in Figure 5. Negative flux values indicate that the net direction is reverse to the indicated direction. The sum of squared residuals was 114.4 for CTP-WT and 111.6 for CTP-KO, both within the acceptable range (70.8-125.0). Degrees of freedom = 96. Units for all fluxes are nmol/μg protein/h.
Metabolites: AcCoA, acetyl-CoA; aKG, a-ketoglutarate; Asp, aspartate; Cit, citrate; Fum, fumarate; Glc, glucose; Gln, glutamine; Glu, glutamate; Lac, lactate; Mal, malate; OAA, oxaloacetate; Pal, palmitate; Pyr, pyruvate; Suc, succinate. c, cytosolic; m, mitochondrial; p, pool. C.I., Confidence Interval.
Enzymes and transporters: LDH, lactate dehydrogenase; MPC, mitochondrial pyruvate carrier; PDH, pyruvate dehydrogenase; FAO, fatty acid oxidation; PC, pyruvate carboxylase; CS, citrate synthase; IDH, isocitrate dehydrogenase; OGDH, a-ketoglutarate dehydrogenase; SDH, succinate dehydrogenase; FH, fumarase; MDH, malate dehydrogenase; GLS, glutaminase; GDH, glutamate dehydrogenase; CTP, citrate transporter protein; ACLY, ATP citrate lyase; AST, aspartate aminotransferase; ME, malic enzyme; FASN,
3. Results
3.1 Metabolic abnormalities in CTP-deficient cells
We previously generated CTP-deficient H460 non-small cell lung cancer (NSCLC) cells using CRISPR/Cas9 gene editing of the SLC25A1 gene and confirmed that mitochondria isolated from these cells were deficient in citrate transport (Jiang et al., 2016). To examine the effect of CTP deficiency on metabolism in intact cells, we performed metabolomic profiling of control and CTP-deficient H460 cells. These cell lines had distinct metabolomic fingerprints (Fig. 1A, B). Variable importance in the projection (VIP) analysis revealed several metabolites related to the TCA cycle as differentiating the CTP wild type (CTP-WT) and knockout (CTP-KO) metabolomes from each other, including 2-HG, citrate/isocitrate, malate and N-acetyl-aspartic acid (NAA) (Fig. 1C). Targeted metabolite detection revealed that CTP-KO cells had significant elevations of both the L- and D enantiomers of2HG, and reduced levels of citrate (Fig. 1D, E).
Figure 1. Metabolomic profiling of CTP-deficient cells.
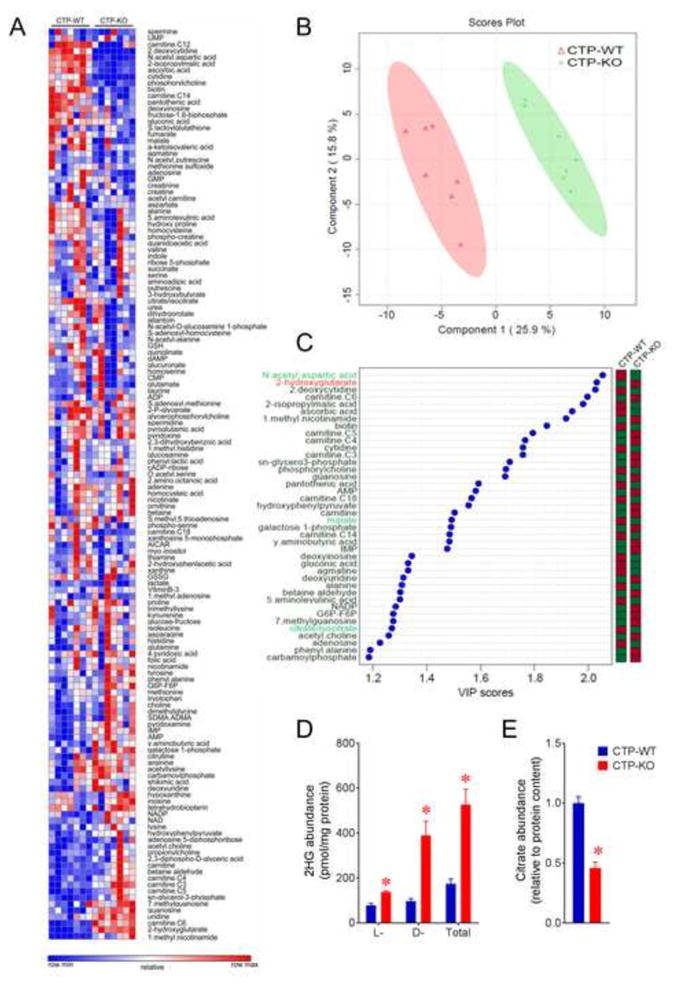
A) Targeted metabolomic profiling in H460 NSCLC cells containing or lacking citrate transport protein expression (CTP-WT and CTP-KO, respectively). Each column shows metabolite levels from independent CTP-WT or CTP-KO cultures (n=7).
B) Supervised clustering of metabolite profiles from the cultures in panel (A) was performed using partial least squares-discriminant analysis (PLS-DA).
C) Metabolites with VIP scores greater than 1.1 (see x-axis) are indicated on the graph. The abundance of these metabolites differed significantly between CTP-WT and CTP-KO cells. Metabolites related to the TCA cycle are highlighted in green (lower in CTP-KO) or red (higher in CTP-KO). Columns on the right are color-coded based on the levels of each metabolite in each cell line (green=lower; red=higher).
D) Relative abundance of the L form and D form 2HG in CTP-WT and CTP-KO cells.
E) Relative abundance of citrate in CTP-WT and CTP-KO cells.
Data are displayed as ave. ± S.D. *, p<0.05, two-tailed student t-test. n=3 cultures of a representative experiment in panel D and E.
As an initial assessment of metabolic flux, oxygen consumption rates (OCR) and extracellular acidification rates (ECAR) were compared between CTP-WT and CTP-KO cells. CTP-KO cells had modestly reduced basal oxygen consumption and modestly enhanced extracellular acidification that is consistent with a shift from oxidative phosphorylation towards glycolysis for energy production (Fig. 2A). CTP-KO cells also displayed enhanced levels of inhibitory phosphorylation of pyruvate dehydrogenase (PDH) (Fig. 2B), and enhanced rates of lactate secretion and glucose consumption (Fig. 2C), all of which also suggest impaired mitochondrial oxidative metabolism.
Figure 2. Reduced oxidative metabolism and enhanced glycolysis in CTP-deficient cells.
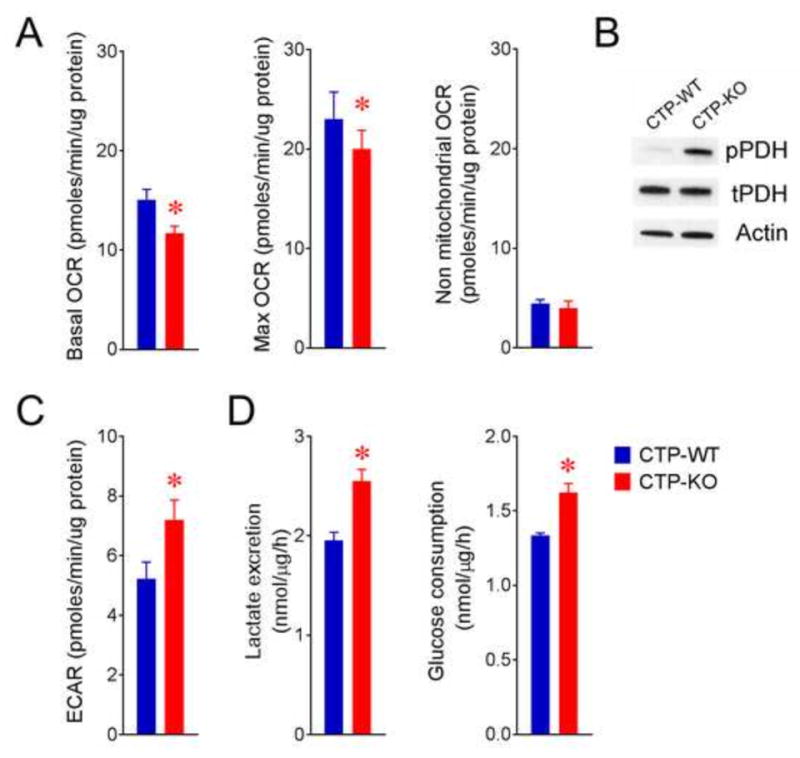
A) Basal, maximal (uncoupled) and non-mitochondrial oxygen consumption rate (OCR) in CTP-WT and CTP-KO cells measured on a Seahorse XFe96 analyzer.
B) Phosphorylated (pPDH, phosphorylated on Ser293) and total (tPDH) levels of pyruvate dehydrogenase E1α protein analyzed by western-blot.
C) Extracellular acidification rates (ECAR) in CTP-WT and CTP-KO cells measured on a Seahorse XFe96 analyzer.
D) Quantitative lactate secretion and glucose consumption rates in CTP-WT and CTP-KO cells.
Data are displayed as ave. ± S.D. *, p<0.05, two-tailed student t-test. n=10 cultures of a representative experiment in panel A. n=3 cultures of a representative experiment in panel C and D. All experiments were repeated 3 times.
3.2 Impaired mitochondrial membrane transport of citrate in CTP-deficient cells
Like most cancer cells, H460 cells grown in a monolayer primarily use glucose as a carbon source for de novo fatty acid synthesis, with 75% of the lipogenic acetyl-CoA derived from glucose (Jiang et al., 2016). Because this conventional pathway of fatty acid synthesis requires citrate produced in the mitochondria to be exported to the cytosol, we used 13C-labeled nutrients to examine the effect of CTP loss on lipogenic carbon sources. CTP loss reduced but did not eliminate glucose’s contribution to palmitate synthesis (Fig. 3A,B), and glutamine-derived carbon made a larger contribution to the lipogenic acetyl-CoA pool in these cells (Fig. 3C,D). In summary, both glucose and glutamine were major carbon sources for fatty acid synthesis in CTP-KO cells, with glucose contributing 32% and glutamine contributing 48% of the lipogenic acetyl-CoA pool (Fig. 3B,D).
Figure 3. CTP deficiency alters nutrient contributions for de novo fatty acid synthesis.
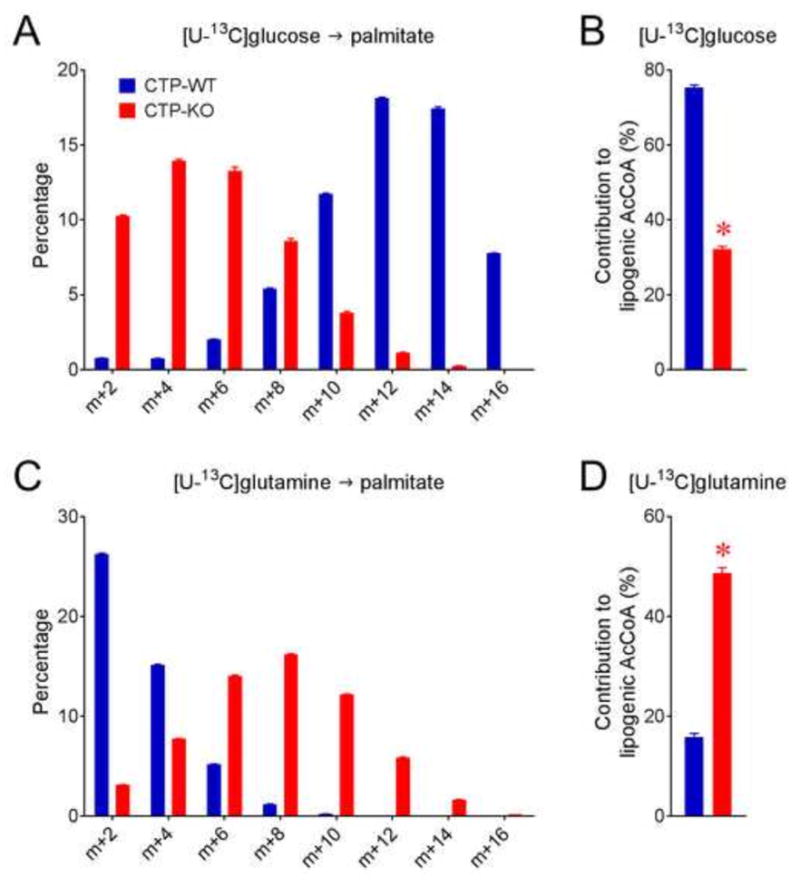
A) Palmitate mass isotopologue distributions (MIDs) after culture with [U-13C]glucose and saponification of cellular lipids. For simplicity, only evenly labeled isotopologues (m+2, m+4, etc.) are shown.
B) Fractional contribution of glucose to lipogenic acetyl-CoA calculated from palmitate MIDs in panel A.
C) Palmitate MIDs after culture with [U-13C]glutamine and saponification of cellular lipids.
D) Fractional contribution of glutamine to lipogenic acetyl-CoA calculated from palmitate MIDs in panel C.
Data are displayed as mean ± S.D. *, p<0.05, two-tailed student t-test. n=3 cultures of a representative experiment. All experiments were repeated 3 times.
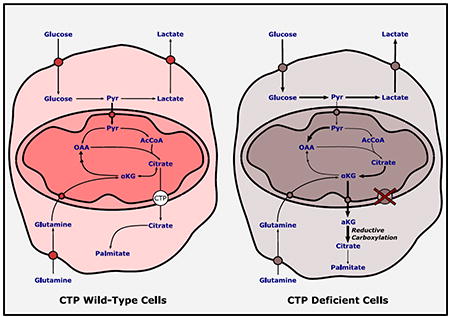
Our previous work suggested that CTP functioned in a metabolic shuttle allowing citrate/isocitrate produced through reductive carboxylation in the cytosol to enter the mitochondria and participate in oxidative metabolism and NADPH production (Jiang et al., 2016), as illustrated in Fig. 4A. This pathway becomes activated in anchorage-independent spheroids to counteract the increase in mitochondrial reactive oxygen species (ROS) accompanying loss of anchorage. To directly assess CTP’s role in this redox shuttling pathway, we generated CTP-WT and CTP-KO cell lines expressing a doxycycline-inducible allele of mutant isocitrate dehydrogenase-2 (mtIDH2). This enzyme generates D-2HG in a reaction that requires mitochondrial NADPH, and is therefore used in 2H tracer experiments to report on the mitochondrial NADPH pool (Lewis et al., 2014). Culturing both cell lines with [3-2H]glucose resulted in enhanced m+1 labeling of citrate in spheroids (Fig. 4B). As expected, labeling was equivalent between spheroids generated from either CTP-WT or CTP-KO cells, consistent with the previously-reported cytosolic localization of reductive citrate/isocitrate formation (Jiang et al., 2016). However, labeling in the 2HG pool was eliminated in CTP-KO cells (Fig. 4C), indicating that CTP is required for citrate/isocitrate-dependent shuttling of NADPH from the cytosol to the mitochondria.
Figure 4. CTP is required for transfer of isocitrate/citrate from cytosol to mitochondria.
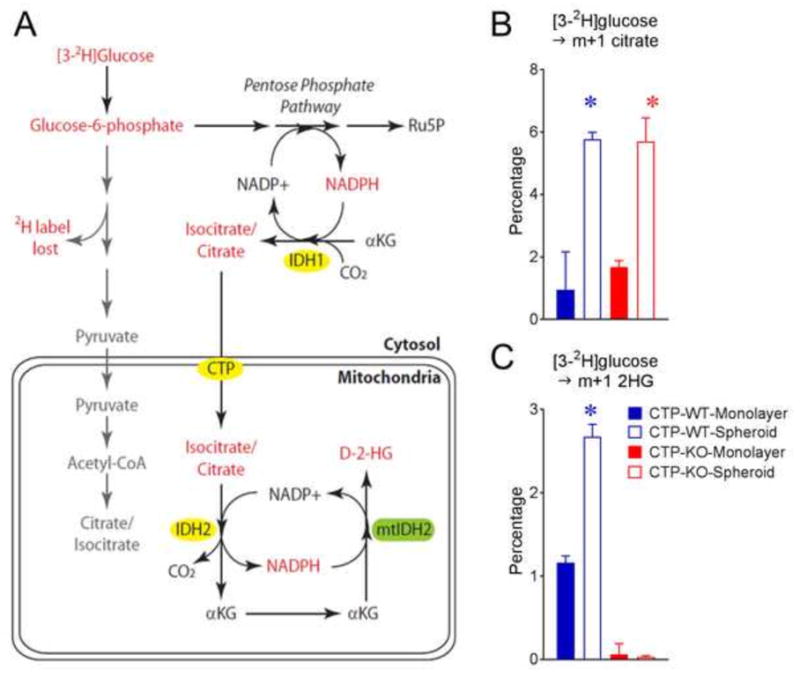
A) Pathways of [3-2H]glucose metabolism in H460 cells. Note that CTP is not required to transfer 2H to citrate, but is predicted to be required to label the mitochondrial NADPH pool, which is used to synthesize D-2-hydroxyglutarate.
B) Citrate enrichment in monolayer and spheroid cultures of CTP-WT and CTP-KO cells cultured with [3-2H]glucose
C) Enrichment of 2-hydroxyglutarate in monolayer and spheroid cultures of CTP-WT and CTP-KO cells cultured with [3-2H]glucose
Data are displayed as mean ± S.D. *, p<0.05, one-way ANOVA followed by Tukey’s multiple comparisons test. n=3 cultures of a representative experiment. All experiments were repeated 3 times.
3.3 Metabolic flux analysis in CTP-deficient cells
To quantify the metabolic alterations induced by CTP deficiency, we used 13C metabolic flux analysis (MFA) incorporating isotope enrichment data from parallel [U-13C]glucose, [U-13C]glutamine and [5-13C]glutamine tracers in CTP-WT and CTP-KO cells (Fig. 5 and Table 1). Net rates of glucose and glutamine consumption; net rates of lactate and glutamate secretion; and 13C mass isotopologue distributions (MIDs) of citrate, glutamate, fumarate, malate, lactate and palmitate were used to constrain fluxes related to central carbon metabolism and fatty acid synthesis. Consistent with experimental observations, the model predicted increased glycolytic flux to lactate with decreased PDH and TCA cycle flux in CTP-KO cells. The net direction of malate trafficking reversed from mitochondrial import in CTP-WT cells to mitochondrial efflux in CTP-KO cells. The model also predicted an increase in mitochondrial efflux of alpha-ketoglutarate (AKG), consistent with an increased contribution of lipogenic acetyl-CoA from glutamine (Fig. 3). Two unexpected features of the model were: 1) reduced glutamine-dependent anaplerosis with a compensatory increase in pyruvate carboxylation; and 2) the surprising prediction that both glucose and glutamine contribute to the AKG used for reductive carboxylation.
Figure 5. Comparative modelling of metabolic fluxes in H460 cells containing or lacking CTP.
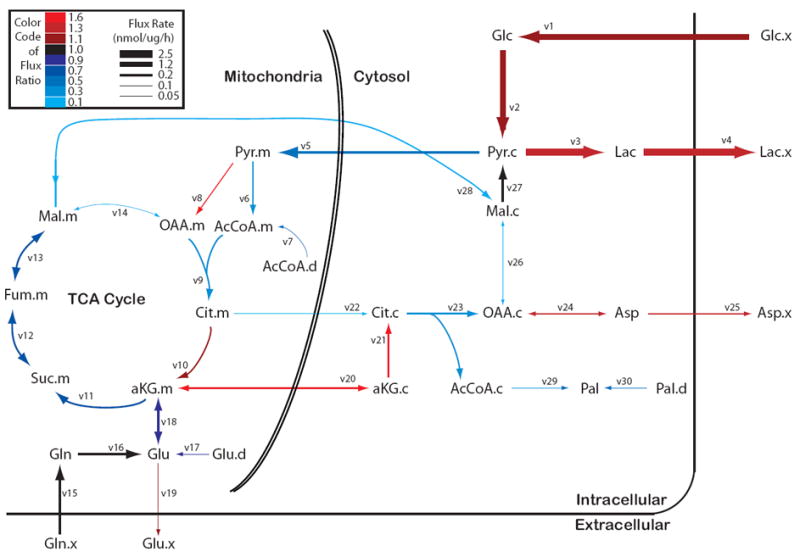
See Table 1 for definitions of quantitative flux values. Arrows are weighted according to absolute flux magnitudes of CTP-KO cells. The color scale reflects the ratio of each flux in CTP-KO cells relative to CTP-WT cells.
To test predictions suggested by the model, we first inspected malate and citrate enrichment from several tracing experiments. Consistent with the predicted suppression of glutamine-dependent anaplerosis, CTP-KO cells displayed reduced fractional enrichments of m+4 malate and citrate from [U-13C]glutamine, with enhanced m+0 fractions (Fig. 6A). m+3 malate and m+5 citrate fractions were enhanced in CTP-KO cells cultured with [U-13C]glucose, consistent with enhanced glucose-dependent anaplerosis via pyruvate carboxylase (PC) (Fig. 6B). To directly assess pyruvate carboxylation, we used the [3,4-13C]glucose tracer. Glycolysis converts this tracer to [1-13C]pyruvate, and subsequently the label is either lost during decarboxylation by PDH or transferred to TCA cycle intermediates by PC (Cheng et al., 2011). CTP-KO cells had robust labeling of malate and citrate from [3,4-13C]glucose, indicating that PC made a greater contribution to anaplerosis in these cells (Fig. 6C). We also found that PC protein abundance was significantly increased in CTP-KO cells (Fig. 6D).
Figure 6. Altered anaplerotic contributions in CTP-deficient cells.
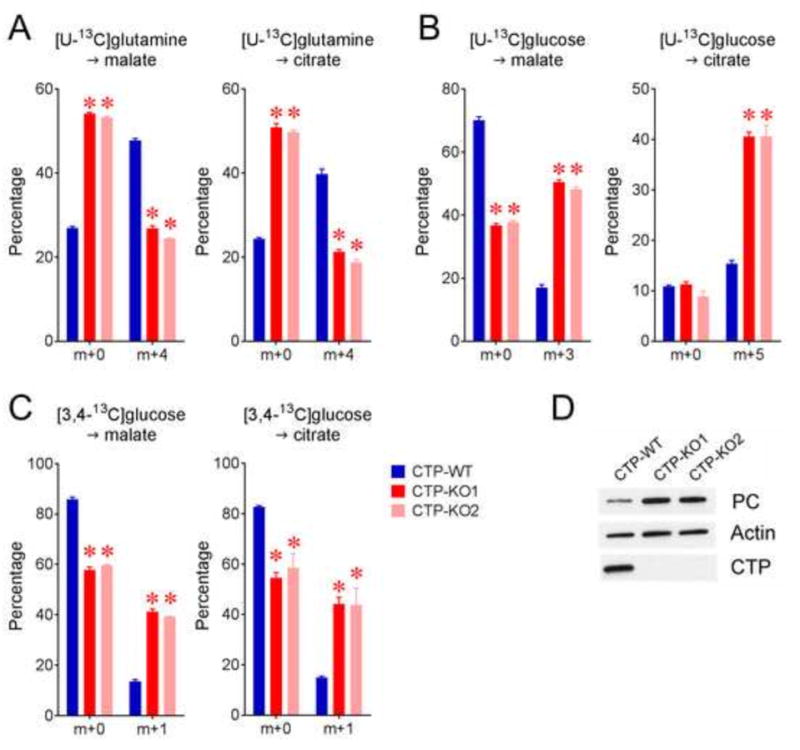
A) Selected malate and citrate MIDs in cells cultured in [U-13C]glutamine.
B) Selected malate and citrate MIDs in cells cultured in [U-13C]glucose.
C) Selected malate and citrate MIDs in cells cultured in [3,4-13C]glucose to assess flow through pyruvate carboxylase (PC).
D) Western-blot of PC expression in CTP-WT and CTP-KO cells.
Data are displayed as mean ± S.D. *, p<0.05, two-way ANOVA followed by Sidak’s multiple comparisons test. n=3 cultures of a representative experiment. All experiments were repeated 3 times. Two independent pools of CTP-KO clones (pools KO1 and KO2) were analyzed for all experiments.
3.4 IDH1 inhibition reduces lipogenic acetyl-CoA supply from both glucose and glutamine
The model also suggested increased efflux of AKG from mitochondria to cytosol in CTP-KO cells, providing substrate for enhanced reductive carboxylation by IDH1. The pathway indicated by the model is distinct from other forms of reductive carboxylation associated with mitochondrial dysfunction, in which glutamine is the dominant carbon source for fatty acid synthesis (Metallo et al., 2011; Mullen et al., 2011). CTP-KO cells, in contrast, are predicted to have persistent carbon flow from glucose through acetyl-CoA and AKG in the TCA cycle. Glucose-derived AKG is then trafficked to the cytosol to complement glutamine-derived AKG as substrate for IDH1 (Fig. 7A). This would result in the balanced contributions from glucose and glutamine to lipogenic acetyl-CoA detected by empirical palmitate labeling (Fig. 3B,D). To test whether IDH1 mediated glucose- and glutamine-dependent palmitate synthesis, cells were cultured with either [U-13C]glucose or [U-13C]glutamine, with or without an IDH1 inhibitor (GSK864). This inhibitor was developed to target mutant, oncogenic IDH1, but also inhibits the wild type enzyme at higher doses (Okoye-Okafor et al., 2015). In CTP-WT cells, GSK864 modestly decreased palmitate labeling from glutamine, which was already low. This reduction was offset by an increase in the contribution of glucose to palmitate synthesis (Fig. 7B). In contrast, GSK864 almost completely eliminated the flow of carbon from both glutamine and glucose in the CTP-KO cells (Fig. 7C). Thus, in the absence of CTP, the contribution of both glucose and glutamine is dependent on an IDH1-dependent cytosolic reductive carboxylation pathway. This reductive pathway explains the substantial residual glucose-dependent fatty acid synthesis in CTP-KO cells (Fig. 3B).
Figure 7. Isocitrate dehydrogenase-1 (IDH1) is required for lipogenic acetyl-CoA supply from both glucose and glutamine in CTP-deficient cells.
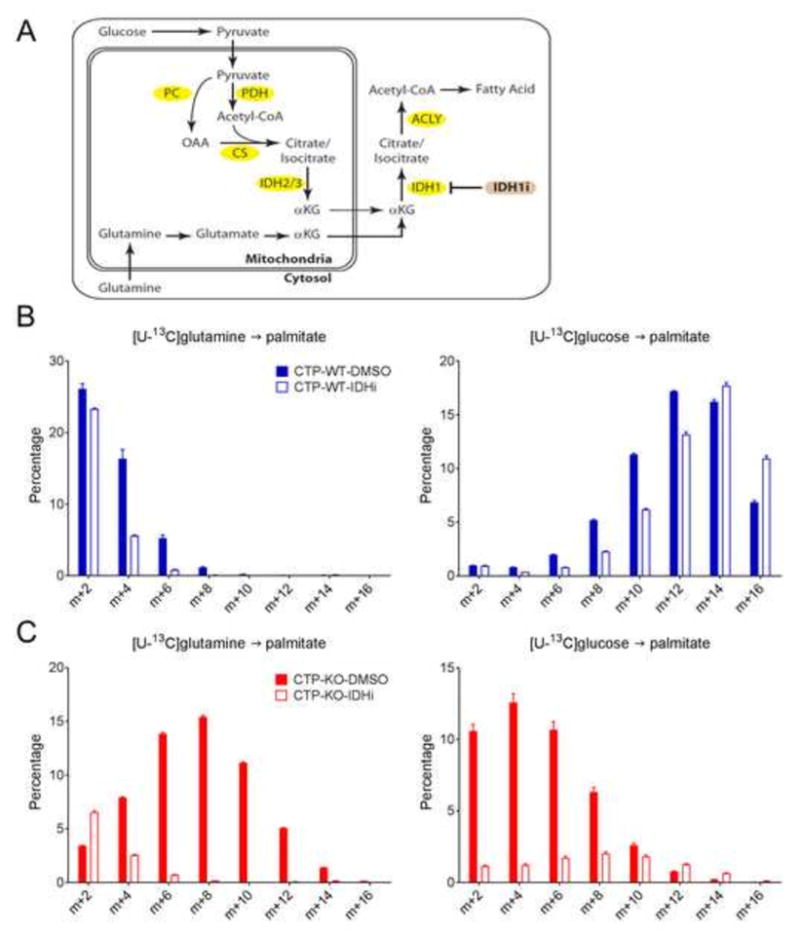
A) Proposed pathways of carbon flow from glucose and glutamine into fatty acids in CTP-deficient cells. Details in text. CS, citrate synthase; IDH1i, IDH1 inhibitor (GSK864).
B) Palmitate MIDs after culture of CTP-WT cells with [U-13C]glutamine or [U-13C]glucose, with or without 15μM IDH1i, followed by saponification of cellular lipids.
C) Palmitate MIDs after culture of CTP-KO cells with [U-13C]glutamine or [U-13C]glucose, with or without 15μM IDH1i, followed by saponification of cellular lipids.
For simplicity, only evenly labeled isotopologues (m+2, m+4, etc.) are shown. Data are displayed as mean ± S.D. n=3 cultures of a representative experiment. All experiments were repeated 3 times.
4. Discussion and conclusions
In this study, we assessed the effects of CTP deficiency on metabolic flux alteration in lung cancer cells using parallel stable isotope tracing experiments. CTP occupies a crucial node of central carbon metabolism, enabling bidirectional citrate transport between the cytosol and mitochondria, thereby participating in regulation of glycolysis, lipogenesis and redox homeostasis. CTP deficiency suppresses cell growth in both conventional monolayer and anchorage-independent culture of human lung cancer cells (Catalina-Rodriguez et al., 2012; Jiang et al., 2016). Our metabolomic assessment revealed widespread alterations of metabolism in CTP-KO cells, particularly reduced abundance of metabolites from the TCA cycle, including malate and citrate/isocitrate. These alterations were observed previously in cells treated with a CTP inhibitor or engineered to express a dominant negative CTP allele (Catalina-Rodriguez et al., 2012). In our study, NAA reduction in CTP-KO cells was the most significant metabolomic feature distinguishing the cell lines from each other. This abnormality is predicted to occur in conditions of reduced availability of acetyl-CoA and aspartate, both of which arise from mitochondrial metabolism. NAA is produced and secreted by human non-small cell lung cancer cells, and has shown potential as a plasma biomarker for lung cancer, particularly in young patients (Lou et al., 2016). High levels of NAT8L, the enzyme that generates NAA, is associated with poor prognosis in several cancer types (Zand et al., 2016), and NAT8L silencing reduces cell proliferation (Weindl et al., 2016). These studies raise the possibility that NAA depletion may contribute to the growth suppressive effects of CTP deficiency.
Other abnormalities in CTP-KO cells included reduced oxidative phosphorylation and enhanced glycolytic metabolism. Elevated glycolysis manifested as increased glucose consumption, lactate secretion and extracellular acidification. Reduced oxidative metabolism was demonstrated by decreased oxygen consumption and, most convincingly, by MFA. CTP-KO cells had a large decrease in flux through citrate synthase and at least modest decreases in other enzymes of the TCA cycle. Reduced TCA cycle flux was likely related to a combination of factors, including reduced carbon entry via PDH, glutaminolysis and malate import through CTP; increased carbon efflux via AKG export; and an increased NADH/NAD+ ratio, which can be the result of impaired electron transport chain function and renders oxidative processing of carbon around the TCA cycle less effective. Evidence for altered oxidative phsophorylation in CTP-KO cells includes the fact that complex I and complex IV of the electron transport chain were both observed to be less active upon CTP inhibition (Catalina-Rodriguez et al., 2012; Smith et al., 2016). An altered redox ratio would also explain why MFA predicted that fatty acid oxidation, typically activated upon PDH inhibition, was reduced in CTP-KO cells. Increased PDH phosphorylation was consistent with the observed reduction in PDH flux. Activity of inhibitory pyruvate dehydrogenase kinases is enhanced by a high NADH/NAD+ ratio, indicating that PDH inhibition may serve as an adaptation to an altered redox state brought about by CTP deficiency (Pettit et al., 1975).
From the perspective of cancer biology, the elevation of 2HG in these cells is particularly interesting. L-and D-2HG are scarce in normal tissues, but both have been implicated as oncometabolites; i.e. they contribute to the process of malignant transformation when present in high quantities (Yang et al., 2013). L-2HG accumulates in body fluids as a result of rare inborn deficiency of L-2HG dehydrogenase, which is associated with an increased risk of brain malignancies in children (Aghili et al., 2009). D-2HG accumulates in tumors with somatic, monoallelic gain of function mutations in isocitrate dehydrogenase-1 or -2 (IDH1, IDH2) (Dang et al., 2009; Ward et al., 2010). These mutant enzymes reduce AKG to D-2HG using NADPH as a cofactor, and D-2HG may reach millimolar levels in the tumor cells (Dang et al., 2009). Both D-2HG and L-2HG influence the activity of a large family of AKG-dependent dioxygenases, many of which function to demethylate histones and DNA, thereby epigenetically regulating gene expression (Chowdhury et al., 2011). In some tumors, expression of mutant IDH1 or IDH2 and accumulation of D-2HG are associated with suppression of genes involved in cellular differentiation, resulting in a molecular phenotype of dedifferentiation (Figueroa et al., 2010; Lu et al., 2012). Further study will be necessary to determine whether the modest 2HG elevations observed in CTP-deficient cells are sufficient to influence dioxygenase activity or gene expression. Nevertheless, our data suggest that one of CTP’s functions is to allow cells to maintain a metabolic state that keeps 2HG at low levels. Of note, L- and D-2HG also accumulate in the setting of altered NADH/NAD+ ratios brought about by mutations in the electron transport chain (Mullen et al., 2014; Reinecke et al., 2012). We speculate that altered redox balance in CTP-deficient cells and human subjects might also contribute to the accumulation of L- and D-2HG.
CTP-KO cells displayed a number of unexpected alterations of metabolic flux, including enhanced activity of PC. We previously determined that PC provides an alternative source of anaplerosis that allows cancer cells to compensate for reduced glutamine catabolism (Cheng et al., 2011), similar to what occurs in CTP-deficient cells. PC’s enzymatic activity is suppressed by glutamate and TCA cycle intermediates, and glutamine deprivation is sufficient to enhance PC activity (Cheng et al., 2011; Scrutton and White, 1974). Here we find that chronic CTP deficiency increases both PC protein expression and flux. Despite the gain in PC flux, citrate synthase activity is much lower in CTP-KO cells, perhaps contributing to the reduced growth of these cells.
Another interesting aspect of CTP-deficient cells was the role of mitochondrial AKG secretion in supplying acetyl-CoA for fatty acid synthesis. Reductive carboxylation of AKG catalyzed by cytosolic IDH1 was enhanced by approximately 60% in CTP-KO cells, and this reaction was supplied by both AKG arising downstream of citrate synthase (CS) and AKG from glutamine catabolism. This insight extends the versatility of reductive carboxylation in supplying fatty acid synthesis, while conventional forms of the reductive carboxylation pathway involve transmission of glutamine-derived carbon into the lipogenic acetyl-CoA pool (Fig. 7A). MFA predicted that CTP loss induces an alternative metabolic state in which carbon from glucose is also transmitted to cytosolic acetyl-CoA via export of AKG from the mitochondria, carboxylation by IDH1 and cleavage of citrate by ATP-citrate lyase (ACLY) (Fig. 7A). This prediction was confirmed by treating CTP-KO cells with an IDH1 inhibitor, which essentially eliminated carbon flow from both glucose and glutamine into the palmitate pool. Remarkably, over 30% of the carbon used for palmitate synthesis is supplied by glucose through this pathway of AKG efflux and IDH1-dependent reductive carboxylation. It is unclear to what extent reductive carboxylation of either glucose- or glutamine-derived AKG contributes to lipogenesis in human tumors, but the data suggest that in some settings, IDH1 inhibition could substantially reduce de novo fatty acid synthesis. It is worth noting that mice with germline deficiency of IDH1 are viable and fertile, suggesting that systemic IDH1 inhibition is tolerated in normal, unstressed tissues (Cairns and Mak, 2013).
In summary, CTP deficiency reprograms central carbon metabolism in cancer cells, and we have quantified many of these effects using metabolic flux analysis. We find CTP to be a major regulator of energy metabolism, anaplerosis, fatty acid synthesis, and 2HG abundance. Further work will determine the relative contributions of these alterations to cell growth and gene expression.
Highlights.
CTP deficient (CTP-KO) cells have suppressed PDH and TCA cycle activity
CTP-KO cells have increased glucose-dependent anaplerosis
CTP-KO cells use cytosolic reductive carboxylation for lipogenesis
Acknowledgments
Angela Zhou assisted in data acquisition and analysis for the metabolomics experiment. Jamey D. Young provided advice related to INCA. Prashant Mishra provided advice related to the Seahorse Cell Mito Stress Test. R.J.D. is supported by grants from the N.I.H (R01CA157996) and Robert A. Welch Foundation (I1733). A.B. was supported by grants from the Oxford University Clinical Academic Graduate School and Jesus College, Oxford.
Footnotes
Publisher's Disclaimer: This is a PDF file of an unedited manuscript that has been accepted for publication. As a service to our customers we are providing this early version of the manuscript. The manuscript will undergo copyediting, typesetting, and review of the resulting proof before it is published in its final citable form. Please note that during the production process errors may be discovered which could affect the content, and all legal disclaimers that apply to the journal pertain.
References
- Aghili M, Zahedi F, Rafiee E. Hydroxyglutaric aciduria and malignant brain tumor: A case report and literature review. J Neurooncol. 2009;91:233–236. doi: 10.1007/s11060-008-9706-2. [DOI] [PubMed] [Google Scholar]
- Antoniewicz MR, Kelleher JK, Stephanopoulos G. Elementary metabolite units (EMU): A novel framework for modeling isotopic distributions. Metab Eng. 2007;9:68–86. doi: 10.1016/j.ymben.2006.09.001. [DOI] [PMC free article] [PubMed] [Google Scholar]
- Brommage R, Liu J, Hansen GM, Kirkpatrick LL, Potter DG, Sands AT, Zambrowicz B, Powell DR, Vogel P. High-throughput screening of mouse gene knockouts identifies established and novel skeletal phenotypes. Bone Res. 2014;2:14034. doi: 10.1038/boneres.2014.34. [DOI] [PMC free article] [PubMed] [Google Scholar]
- Cairns RA, Mak TW. Oncogenic isocitrate dehydrogenase mutations: Mechanisms, models, and clinical opportunities. Cancer Discov. 2013;3:730–741. doi: 10.1158/2159-8290.CD-13-0083. [DOI] [PubMed] [Google Scholar]
- Catalina-Rodriguez O, Kolukula VK, Tomita Y, Preet A, Palmieri F, Wellstein A, Byers S, Giaccia AJ, Glasgow E, Albanese C, Avantaggiati ML. The mitochondrial citrate transporter, CIC, is essential for mitochondrial homeostasis. Oncotarget. 2012;3:1220–35. doi: 10.18632/oncotarget.714. [DOI] [PMC free article] [PubMed] [Google Scholar]
- Chaouch A, Porcelli V, Cox D, et al. Mutations in the Mitochondrial Citrate Carrier SLC25A1 are Associated with Impaired Neuromuscular Transmission. J Neuromuscul Dis. 2014;1:75–90. doi: 10.3233/JND-140021. [DOI] [PMC free article] [PubMed] [Google Scholar]
- Cheng T, Sudderth J, Yang C, Mullen AR, Jin ES, Matés JM, DeBerardinis RJ. Pyruvate carboxylase is required for glutamine-independent growth of tumor cells. Proc Natl Acad Sci U S A. 2011;108:8674–9. doi: 10.1073/pnas.1016627108. [DOI] [PMC free article] [PubMed] [Google Scholar]
- Chowdhury R, Yeoh KK, Tian Y, Hillringhaus L, Bagg EA, Rose NR, Leung IKH, Li XS, Woon ECY, Yang M, McDonough MA, King ON, Clifton IJ, Klose RJ, Claridge TDW, Ratcliffe PJ, Schofield CJ, Kawamura A. The oncometabolite 2-hydroxyglutarate inhibits histone lysine demethylases. EMBO Rep. 2011;12:463–9. doi: 10.1038/embor.2011.43. [DOI] [PMC free article] [PubMed] [Google Scholar]
- Dang L, White DW, Gross S, Bennett BD, Bittinger MA, Driggers EM, Fantin VR, Jang HG, Jin S, Keenan MC, Marks KM, Prins RM, Ward PS, Yen KE, Liau LM, Rabinowitz JD, Cantley LC, Thompson CB, Vander Heiden MG, Su SM. Cancer-associated IDH1 mutations produce 2-hydroxyglutarate. Nature. 2009;462:739–744. doi: 10.1038/nature08617. [DOI] [PMC free article] [PubMed] [Google Scholar]
- Figueroa ME, Abdel-Wahab O, Lu C, Ward PS, Patel J, Shih A, Li Y, Bhagwat N, Vasanthakumar A, Fernandez HF, Tallman MS, Sun Z, Wolniak K, Peeters JK, Liu W, Choe SE, Fantin VR, Paietta E, Löwenberg B, Licht JD, Godley LA, Delwel R, Valk PJM, Thompson CB, Levine RL, Melnick A. Leukemic IDH1 and IDH2 Mutations Result in a Hypermethylation Phenotype, Disrupt TET2 Function, and Impair Hematopoietic Differentiation. Cancer Cell. 2010;18:553–567. doi: 10.1016/j.ccr.2010.11.015. [DOI] [PMC free article] [PubMed] [Google Scholar]
- Jiang L, Shestov Aa, Swain P, Yang C, Parker SJ, Wang Qa, Terada LS, Adams ND, McCabe MT, Pietrak B, Schmidt S, Metallo CM, Dranka BP, Schwartz B, DeBerardinis RJ. Reductive carboxylation supports redox homeostasis during anchorage-independent growth. Nature. 2016;532:255–258. doi: 10.1038/nature17393. [DOI] [PMC free article] [PubMed] [Google Scholar]
- Kolukula VK, Sahu G, Wellstein A, Rodriguez OC, Preet A, Iacobazzi V, D’Orazi G, Albanese C, Palmieri F, Avantaggiati ML. SLC25A1, or CIC, is a novel transcriptional target of mutant p53 and a negative tumor prognostic marker. Oncotarget. 2014;5:1212–25. doi: 10.18632/oncotarget.1831. [DOI] [PMC free article] [PubMed] [Google Scholar]
- Lewis CA, Parker SJ, Fiske BP, McCloskey D, Gui DY, Green CR, Vokes NI, Feist AM, Vander Heiden MG, Metallo CM. Tracing Compartmentalized NADPH Metabolism in the Cytosol and Mitochondria of Mammalian Cells. Mol Cell. 2014;55:253–263. doi: 10.1016/j.molcel.2014.05.008. [DOI] [PMC free article] [PubMed] [Google Scholar]
- Lou TF, Sethuraman D, Dospoy P, Srivastva P, Kim HS, Kim J, Ma X, Chen PH, Huffman KE, Frink RE, Larsen JE, Lewis C, Um SW, Kim DH, Ahn JM, DeBerardinis RJ, White MA, Minna JD, Yoo H. Cancer-specific production of n-acetylaspartate via nat8l overexpression in non-small cell lung cancer and its potential as a circulating biomarker. Cancer Prev Res. 2016;9:43–52. doi: 10.1158/1940-6207.CAPR-14-0287. [DOI] [PMC free article] [PubMed] [Google Scholar]
- Lu C, Ward P, Kapoor G, Rohle D. IDH mutation impairs histone demethylation and results in a block to cell differentiation. Nature. 2012;483:474–478. doi: 10.1038/nature10860.IDH. [DOI] [PMC free article] [PubMed] [Google Scholar]
- Menendez JA, Lupu R. Fatty acid synthase and the lipogenic phenotype in cancer pathogenesis. Nat Rev Cancer. 2007;7:763–777. doi: 10.1038/nrc2222. [DOI] [PubMed] [Google Scholar]
- Metallo CM, Gameiro Pa, Bell EL, Mattaini KR, Yang J, Hiller K, Jewell CM, Johnson ZR, Irvine DJ, Guarente L, Kelleher JK, Vander Heiden MG, Iliopoulos O, Stephanopoulos G. Reductive glutamine metabolism by IDH1 mediates lipogenesis under hypoxia. Nature. 2011;481:380–384. doi: 10.1038/nature10602. [DOI] [PMC free article] [PubMed] [Google Scholar]
- Mullen AR, Hu Z, Shi X, Jiang L, Boroughs LK, Kovacs Z, Boriack R, Rakheja D, Sullivan LB, Linehan WM, Chandel NS, DeBerardinis RJ. Oxidation of alpha-ketoglutarate is required for reductive carboxylation in cancer cells with mitochondrial defects. Cell Rep. 2014;7:1679–1690. doi: 10.1016/j.celrep.2014.04.037. [DOI] [PMC free article] [PubMed] [Google Scholar]
- Mullen AR, Wheaton WW, Jin ES, Chen P-H, Sullivan LB, Cheng T, Yang Y, Linehan WM, Chandel NS, DeBerardinis RJ. Reductive carboxylation supports growth in tumour cells with defective mitochondria. Nature. 2011;481:385–388. doi: 10.1038/nature10642. [DOI] [PMC free article] [PubMed] [Google Scholar]
- Napoli E, Tassone F, Wong S, Angkustsiri K, Simon TJ, Song G, Giulivi C. Mitochondrial citrate transporter-dependent metabolic signature in the 22q11.2 deletion syndrome. J Biol Chem. 2015;290:23240–23253. doi: 10.1074/jbc.M115.672360. [DOI] [PMC free article] [PubMed] [Google Scholar]
- Nota B, Struys EA, Pop A, Jansen EE, Fernandez Ojeda MR, Kanhai WA, Kranendijk M, Van Dooren SJM, Bevova MR, Sistermans EA, Nieuwint AWM, Barth M, Ben-Omran T, Hoffmann GF, De Lonlay P, McDonald MT, Meberg A, Muntau AC, Nuoffer JM, Parini R, Read MH, Renneberg A, Santer R, Strahleck T, Van Schaftingen E, Van Der Knaap MS, Jakobs C, Salomons GS. Deficiency in SLC25A1, encoding the mitochondrial citrate carrier, causes combined D-2- and L-2-hydroxyglutaric aciduria. Am J Hum Genet. 2013;92:627–631. doi: 10.1016/j.ajhg.2013.03.009. [DOI] [PMC free article] [PubMed] [Google Scholar]
- Okoye-Okafor UC, Bartholdy B, Cartier J, Gao EN, Pietrak B, Rendina AR, Rominger C, Quinn C, Smallwood A, Wiggall KJ, Reif AJ, Schmidt SJ, Qi H, Zhao H, Joberty G, Faelth-Savitski M, Bantscheff M, Drewes G, Duraiswami C, Brady P, Groy A, Narayanagari S, Antony-Debre I, Mitchell K, Wang HR, Kao Y, Christopeit M, Carvajal L, Barreyro L, Paietta E, Makishima H, Will B, Concha N, Adams ND, Schwartz B, McCabe MT, Maciejewski J, Verma A, Steidl U. New IDH1 mutant inhibitors for treatment of acute myeloid leukemia. Nat Chem Biol. 2015;11:878–886. doi: 10.1038/nchembio.1930. [DOI] [PMC free article] [PubMed] [Google Scholar]
- Palmieri EM, Spera I, Menga A, Infantino V, Porcelli V, Iacobazzi V, Pierri CL, Hooper DC, Palmieri F, Castegna A. Acetylation of human mitochondrial citrate carrier modulates mitochondrial citrate/malate exchange activity to sustain NADPH production during macrophage activation. Biochim Biophys Acta - Bioenerg. 2015;1847:729–738. doi: 10.1016/j.bbabio.2015.04.009. [DOI] [PubMed] [Google Scholar]
- Palmieri F. The mitochondrial transporter family (SLC25): Physiological and pathological implications. Pflugers Arch Eur J Physiol. 2004;447:689–709. doi: 10.1007/s00424-003-1099-7. [DOI] [PubMed] [Google Scholar]
- Pettit FH, Pelley JW, Reed LJ. Regulation of pyruvate dehydrogenase kinase and phosphatase by acetyl-CoA/CoA and NADH/NAD ratios. Biochem Biophys Res Commun. 1975;65:575–582. doi: 10.1016/S0006-291X(75)80185-9. [DOI] [PubMed] [Google Scholar]
- Prasun P, Young S, Salomons G, Werneke A, Jiang Y, Struys E, Paige M, Avantaggiati ML, McDonald M. Expanding the Clinical Spectrum of Mitochondrial Citrate Carrier (SLC25A1) Deficiency: Facial Dysmorphism in Siblings with Epileptic Encephalopathy and Combined D,L-2-Hydroxyglutaric Aciduria. JIMD Rep. 2015;19:111–115. doi: 10.1007/8904. [DOI] [PMC free article] [PubMed] [Google Scholar]
- Rakheja D, Mitui M, Boriack RL, Deberardinis RJ. Isocitrate Dehydrogenase 1 / 2 Mutational Analyses and 2-Hydroxyglutarate Measurements in Wilms Tumors. 2011:379–383. doi: 10.1002/pbc. [DOI] [PubMed] [Google Scholar]
- Reinecke CJ, Koekemoer G, van der Westhuizen FH, Louw R, Lindeque JZ, Mienie LJ, Smuts I. Metabolomics of urinary organic acids in respiratory chain deficiencies in children. Metabolomics. 2012;8:264–283. doi: 10.1007/s11306-011-0309-0. [DOI] [Google Scholar]
- Scrutton MC, White MD. Pyruvate Carboxylase: INHIBITION OF THE MAMMALIAN AND AVIAN LIVER ENZYMES BY α-KETOGLUTARATE AND l-GLUTAMATE. J Biol Chem. 1974;249:5405–5415. [PubMed] [Google Scholar]
- Smith A, McBride S, Marcadier JL, Michaud J, Line OYA-D, Schwartzentruber J, Beaulieu CL, Katz SL, Consortium FC, Majewski J, Bulman DE, Geraghty MT, Harper ME, Chakraborty P, Lines MA. Severe Neonatal Presentation of Mitochondrial Citrate Carrier (SLC25A1) Deficiency. JIMD Rep. 2016 doi: 10.1007/8904. [DOI] [PMC free article] [PubMed] [Google Scholar]
- Taylor P, Zhao D, Li F, Cheng Z, Zhao D, Li F, Cheng Z, Lei Q. Impact of acetylation on tumor metabolism. 2014;3556:37–41. doi: 10.4161/23723548.2014.963452. [DOI] [PMC free article] [PubMed] [Google Scholar]
- Ward PS, Patel J, Wise DR, Abdel-Wahab O, Bennett BD, Coller HA, Cross JR, Fantin VR, Hedvat CV, Perl AE, Rabinowitz JD, Carroll M, Su SM, Sharp KA, Levine RL, Thompson CB. The Common Feature of Leukemia-Associated IDH1 and IDH2 Mutations Is a Neomorphic Enzyme Activity Converting α-Ketoglutarate to 2-Hydroxyglutarate. Cancer Cell. 2010;17:225–234. doi: 10.1016/j.ccr.2010.01.020. [DOI] [PMC free article] [PubMed] [Google Scholar]
- Weindl D, Cordes T, Battello N, Sapcariu SC, Dong X, Wegner A, Hiller K. Bridging the gap between non-targeted stable isotope labeling and metabolic flux analysis. Cancer Metab. 2016;4:10. doi: 10.1186/s40170-016-0150-z. [DOI] [PMC free article] [PubMed] [Google Scholar]
- Wellen KE, Hatzivassiliou G, Sachdeva UM, Bui TV, Cross JR, Thompson CB. ATP-Citrate Lyase Links Cellular Metabolism to Histone Acetylation. Science (80-) 2009;324:1076–1080. doi: 10.1126/science.1164097. [DOI] [PMC free article] [PubMed] [Google Scholar]
- Xia J, Sinelnikov IV, Han B, Wishart DS. MetaboAnalyst 3.0--making metabolomics more meaningful. Nucleic Acids Res. 2015;43:W251–7. doi: 10.1093/nar/gkv380. [DOI] [PMC free article] [PubMed] [Google Scholar]
- Xiong Y, Guan K-L. Mechanistic insights into the regulation of metabolic enzymes by acetylation. J Cell Biol. 2012;198:155–64. doi: 10.1083/jcb.201202056. [DOI] [PMC free article] [PubMed] [Google Scholar]
- Yang C, Ko B, Hensley CT, Jiang L, Wasti AT, Kim J, Sudderth J, Calvaruso MA, Lumata L, Mitsche M, Rutter J, Merritt ME, DeBerardinis RJ. Glutamine oxidation maintains the TCA cycle and cell survival during impaired mitochondrial pyruvate transport. Mol Cell. 2014;56:414–424. doi: 10.1016/j.molcel.2014.09.025. [DOI] [PMC free article] [PubMed] [Google Scholar]
- Yang M, Soga T, Pollard PJ. Oncometabolites: linking altered metabolism with cancer. J Clin Invest. 2013;123:3652–3658. doi: 10.1172/JCI67228. [DOI] [PMC free article] [PubMed] [Google Scholar]
- Young JD. INCA: A computational platform for isotopically non-stationary metabolic flux analysis. Bioinformatics. 2014;30:1333–1335. doi: 10.1093/bioinformatics/btu015. [DOI] [PMC free article] [PubMed] [Google Scholar]
- Young JD, Walther JL, Antoniewicz MR, Yoo H, Stephanopoulos G. An elementary metabolite unit (EMU) based method of isotopically nonstationary flux analysis. Biotechnol Bioeng. 2008;99:686–99. doi: 10.1002/bit.21632. [DOI] [PubMed] [Google Scholar]
- Zand B, Previs RA, Zacharias NM, Rupaimoole R, Mitamura T, Nagaraja AS, Guindani M, Dalton HJ, Yang L, Baddour J, Achreja A, Hu W, Pecot CV, Ivan C, Wu SY, McCullough CR, Gharpure KM, Shoshan E, Pradeep S, Mangala LS, Rodriguez-Aguayo C, Wang Y, Nick AM, Davies MA, Armaiz-Pena G, Liu J, Lutgendorf SK, Baggerly KA, Eli MB, Lopez-Berestein G, Nagrath D, Bhattacharya PK, Sood AK. Role of Increased n-acetylaspartate Levels in Cancer. J Natl Cancer Inst. 2016;108 doi: 10.1093/jnci/djv426. djv426. [DOI] [PMC free article] [PubMed] [Google Scholar]