

Abstract
Composition, functional properties and in vitro antioxidant activities of octopus (Octopus vulgaris) protein hydrolysates (OPHs) were evaluated. OPHs were prepared by treatment with commercial Esperase (OPH-Esp), alkaline protease extract from Zebra blenny (Salaria basilica) (OPH-ZB) and enzyme preparation from Bacillus subtilis A26 (OPH-A26). OPHs showed different degrees of hydrolysis (DH from 17.6 to 21%), and hydrophobic/hydrophilic peptide ratio. The amino acid profiles of OPHs showed a high level of essential amino acids, and Lys was the most abundant amino acid. Enzymatic hydrolysis improved solubility significantly as well as emulsifying and foaming properties of octopus proteins. The emulsifying activity index of OPHs decreased with increasing concentrations. Conversely, the foaming abilities increased as the hydrolysate concentrations increased. For the antioxidant activities, five different in vitro assay systems were investigated. All hydrolysates displayed various degrees and dose dependant antioxidant activities. The highest DPPH scavenging activity and reducing power were achieved by OPH-A26. OPH-Esp displayed the highest ability to prevent the bleaching of β-carotene, whereas OPH-ZB exhibited the highest protection against hydroxyl radical induced DNA breakage. The results suggested that OPHs could be used, as a promising source of functional peptides with antioxidant activities, to formulate functional foods.
Keywords: Octopus, Enzymatic hydrolysis, Antioxidant activities, Functional properties
Introduction
Reactive oxygen species (ROS) are highly reactive molecules containing oxygene with unpaired electrons. They are involved in the occurrence of numerous chronic diseases such as Alzheimer’s, diabetes, cardiovascular diseases, neurodegenerative disorders and cancer (Aruoma 1998). Moreover, oxidation of fatty acids and lipids or rancidity and the formation of undesirable secondary lipid peroxidation products induced by free radicals also leads to the deterioration of food quality (Kristinsson and Rasco 2000).
Therefore, antioxidants are used to preserve food products and retard the oxidation and peroxidation processes (Lobo et al. 2010). Synthetic commercial antioxidants such as butylated hydroxyanisole (BHA), butylated hydroxytoluene, t-butylhydroquinone, and propyl gallate have been widely used in stabilization of food and pharmaceutical industries. However, these synthetic antioxidants represent potential health hazards and their use must be under strict regulation. Hence, there is a growing interest in the food industry as well as pharmaceutical industry, for the development of new and safe antioxidants from natural sources, especially peptides derived from hydrolyzed food proteins.
Nowadays, a considerable interest has been expressed regarding marine-derived bioactive peptides obtained from marine organisms that can promote the state of health. Marine bioactive peptides may be produced by enzymatic hydrolysis, or microbial fermentation of food proteins. However, the enzymatic hydrolysis is the commonly preferred method for peptide production, especially in food and pharmaceutical industries, because of lack of residual organic solvents or toxic chemicals in the products. Furthermore, biopeptides generated by enzymatic hydrolysis were considered to be safe and healthy.
Protein hydrolysates from marine organism species have been found to possess antioxidant activities, such as goby (Zosterisessor ophiocephalus) (Nasri et al. 2014), Pangasisus hypophthalmus by-products (Thuy et al. 2015), sardine (S. pilchardus) and horse mackerel (T. mediterraneus) (Morales-Medina et al. 2016).
To the best of our knowledge, there are no reports on bioactivity of protein hydrolysates from Octopus (Octopus vulgaris). The octopus is common in the Mediterranean and Eastern Atlantic Sea. It is relatively important in the fish catches of Tunisia, and is utilized for human consumption. So far, no information regarding bioactive peptides from the Octopus hydrolyste have been documented.
Therefore the objective of the present study was to produce and characterize protein hydrolysates from octopus (OPHs) using several proteases and to study their compositions, functionality in terms of solubility, emulsifying, foaming properties, water and oil-holding capacity and antioxidant activities.
Materials and methods
Reagents
1,1-Diphenyl-2-picrylhydrazyl (DPPH), butylated hydroxyanisole (BHA), ethylenediaminetetraacetic acid (EDTA), β-carotene, and linoleic acid were purchased from Sigma Chemical Co. (St. Louis, MO, USA). Sodium dodecyl sulphate (SDS) was from Bio-Rad laboratories (Hercules, CA, USA). All other chemicals, namely potassium ferricyanide (K3[Fe(CN)6]), trichloroacetic acid (TCA), ferrous chloride (FeCl2), ferrozine, sodium hydroxide (NaOH), ferric chloride (FeCl3), hydrogen peroxide (H2O2), Tween 80, ascorbic acid and other solvents, were of analytical grade. All solutions were freshly prepared in distilled water.
Materials
Octopus (Octopus vulgaris) and zebra blenny (Salaria basilisca) were freshly purchased from the fish market of Sfax City, Tunisia. The samples were packed in polyethylene bags, placed in ice and transported to the research laboratory within 30 min. The octopus was cleaned; muscle was separated, rinsed with cold distilled water, and then stored in sealed plastic bags at −20 °C until they were used for protein hydrolysates production. Viscera from zebra blenny were used immediately for crude alkaline enzyme extraction.
Proteolytic enzymes
Endogenous alkaline proteases from zebra blenny viscera were obtained according to the following protocol: viscera (150 g) from zebra blenny were thoroughly washed with distilled water and then homogenized for 1 min with 300 ml of extraction buffer (10 mM Tris–HCl, pH 8.0). The homogenate was centrifuged at 288 x g for 30 min at 4 °C. The pellet was discarded and supernatant, referred to as alkaline protease extract, was collected.
Esperase® was supplied by Novozymes® (Bagsvaerd, Denmark). Proteases from B. subtilis A26 were prepared in our laboratory and were carried out in optimized medium of microbial strain (Agrebi et al. 2009).
Protease activity was determined according to the method of Kembhavi et al. (1993) using casein as a substrate under standard conditions. One unit of protease activity was defined as the amount of enzyme required to liberate 1 µg of tyrosine per minute under the experimental conditions used.
Preparation of octopus protein hydrolysates (OPHs)
Octopus muscle (500 g), in 1000 ml distilled water, was first cooked for 20 min at 90 °C to inactivate endogenous enzymes. The cooked muscle was then homogenized in a Moulinex® blender for about 2 min. The samples were hydrolyzed with various proteases at their respective optimum hydrolysis conditions: crude enzyme extract from zebra blenny viscera and enzyme preparation from B. subtilis at pH 8.0, 45 °C and Esperase at pH 9.0, 50 °C. The protein solutions were allowed to equilibrate for 30 min before hydrolysis was initiated. After reaching the equilibrium, the hydrolysis reaction was started by the addition of enzyme at a 1:3 (U/mg) enzyme:protein ratio. Enzymes were used at the same activity levels to compare hydrolytic efficiencies. During the reaction, the pH of the mixture was maintained at the desired value by continuous addition of 4 N NaOH solution. After incubation for 480 min, the reaction was stopped by heating the mixture for 20 min at 80 °C to inactivate enzymes. Octopus protein hydrolysates were then centrifuged at 288 x g for 20 min to separate soluble and insoluble fractions. Finally, the soluble fractions, referred to as protein hydrolysates, were freeze-dried (Moduloyd-230, ThermoFisher Scientific, USA) and then stored at −20 °C for further use.
The hydrolysates obtained with the crude alkaline protease extract from zebra blenny, enzyme preparation from B. subtilis A26, and Esperase were referred to OPH-ZB, OPH-A26, and OPH-Esp, respectively. Undigested octopus proteins (UOP) (cooked extract), and the uncooked extract were used as controls.
The degree of hydrolysis, defined as the percent ratio of the number of peptide bonds broken to the total number of peptide bonds per unit weight, in each case, was calculated from the amount of base (NaOH) added to keep the pH constant during the hydrolysis, as described by Adler-Nissen (1986).
Determination of chemical composition of OPHs
Moisture and ash contents of OPHs were determined according to the AOAC methods 930.15 and 942.05, respectively (AOAC 2000). The protein content was determined by estimating its total nitrogen content by kjeldhal method according to the AOAC method number 984.13(AOAC 2000). A factor of 6.25 was used to convert the nitrogen value to protein. Lipids were determined gravimetrically after Soxhlet extraction of dried samples with hexane. All measurements were performed in triplicate. The protein, ash and fat contents were expressed on a dry weight basis.
Color parameters
OPHs color was evaluated using a Color Flex spectrocolorimeter (Hunter Associates Laboratory Inc., Reston, VA, USA) and reported as L*, a* and b* values, in which L* is a measure of lightness, a* represents the chromatic scale from green to red and b* represents the chromatic scale from blue to yellow (Jamilah and Harvinder 2002). The sample was filled in a 64 mm glass sample cup with three readings in the same place and triplicate determinations were taken per sample. The white tile and black glass were used to standardize the equipment.
Determination of amino acid composition
OPH samples were hydrolyzed with 0.5 ml of 6 N HCl for 24 h at 112 °C on a heating block, and then filtered through a 0.45 µm membrane filter prior to analysis. An aliquot (10 µl) of each treated sample was derivatized 6-aminoquinolyl-N-hydroxysuccinimidyl carbamate Waters AccQ·Fluor Reagent Kit (according to Waters AccQ·Tag Chemistry Package Instruction Manual). Amino acids were separated using a reversed phase high performance liquid chromatography (1200 Agilent Tech., CA, USA) equipped with a Pico Tag column (3.9 x 300 mm, 5 µm, Waters). The amount of amino acids was calculated, based on the peak area in comparison with that of standard. The amino acid content was expressed as a percentage of total amino acids in the sample. All analyses were performed in duplicate.
Reversed-phase high performance liquid chromatography (RP-HPLC)
The hydrophobicity of peptides from OPHs was studied by reversed phase HPLC using an Agilent 1100 HPLC system (Agilent Technologies, Palo Alto, CA, USA). The column used in this experiment was a Symmetry C18 (4.6 × 250 mm, 5 μm) from Waters Co. (Milford, MA, USA). Solvent A was TFA in double distilled water (0.1%, v/v) and solvent B contained TFA (0.085%, v/v) in acetonitrile (ACN): double distilled water (60:40, v/v). Both mobile phases A and B were filtered through a 0.45 μm nylon membrane filter and degassed prior to any analytical run. Peptides were first eluted with 100% solvent A for 2 min, followed by a linear gradient from 100% A to 25% of solvent B during 30 min and then, the solvent B increased up to 60% during 15 min. The flow rate was 1 ml/min. The separation was monitored at a wavelength of 214 nm.
Molecular weight distribution
The molecular mass distribution of the octopus protein hydrolysates was determined by size exclusion chromatography (SEC), using a Sephadex G-25 gel filtration column (2.9 cm × 53 cm) in order to fractionate the peptides according to their molecular mass (5 ml aliquot of 1 g/ml). Fractions of 5 ml were collected at a flow rate of 30 ml/h and the absorbance was monitored at 214 nm. The column was calibrated with standard proteins from Sigma Chemicals: albumin (60,000 Da), cytochrome C (12,400 Da), insulin (5800 Da), B12 vitamin (1570.9 Da) and glutathione (307.3 Da). All standards were loaded separately. A calibration curve was obtained by plotting log molecular weight vs peak elution time. The average molecular weight of protein hydrolysate was determined from the standard curve. Determinations were performed in triplicate and data correspond to mean values. Standard deviations were in all cases lower than 5%.
Determination of functional properties
Protein solubility
Solubility of OPHs was carried out over a wide range of pH 1.0 to pH 10.0 as described by Tsumura et al. (2005). Samples of OPHs (200 mg) were dispersed in 20 ml of distilled water, and the pH of the mixture was adjusted from 1.0 to 10.0 with either 6 N HCl or 6 N NaOH solutions. The mixtures were then stirred for 10 min at room temperature, and then centrifuged at 288 x g for 15 min at 4 °C. After appropriate dilution, the protein content in the supernatant was determined by the biuret method (Gornall et al. 1949). Solubility analysis was carried out in triplicate.
Protein solubility was calculated using the following formula:
Foaming properties
Foam expansion (FE) and foam stability (FS) of OPHs solutions were determined according to the method of Shahidi et al. (1995). Fifty milliliters of solution at different concentrations (0.5, 1 and 2%; w/v) were homogenized using a Moulinex-R62 homogenizer to incorporate the air for 1 min at room temperature (25 ± 1 °C). The whipped sample was then immediately transferred into a 100 ml graduated cylinder, and the total volume was recorded immediately (at 0 min) and 30 min after whipping. Foam expansion, expressed as percentage of volume increase after homogenization at 0 min, was calculated according to the following equation:
Foam stability was calculated as the volume of foam remaining after 30 min.
where V T is the total volume after whipping at 0 min (ml); V 0 is the volume before whipping (ml); V t is the total volume after leaving at room temperature (30 min) (ml). All determinations are means of at least two measurements.
Emulsifying properties
The emulsion activity index (EAI) and the emulsion stability index (ESI) of OPHs were determined according to the method of Pearce and Kinsella (1978) with a slight modification. Briefly, OPHs solutions were prepared by dissolving freeze-dried hydrolysates in distilled water at 60 °C for 30 min. Thirty milliliters of OPHs solutions at different concentrations (0.5, 1 and 2%; w/v) were homogenized with 10 ml of soybean oil for 1 min at room temperature (25 ± 1 °C) using Moulinex-R62 homogenizer. Aliquots of the emulsion (50 µl) were taken from the bottom of the container at 0 and 10 min after homogenization, and diluted 100-fold with 0.1% SDS solution. The mixtures were mixed thoroughly for 10 s using a vortex mixer. The absorbance of the diluted solutions was measured at 500 nm using a spectrophotometer (T70, UV/VIS spectrometer, PG Instruments Ltd, China). The absorbances measured immediately (A 0) and 10 min (A 10) after emulsion formation, were used to calculate EAI and ESI. All determinations are triplicated.
where A and A10 represent the absorbance at time 0 and 10, respectively; N represents the dilution factor; C represents protein concentration (g/ml); Ø is the oil volumetric fraction (0.25).
Water-holding and oil-binding capacities
Water-holding capacity (WHC) was determined according to the method of Okezie and Bello (1988) with slight modifications. The sample (0.5 g) of OPHs was dispersed in 50 ml of distilled water and mixed for 2 min. The mixture was kept at room temperature for 30 min and then centrifuged at 5000 rpm for 30 min. The supernatant was filtered through Whatman No. 1 filter paper and the volume recovered was accurately measured. The difference between the initial volume of distilled water added to the protein sample and the volume of the supernatant was determined and the result was reported as milliliters of water absorbed per gram of protein.
Oil-binding capacity (OBC) of OPHs was determined as described by Shahidi et al. (1995) with a slight modification. A 0.5 g of OPHs was mixed with 10 ml of corn oil in a 50 ml centrifuge tube. The mixture was kept for 30 min at room temperature (25 ± 1 °C) with mixing every 10 min, and then centrifuged for 25 min at 2000 rpm. Free oil was then decanted and the fat absorption of the sample was determined from the weight difference. This test was performed in triplicate and fat absorption was reported in terms of milliliters of the fat absorbed per gram of protein. Fat adhesion to walls in the tube was evaluated in an empty tube.
Determination of antioxidant activity
DPPH radical-scavenging activity
DPPH radical-scavenging activity of the hydrolysates was determined as described by Bersuder et al. (1998). A volume of 500 μl of each sample at different concentrations (1–6 mg/ml) was mixed with 375 μl of 99.5% ethanol and 125 μl of DPPH solution (0.02% in ethanol). The mixtures were then kept at room temperature in the dark for 60 min. Scavenging capacity was measured spectrophotometrically by monitoring the decrease in absorbance at 517 nm using a UV–Visible spectrophotometer (T70, UV/VIS spectrometer, PG Instruments Ltd., China). In its radical form, DPPH radical has an absorption band at 517 nm which disappears upon reduction by an antiradical compound. Lower absorbance of the reaction mixture indicated higher DPPH free radical-scavenging activity. The DPPH radical scavenging activity was calculated as follows:
where A control is the absorbance of the control reaction and A sample is the absorbance of OPHs. BHA was used as positive control. The experiment was carried out in triplicate.
β-carotene-linoleate bleaching assay
The ability of OPHs to prevent bleaching of β-carotene was determinate as described by Koleva et al. (2002). 0.5 mg β-carotene in 1 ml chloroform was mixed with 25 μl of linoleic acid and 200 μl of Tween-80. The chloroform was completely evaporated under vacuum in a rotator evaporator at 50 °C, then 100 ml of bidistilled water was added, and the resulting mixture was vigorously stirred. The emulsion obtained was freshly prepared before each experiment. Aliquots of the β-carotene-linoleic acid emulsion (2.5 ml) were transferred to test tubes containing 0.5 ml of each sample of OPHs at different concentrations. The tubes were immediately placed in water bath and incubated at 50 °C for 2 h. Thereafter, the absorbance of each sample was measured at 470 nm. Ablank consisted of 0.5 ml of distilled water instead of the sample solution. The antioxidant activity was evaluated in terms of bleaching of β-carotene using the following formula:
where A0S and A0b are the absorbance measured at zero time of incubation for the test sample and the blank, respectively. A120S and A120b are the absorbance of the sample and the blank, respectively, after incubation for 120 min. The same procedure was repeated with BHA as positive control. The test was carried out in triplicate
Ferrous (Fe2+) ion-chelating activity
The chelating activity of samples towards ferrous ion (Fe2+) was determined according to the method of Dinis et al. (1994). A volume (0.5 ml) of each solution of OPH at different concentrations (0.2–1 mg/ml) was mixed with 1.6 ml of distilled water and 0.05 ml of FeCl2.4H2O (2 mM). The mixtures were incubated at room temperature for 3 min. The reactions were initiated by the addition of 0.1 ml of 5 mM 3-(2-pyridyl)-5,6-bis(4-phenyl-sulfonicacid)-1,2,4-triazine (ferrozine) and incubated for 15 min at room temperature. The mixture was allowed to react for 10 min at room temperature. The absorbance was then measured at 562 nm. The control was conducted in the same manner except that distilled water was used instead of the sample. EDTA was used as positive control. The ferrous ion chelating activity (%) was calculated as follows:
where A control is the absorbance of the control reaction and A sample is the absorbance of the sample. The test was carried out in triplicate.
Reducing power assay
The ability of OPHs to reduce iron (III) was determined according to the method of Yıldırım et al. (2001). An aliquot of 1 ml sample of each hydrolysate at different concentrations (1–5 mg/ml) was mixed with 2.5 ml of 0.2 M phosphate buffer (pH 6.6) and 2.5 ml of 1% (w/v) potassium ferricyanide solution. The mixtures were incubated for 30 min at 50 °C. After incubation, 2.5 ml of 10% (w/v) TCA was added and the reaction mixtures were then centrifuged for 10 min at 10,000g. Finally, 2.5 ml of the supernatant solution of each sample mixture was mixed with 2.5 ml of distilled water and 0.5 ml of 0.1% (w/v) ferric chloride. After a-10 min reaction time, the absorbance of the resulting solutions was measured at 700 nm. Higher absorbance of the reaction mixture indicated higher reducing power of protein hydrolysates. The control was prepared using distilled water instead of the sample. The test was carried out in triplicate.
DNA nicking assay
DNA nicking assay was performed using pCRII™TOPO plasmid (Invitrogen) by the method of Lee et al. (2002). A volume of 10 μl of OPHs at the concentration of 2 mg/ml was added to 2 μl of plasmid DNA (0.5 μg/well). The mixtures were incubated for 10 min at room temperature followed by the addition of 10 μl of Fenton’s reagent (40 mM H2O2, 50 μM l-ascorbic acid and 80 μM FeCl3). The mixtures were then incubated for 5 min at 37 °C. The DNA was analyzed on 1% (w/v) agarose gel.
Statistical analysis
Statistical analyses were performed with SPSS ver.17.0, professional edition using ANOVA analysis. Differences were considered significant at p < 0.05. All tests were carried out in triplicate.
Results and discussion
Preparation of protein hydrolysates
In this study, proteases extracted from viscera of zebra blenny, B. subtilis A26 and Esperase were used. The hydrolysis curves of proteins, were characterised by a high rate of hydrolysis during the first 30 min, which subsequently decreased with reaction time until reaching a steady-state phase where no apparent hydrolysis took place (Fig. 1). The highest hydrolysis degree (21%) after 480 min was obtained with crude protease prepared from B. subtilis A26 followed by Esperase (18%), while crude protease extract from zebra blenny viscera presented the lowest DH (17.6%). The differences in DH values are essentially due to the differences in the specificity of enzymes used during hydrolysis. Hydrolysis curves with similar shape were obtained from grass goby fish (Nasri et al. 2014), sardinelle (Ben Khaled et al. 2011) and defatted Camellia oleifera seed cake (Li et al. 2012).
Fig. 1.

Hydrolysis curves of octopus proteins treated with crude enzyme extract from zebra blenny (OPH-ZB), crude enzyme preparation from B. subtilis A26 (OPH-A26), and commercial enzyme Esperase (OPH-Esp)
Chemical composition
The chemical composition of undigested Octopus proteins (UOP) was determined and compared with those of hydrolysates. As reported in Table 1, the raw material (UOP) contains high amount of proteins (80.99%). All OPHs showed high and similar content of proteins (70.01–72.76%), and therefore could be considered for protein supplements to human. These results were in the range of values mentioned by Šližytė et al. (2005). It is important to note that OPHs have relatively low lipid content, ranging from 0.61 to 1.11% which were lower than that of UOP (3.03%). The low lipid contents in the OPHs are requested in order to increase its stability towards lipid oxidation. Ash content ranged from 17.96 to 23.8%. OPH-A26, which exhibited the highest DH, had high ash content (23.8%). These results are also confirmed by other studies which showed that ash content in fish hydrolysates increases with the increase of DH as it could be explained by the increase of the volume of NaOH added to keep pH constant during enzymatic hydrolysis (Nasri et al. 2014).
Table 1.
Chemical constituents and comparative amino acid profiles of the uncooked muscle, UOP and OPHs (residue/100 amino acid residues)
| Uncooked | UOP (cooked) | OPH-ZB | OPH-A26 | OPH-Esp | |
|---|---|---|---|---|---|
| Composition (%) | |||||
| Protein | 80.99 ± 0.31a | 72.76 ± 0.25b | 70.01 ± 0.01d | 71.6 ± 0.3c | |
| Fat | 3.035 ± 0.005a | 1.11 ± 0.1b | 0.72 ± 0.02c | 0.61 ± 0.01c | |
| Ash | 11.37 ± 0.37c | 17.96 ± 0.04b | 23.8 ± 0.19a | 18.40 ± 0.21b | |
| Moisture | 4.56 ± 0.007d | 8.11 ± 0.13a | 5.45 ± 0.05c | 9.43 ± 0.52b | |
| Color | |||||
| L* | 64.1 ± 1.03a | 55.28 ± 0.02b | 51.76 ± 0.07b | 44.44 ± 0.12c | |
| a* | 7.27 ± 0.06b | 6.3 ± 0.01c | 5.71 ± 0.12c | 10.7 ± 0.33a | |
| b* | 8.86 ± 0.11d | 11.89 ± 0.06a | 10.78 ± 0.015b | 11.41 ± 0.11c | |
| Amino acids | |||||
| Hydrophilic amino acids | |||||
| Aspartic acid (Asp) | 9.274 | 9.861 | 9.911 | 9.596 | 9.8 |
| Glutamic acid (Glu) | 13 | 13.836 | 14.417 | 14.349 | 14.32 |
| Serine (Ser) | 4.115 | 4.691 | 4.572 | 4.603 | 4.9 |
| Glycine (Gly) | 8.406 | 6.228 | 6.547 | 7.407 | 7.54 |
| Histidine*(His) | 7.508 | 1.834 | 1.8 | 1.702 | 1.68 |
| Arginine (Arg) | 6.289 | 5.75 | 5.094 | 5.571 | 5.668 |
| Threonine* (Thr) | 4.439 | 5.313 | 4.869 | 4.643 | 4.21 |
| Tyrosine (Tyr) | 5.661 | 3.349 | 3.073 | 2.893 | 3.03 |
| Lysine* (Lys) | 4.669 | 13.326 | 13.52 | 12.746 | 12.97 |
| Hydrophobic amino acids | |||||
| Proline (Pro) | 7.539 | 8.122 | 9.22 | 9.946 | 9.16 |
| Alanine (Ala) | 5.104 | 5.295 | 5.602 | 5.728 | 5.27 |
| Valine* (Val) | 3.216 | 4.343 | 4.188 | 4.006 | 4.03 |
| Methionine* (Met) | 2.793 | 2.569 | 2.469 | 2.391 | 2.31 |
| Isoleucine* (Ileu) | 6.063 | 4.74 | 4.468 | 4.424 | 4.03 |
| Leucine* (Leu) | 6.501 | 7.157 | 7.208 | 7.008 | 7.12 |
| Phenyl alanine* (Phe) | 5.431 | 3.581 | 3.127 | 3.028 | 4.03 |
| ∑AA | 100 | 100 | 100 | 100 | 100 |
| ∑EAA | 40.62 | 42.86 | 41.65 | 39.95 | 40.38 |
Asx = Asp + Asn; Glx = Glu + Gln
∑AA, total amino acids; ∑EAA, total essential amino acids
Different letters in the same line indicate significant differences (a > b > c > d; p < 0.05)
Octopus protein hydrolysates were obtained by treatment with crude enzyme extract from zebra blenny viscera (OPH-ZB), crude enzyme preparation from B. subtilis A26 (OPH-A26), and commercial enzyme Esperase (OPH-Esp). UOP: Undigested octopus proteins
* Essential amino acids
Color parameters
Color influences the overall acceptability of foods products. Color values of UOP and OPHs, expressed in terms of L*, a* and b*, are shown in Table 1. UOP showed the highest L*value (L* = 64.1) and the lowest b* (b* = 8.86) value, comparing to the protein hydrolysates. However, hydrolysis resulted in increased enzymatic browning reactions. As shown, OPHs turned brownish and their L* values decreased, where OPH-Esp was the darkest (L* = 44.44) and the more reddish hydrolysate (a* = 10.7 and b* = 11.41). Enzymatic browning reactions were assumed to have contributed to the reduction in the luminosity, giving a darker color for hydrolysates. These results appear to indicate that color of protein hydrolysates is affirmatively influenced by enzymatic treatment and the color of initial commercial enzymes. In fact, enzymes extracts with a dark color contributed to the brownish color of the resulting hydrolysate. In addition, the dark color of fish protein hydrolysate was probably a result of oxidation of myoglobin of the raw material (Benjakul and Morrissey 1997).
Amino acid compositions
The amino acid compositions of uncooked muscle, UOP (cooked muscle) and the freeze-dried hydrolysates, expressed as residue/100 residues are shown in Table 1. The amino acid profile of uncooked extract revealed that Tyr, His, and Phe were higher than those recorded in the cooked extract. This may be due to the effect of heat treatment applied for the endogenous enzymes inactivation. In addition, OPHs showed a high level of essential amino acids (39.95–41.65%). It is obviously shown that all samples contained almost all the essential and non-essential amino acids. Lys, Glx and Asx were the most abundant amino acids. Pro, Leu and Gly were also present in relatively high amounts. The percentages of amino acids between OPHs are slightly different, which may be attributed to the differences in the specificity of the enzyme applied. Under the conditions of acid hydrolysis, tryptophane was destroyed, and thus it was not detected.
Leucine, isoleucine, valine, lysine, methionine, threonine, histidine and phenylalanine are the eight key amino acids that were detected in the hydrolysate products. These amino acids are essential to be present in foods. Furthermore, the presence of Pro, Asp and Glu in large amounts in the OPHs revealed that these hydrolysates might exhibit potent antioxidant abilities. In fact, it is known that Pro is often included in potent antioxidant peptides (Elias et al. 2008). In addition, Saiga et al. (2003) reported that Asp and Glu have shown good antioxidant properties.
RP-HPLC characterization
Wilding et al. (1984) reported that the hydrophilic/hydrophobic peptide ratio is the most important factor influencing functional properties such as foaming and emulsifying capacity; RP-HPLC is the most appropriate method employed to separate peptides in protein hydrolysates and provides some indication on their hydrophobicity and hydrophilicity (Lemieux et al. 1991). The RP-HPLC elution profiles of protein hydrolysates are presented in Fig. 2. Several peaks are detectable by RP-HPLC, illustrating the heterogeneous composition of OPHs. There is a slight difference between the three hydrolysates since they are rich in both hydrophobic and hydrophilic peptides. Peptide distributions of OPH-Esp and OPH-A26 were similar. Both hydrolysates contain more earlier-eluting hydrophilic peptides than OPH-ZB, while OPH-ZB contained more late-eluting hydrophobic peptides. The slight differences in RP-HPLC profiles of OPHs are essentially due to the difference in the specificity of enzymes used during hydrolysis.
Fig. 2.

RP-HPLC profiles of OPHs and UOP. The column was equilibrated with solvent A (1 ml/l trifluoroacetic acid in ultrapure water). Peptides were first eluted with 100% solvent A for 2 min, followed by a linear gradient from 100% A to 25% of solvent B during 30 min and then to 60% solvent B during 15 min
Molecular weight distribution
Size-exclusion chromatography on Sephadex G-25 was performed to analyze the overall molecular weight distribution of the different hydrolysates. The profiles reported in Fig. 3 revealed the heterogeneity of peptides present in each protein hydrolysate. Furthermore, the content of low molecular weight peptides positively correlated with the hydrolysis degree of each sample. Indeed, the elution profiles showed that OPH-A26, which had the highest DH, contained the highest level of small-sized peptides, with molecular weight below 300 Da, whereas in OPH-ZB, with the lowest DH value, peptides with high molecular weight were predominant.
Fig. 3.

Separation of OPHs by size exclusion chromatography on Sephadex G-25. (OPH-A26), (OPH-ZB) and (OPH-Esp) are octopus protein hydrolysates produced using crude enzyme preparation from B. subtilis A26, crude enzyme extract from zebra blenny viscera and commercial enzyme Esperase
Functional properties
Protein solubility
The solubility profiles of hydrolysates from the octopus proteins in the pH range of 1.0–10.0 are presented in Fig. 4. As shown, enzymatic hydrolysis improved considerably the solubility of octopus proteins at all pH values tested. The undigested proteins were less soluble than the hydrolysates, having a solubility of 48.67–49.3% between pH 1.0 and 10.0, and the lowest solubility was achieved at pH 6.0, which is the isoelectric point. OPHs revealed also a minimum solubility at pH 6.0, and increased gradually below and above pH 6.0. The difference in solubility observed among OPHs can be due to peptide length and the ratio of hydrophobic/hydrophilic peptides. Indeed, the OPH-A26, with high DH and low molecular weight peptides, had higher solubility than the other hydrolysates at all pH values studied. At pH values of 1.0, 8.0, 9.0 and 10.0, the solubility of OPH-A26 reached about 90%.
Fig. 4.

Solubility profiles of OPHs as a function of pH obtained by treatment with crude enzyme extract from zebra blenny viscera (OPH-ZB), crude enzyme preparation from B. subtilis A26 (OPH-A26), and commercial enzyme Esperase (OPH-Esp)
The improvement of protein solubility by the enzymatic treatment was attributed to the release of medium or smaller peptides that usually have increased solubility and to the exposure of more charged and polar groups to the surrounding water (Gbogouri et al. 2004). As OPHs have excellent solubility than UOP, they could be useful in the formulation food systems for various applications.
Foaming properties
Foam expansion [FE (%)] and foam stability [FS (%)] of OPHs at different concentrations compared with those of UOP are illustrated in Table 2. FE and FS of OPHs increased significantly with increasing protein hydrolysate concentration (p < 0.05). In addition, results showed that OPHs exhibited higher foam capacity than did undigested proteins at all concentrations tested. Increasing of foaming capacity of fish proteins after hydrolysis has been reported by Chalamaiah et al. (2012). In fact, the improvement of foam capacity by hydrolysis could be attributed to the production of amphiphilic peptides, which can migrate to the air–water interface. Foaming capacity was found to decrease with increasing hydrolysis degree values. OPH-Zb, with the lowest DH, exhibited the highest foaming properties among all the samples (p < 0.05). At a concentration of 0.5%, the foaming capacity of OPH-A26, OPH-Esp and OPH-Zb were 115.0, 120.8 and 134.6%, respectively.
Table 2.
The foaming properties of OPHs at different concentrations
| Protein concentration | UOP | OPH-ZB | OPH-Esp | OPH-A26 |
|---|---|---|---|---|
| Foam expansions (%) | ||||
| 0.5 | 91.5 ± 1.00dC | 134.6 ± 0.40aC | 120.8 ± 0.75bC | 115.0 ± 0.66cC |
| 1 | 96.4 ± 1.26dB | 140.8 ± 0.8aB | 129.6 ± 0.62bB | 120.1 ± 1.55cB |
| 2 | 106.1 ± 0.6dA | 155.2 ± 0.8aA | 148.5 ± 1.68bA | 126.9 ± 1.37cA |
| Foam stability (%) | ||||
| 0.5 | 23.26 ± 0.4dC | 64.03 ± 1.27cC | 68.53 ± 0.17bC | 76.83 ± 1.42aC |
| 1 | 33.51 ± 0.29dB | 68.10 ± 1.15cB | 73.23 ± 0.38bB | 94.8 ± 0.48aB |
| 2 | 74.00 ± 3.34cA | 92.68 ± 0.31bA | 95.31 ± 0.98bA | 103.3 ± 0.41aA |
| Emulsifying activity index (m2 /g) | ||||
| 0.5 | 16.27 ± 0.03dA | 22.48 ± 0.02cA | 29.26 ± 0.46bA | 46.65 ± 0.01aA |
| 1 | 9.67 ± 0.47cB | 10.62 ± 0.17cB | 20.63 ± 0.18bB | 32.78 ± 0.02aB |
| 2 | 2.73 ± 0.25dC | 9.08 ± 0.52cC | 11.79 ± 0.54bC | 15.97 ± 0.47aC |
| Emulsion stability index (min) | ||||
| 0.5 | 25.13 ± 0.7dA | 30.23 ± 0.33cA | 33.54 ± 0.33bA | 56.27 ± 0.7aA |
| 1 | 9.16 ± 0.6dB | 14.73 ± 0.52cB | 22.87 ± 0.66bB | 38.0 ± 0.88aB |
| 2 | 1.23 ± 0.21cC | 4.00 ± 0.63bC | 7.73 ± 0.44aC | 3.95 ± 0.08bC |
| Water-holding capacity (ml/g) | ||||
| – | 1.21 ± 0.07c | 2.96 ± 0.04b | 3.11 ± 0.08b | 4.20 ± 0.13a |
| Oil binding capacity (ml/g) | ||||
| – | 0.74 ± 0.27c | 2.77 ± 0.27a | 2.63 ± 0.11a | 1.90 ± 0.23b |
WHC = water-holding capacity (mL of water absorbed/g of sample)
OHC = oil-holding capacity (mL of oil absorbed/g of sample)
a,bDifferent letters in the same line indicate significant differences (a > b > c > d; p < 0.05)
Values are given as mean ± SD from triplicate determinations (n = 3)
Octopus protein hydrolysates were obtained by treatment with crude enzyme extract from zebra blenny viscera (OPH-ZB), crude enzyme preparation from B. subtilis A26 (OPH-A26), and commercial enzyme Esperase (OPH-Esp). UOP: Undigested octopus proteins
However, OPH-A26, with the highest DH, exhibited the highest foaming stability among all the samples despite its moderate FE. The obtained results are in contrast with earlier studies (Shahidi et al. 1995) in which a reduction in the FS capelin protein hydrolysates at a higher DH, mainly because the presence of smaller peptides that did not have enough structural support to generate stable foam.
Emulsifying properties
EAI and ESI of OPHs at various concentrations (0.5, 1 and 2%; w/v) are reported in Table 2. As expected, enzymatic hydrolysis improved considerably the EAI and ESI. All OPHs showed significantly higher emulsification capacity (p < 0.05) than did undigested proteins [16.27 m2/g, 0.5% (w/v)]. The highest EAI was obtained with OPH-A26 [46.65 m2/g, 0.5% (w/v)] followed by OPH-Esp [29.26 m2/g, 0.5% (w/v)] and OPH-Zb [22.48 m2/g, 0.5% (w/v)]. The emulsifying properties of OPHs could be explained by the fact that hydrolysis liberated medium molecular-weight peptides from the native protein, which would enhance the flexibility of the peptides of OPH-A26 at the oil/water interface, resulting in a larger surface area and, consequently, greater emulsion formation. In addition, EAI values of all OPHs significantly decreased with increasing concentration (p < 0.05).
Water-holding and oil-binding capacities
The WHC and OBC of octopus protein hydrolysates were evaluated for their possible use as a functional ingredient. As shown in Table 2, protein hydrolysis improved both WHC and OHC since values were significantly higher than those of intact proteins. In addition, results demonstrated that there is a correlation between WHC, OBC and the DH of protein hydrolysates. Hence, among the three hydrolysates, OPH-A26, with the highest DH (21%) showed the best ability to bind water, while OPH-ZB, with the lowest DH showed the lowest WHC. Conversely, OPH-A26 showed the lowest OHC, while OPH-ZB had the highest OBC. The extensive hydrolysis would break many peptide bonds, thus contributing to the decrease of OBC as well as to the increase in WHC.
In general, water holding capacity of partly unfolded and hydrolyzed proteins is greater than that of native proteins due to an increase in surface area to mass ratio with exposure of some previously buried hydrophobic groups.
Antioxidant activity
DPPH radical-scavenging activity
Figure 5a shows the results of DPPH radical-scavenging activity of OPHs and UOP at different concentrations.
Fig. 5.
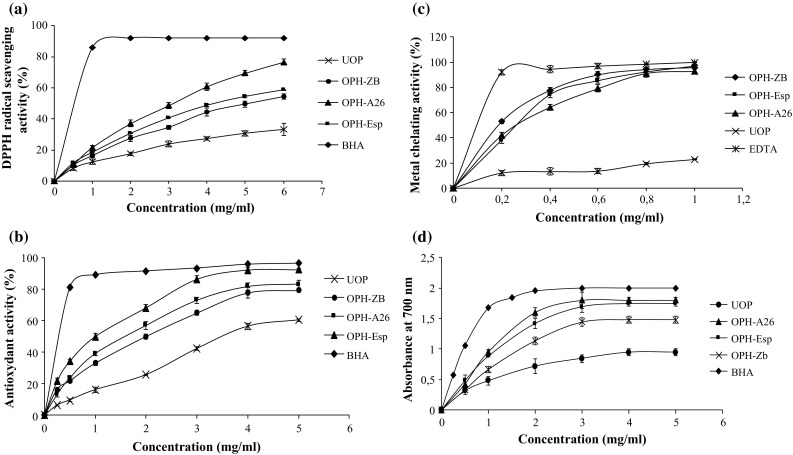
a Scavenging effect on DPPH free radical, b β-carotene bleaching inhibition, c metal chelating activity, and d reducing power of OPHs at different concentrations. BHA and EDTA were used as positive controls. Values presented are the mean of triplicate analyses
Among the different hydrolysates, OPH-A26 displayed the highest radical scavenging activity (75.1% at 6 mg/ml) followed by OPH-Esp (58.52% at 6 mg/ml) and OPH-ZB (53.29% at 6 mg/ml). However, OPHs showed lower radical-scavenging activities than did BHA, (100% at 2 mg/ml). The differences in the radical scavenging ability of OPHs may be attributed to the difference in the length, amino acid composition, sequence and hydrophobicity of peptides within protein hydrolysates.
Undigested proteins showed lower antioxidant activity (33% at 6 mg/ml) than OPHs. The above results indicated that the three hydrolysates contained potent peptides which acted as a good electron or hydrogen donors and could react with free radicals to convert them to more stable products and terminate the radical chain reaction.
Indeed, OPH-A26, which had the highest HD, probably contained lower molecular weight peptides which might be responsible for the high activity. The presence of His, Met, Phe and Tyr in A26 hydrolysate might have contributed to better DPPH radical scavenging activity.
β-carotene bleaching assay
The antioxidant activities of OPHs analyzed using β-carotene bleaching assay are shown in Fig. 5b. All hydrolysates suppressed the discoloration of β-carotene at different degrees and in a dose dependent manner. OPH-Esp displayed the highest ability to prevent the bleaching of β-carotene, with 92.29% inhibition at 5 mg/ml. However, BHA exhibited better antioxidant activity than all the other hydrolysates at the same concentration. The variation in the antioxidant activity of OPHs can be explained to the differences in the sequences of peptides and/or their molecular size. The antioxidant activity index of peptides or proteins in the free radical-mediated lipid peroxidation system is influenced by molecular size, chemical properties and electron transferring ability of amino acid residues in the sequence (Qian et al. 2008). Thus, the results reveal that OPHs activity depends on the type of proteases investigated, since protease specificity affects the length of peptides as well as their amino acids sequences.
Ferrous ion chelating activity
The ferrous ion chelating activities of OPHs, UOP, and EDTA used as reference chelating agent, at different concentrations are presented in Fig. 5c.
The results showed that all hydrolysates displayed comparable and strong Fe2+ ion chelating activity in a dose dependent manner. At all concentrations tested, a little difference in the activity was observed between the three hydrolysates (92.8–95.9% at 1 mg/ml). EDTA exhibited the highest metal chelating activity (p < 0.05), at all concentrations tested, whereas, UOP exhibited the lowest metal chelating activity, (22.9% at 1 mg/ml). Protein hydrolysates prepared from octopus showed higher ferrous binding capacities than those produced from sardinelle hydrolysates (Ben Khaled et al. 2011).
The metal chelating activity of OPHs might be related to histidine containing peptides, which are well known to act as strong metal ion chelators (Chalamaiah et al. 2012). Therefore, the present study suggests that some peptides in OPHs could be potential antioxidant through metal chelating ability.
Reducing power assay
As observed in Fig. 5d, all OPHs exhibited a dose-dependent increase in the reducing power, in the range of concentrations studied. The obtained results show that reducing power ability of hydrolysates mainly depends on the type of enzyme applied during enzymatic hydrolysis. At higher concentrations (>2 mg/ml) the three hydrolysates showed significant difference (p < 0.05) in reducing power activity. However, all hydrolysates showed lower reducing power activities than did BHA at the same concentrations.
Several works also reported the increase in the reducing power with increasing amount of protein hydrolysates from different fish species (Chalamaiah et al. 2015; Morales-Medina et al. 2016).
It was also observed that UOP had reducing power, although lower than OPHs. Similar results were found by Nasri et al. (2014) who reported that hydrolysis of goby muscle improved the reducing power activity. The reducing power of OPHs was also in accordance with DPPH assay. Indeed, OPH-A26, which displayed the highest DPPH radical-scavenging activity, was also found to exhibit the highest reducing power followed by OPH-Esp.
Since OPHs manifested reducing power activity, they may contain potent antioxidant peptides, which act as electron donors to free radicals and thereby convert them into more stable products (Shahidi and Zhong 2010).
Inhibition of supercoiled plasmid DNA scission induced by hydroxyl radicals
The antioxidant activities of OPHs, as well as UOP, using DNA nicking assay are reported in Fig. 6. Lane 1 represents the untreated plasmid (native DNA) with its two forms, the upper one is open-circular (nicked) DNA and the faster migrating band is supercoiled plasmid. As expected, incubation of plasmid DNA with Fenton’s reagent in the absence of OPHs resulted in the complete degradation of the two DNA bands (lane 2). All OPHs to the reaction mixture prior to incubation, with Fenton’s reagent resulted in a protection against hydroxyl radical induced DNA breakage. OPH-ZB exhibited the strongest protection (lane 3), no degradation were observed for the two forms of plasmid DNA.
Fig. 6.

Gel electrophoresis pattern of the plasmid pCRII™TOPO incubated with Fenton’s reagent in the presence and absence of OPHs. Lane 1 untreated control: native pCRII™TOPO DNA (0.5 μg); lane 2 DNA sample incubated with Fenton’s reagent; lanes 3, 4, and 5: Fenton’s reagent + DNA + 2 mg OPHs (OPH-ZB, OPH-A26, and OPH-Esp, respectively); lane 6: Fenton’s reagent + DNA + 2 mg UOP
This study revealed that OPHs exhibited, to a variable extent, dose dependent antioxidant activities against various antioxidant systems in vitro. The overall antioxidant action of protein hydrolysates is most likely attributed to the cooperative effects of several mechanisms, including, metal ion chelating, scavenging of radicals formed during peroxidation, scavenging of oxygen-containing compounds (Chen et al. 1998).
Conclusion
The results of this study indicate that OPHs, obtained by treatment with various proteases, exhibited, to a variable extent, antioxidant activities against various antioxidant systems in vitro. The differences between the antioxidant activities of the protein hydrolysates are probably due to the fact that peptides in the different hydrolysates might be different in terms of chain length and amino acid sequences. Further, the enzymatic hydrolysis was found to improve considerably solubility, and emulsifying and foaming properties. Therefore, it can be concluded that OPHs could be utilized in food systems as a natural additive possessing antioxidant properties.
Acknowledgement
This work was funded by the Ministry of Higher Education and Scientific Research, Tunisia.
References
- Adler-Nissen J (1986) A review of food hydrolysis specific areas. Int J. Adler-Nissen (ed) Enzymic hydrolysis of food proteins. Elsevier Applied Science Publishers, pp 57–109
- Agrebi R, Haddar A, Hajji M, et al. Fibrinolytic enzymes from a newly isolated marine bacterium Bacillus subtilis A26: characterization and statistical media optimization. Can J Microbiol. 2009;55:1049–1061. doi: 10.1139/W09-057. [DOI] [PubMed] [Google Scholar]
- AOAC . Official methods of analysis. 17. Washington: Association of Official Analytical Chemists; 2000. [Google Scholar]
- Aruoma DOI. Free radicals, oxidative stress, and antioxidants in human health and disease. J Am Oil Chem Soc. 1998;75:199–212. doi: 10.1007/s11746-998-0032-9. [DOI] [PMC free article] [PubMed] [Google Scholar]
- Ben Khaled H, Ktari N, Ghorbel-Bellaaj O, et al. Composition, functional properties and in vitro antioxidant activity of protein hydrolysates prepared from sardinelle (Sardinella aurita) muscle. J Food Sci Technol. 2011;51:622–633. doi: 10.1007/s13197-011-0544-4. [DOI] [PMC free article] [PubMed] [Google Scholar]
- Benjakul S, Morrissey MT. Protein hydrolysates from pacific whiting solid wastes. J Agric Food Chem. 1997;45:3423–3430. doi: 10.1021/jf970294g. [DOI] [Google Scholar]
- Bersuder P, Hole M, Smith G. Antioxidants from a heated histidine-glucose model system. I: investigation of the antioxidant role of histidine and isolation of antioxidants by high-performance liquid chromatography. J Am Oil Chem Soc. 1998;75:181–187. doi: 10.1007/s11746-998-0030-y. [DOI] [Google Scholar]
- Chalamaiah M, Dinesh kumar B, Hemalatha R, Jyothirmayi T. Fish protein hydrolysates: proximate composition, amino acid composition, antioxidant activities and applications: a review. Food Chem. 2012;135:3020–3038. doi: 10.1016/j.foodchem.2012.06.100. [DOI] [PubMed] [Google Scholar]
- Chalamaiah M, Jyothirmayi T, Diwan PV, Kumar BD. Antioxidant activity and functional properties of enzymatic protein hydrolysates from common carp (Cyprinus carpio) roe (egg) J Food Sci Technol. 2015;52:5817–5825. doi: 10.1007/s13197-015-1714-6. [DOI] [PMC free article] [PubMed] [Google Scholar]
- Chen H-M, Muramoto K, Yamauchi F, et al. Antioxidative properties of histidine-containing peptides designed from peptide fragments found in the digests of a soybean protein. J Agric Food Chem. 1998;46:49–53. doi: 10.1021/jf970649w. [DOI] [PubMed] [Google Scholar]
- Dinis TC, Maderia VM, Almeida LM. Action of phenolic derivatives (acetaminophen, salicylate, and 5-aminosalicylate) as inhibitors of membrane lipid peroxidation and as peroxyl radical scavengers. Arch Biochem Biophys. 1994;315:161–169. doi: 10.1006/abbi.1994.1485. [DOI] [PubMed] [Google Scholar]
- Elias RJ, Kellerby SS, Decker EA. Antioxidant activity of proteins and peptides. Crit Rev Food Sci Nutr. 2008;48:430–441. doi: 10.1080/10408390701425615. [DOI] [PubMed] [Google Scholar]
- Gbogouri GA, Linder M, Fanni J, Parmentier M. Influence of hydrolysis degree on the functional properties of salmon byproducts hydrolysates. J Food Sci. 2004;69:C615–C622. doi: 10.1111/j.1365-2621.2004.tb09909.x. [DOI] [Google Scholar]
- Gornall AG, Bardawill CJ, David MM. Determination of serum proteins by means of the biuret reaction. J Biol Chem. 1949;177:751–766. [PubMed] [Google Scholar]
- Jamilah B, Harvinder KG. Properties of gelatins from skins of fish—black tilapia (Oreochromis mossambicus) and red tilapia (Oreochromis nilotica) Food Chem. 2002;77:81–84. doi: 10.1016/S0308-8146(01)00328-4. [DOI] [Google Scholar]
- Kembhavi AA, Kulkarni A, Pant A. Salt-tolerant and thermostable alkaline protease from Bacillus subtilis NCIM no. 64. Appl Biochem Biotechnol. 1993;38:83–92. doi: 10.1007/BF02916414. [DOI] [PubMed] [Google Scholar]
- Koleva II, van Beek TA, Linssen JPH, et al. Screening of plant extracts for antioxidant activity: a comparative study on three testing methods. Phytochem Anal. 2002;13:8–17. doi: 10.1002/pca.611. [DOI] [PubMed] [Google Scholar]
- Kristinsson HG, Rasco BA. Fish protein hydrolysates: production, biochemical, and functional properties. Crit Rev Food Sci Nutr. 2000;40:43–81. doi: 10.1080/10408690091189266. [DOI] [PubMed] [Google Scholar]
- Lee J-C, Kim H-R, Kim J, Jang Y-S. Antioxidant property of an ethanol extract of the stem of Opuntia ficus-indica var. Saboten. J Agric Food Chem. 2002;50:6490–6496. doi: 10.1021/jf020388c. [DOI] [PubMed] [Google Scholar]
- Lemieux L, Piot J-M, Guillochon D, Amiot J. Study of the efficiency of a mobile phase used in size-exclusion HPLC for the separation of peptides from a casein hydrolysate according to their hydrodynamic volume. Chromatographia. 1991;32:499–504. doi: 10.1007/BF02327894. [DOI] [Google Scholar]
- Li X, Luo Y, Shen H, You J. Antioxidant activities and functional properties of grass carp (Ctenopharyngodon idellus) protein hydrolysates. J Sci Food Agric. 2012;92:292–298. doi: 10.1002/jsfa.4574. [DOI] [PubMed] [Google Scholar]
- Lobo V, Patil A, Phatak A, Chandra N. Free radicals, antioxidants and functional foods: impact on human health. Pharmacogn Rev. 2010;4:118–126. doi: 10.4103/0973-7847.70902. [DOI] [PMC free article] [PubMed] [Google Scholar]
- Morales-Medina R, Tamm F, Guadix AM, et al. Functional and antioxidant properties of hydrolysates of sardine (S. pilchardus) and horse mackerel (T. mediterraneus) for the microencapsulation of fish oil by spray-drying. Food Chem. 2016;194:1208–1216. doi: 10.1016/j.foodchem.2015.08.122. [DOI] [PubMed] [Google Scholar]
- Nasri R, Jridi M, Lassoued I, et al. The influence of the extent of enzymatic hydrolysis on antioxidative properties and ACE-inhibitory activities of protein hydrolysates from goby (Zosterisessor ophiocephalus) muscle. Appl Biochem Biotechnol. 2014;173:1121–1134. doi: 10.1007/s12010-014-0905-3. [DOI] [PubMed] [Google Scholar]
- Okezie BO, Bello AB. Physicochemical and functional properties of winged bean flour and isolate compared with soy isolate. J Food Sci. 1988;53:450–454. doi: 10.1111/j.1365-2621.1988.tb07728.x. [DOI] [Google Scholar]
- Pearce KN, Kinsella JE. Emulsifying properties of proteins: evaluation of a turbidimetric technique. J Agric Food Chem. 1978;26:716–723. doi: 10.1021/jf60217a041. [DOI] [Google Scholar]
- Qian Z-J, Jung W-K, Kim S-K. Free radical scavenging activity of a novel antioxidative peptide purified from hydrolysate of bullfrog skin, Rana catesbeiana Shaw. Bioresour Technol. 2008;99:1690–1698. doi: 10.1016/j.biortech.2007.04.005. [DOI] [PubMed] [Google Scholar]
- Saiga A, Tanabe S, Nishimura T. Antioxidant activity of peptides obtained from porcine myofibrillar proteins by protease treatment. J Agric Food Chem. 2003;51:3661–3667. doi: 10.1021/jf021156g. [DOI] [PubMed] [Google Scholar]
- Shahidi F, Zhong Y. Lipid oxidation and improving the oxidative stability. Chem Soc Rev. 2010;39:4067. doi: 10.1039/b922183m. [DOI] [PubMed] [Google Scholar]
- Shahidi F, Han X-Q, Synowiecki J. Production and characteristics of protein hydrolysates from capelin (Mallotus villosus) Food Chem. 1995;53:285–293. doi: 10.1016/0308-8146(95)93934-J. [DOI] [Google Scholar]
- Šližytė R, Daukšas E, Falch E, et al. Characteristics of protein fractions generated from hydrolysed cod (Gadus morhua) by-products. Process Biochem. 2005;40:2021–2033. doi: 10.1016/j.procbio.2004.07.016. [DOI] [Google Scholar]
- Thuy CX, Lam TB, Commick MK. Biochemical and functional properties of fish protein isolate (FPI) from Pangasius hypophthalmus byproducts as influenced by time and degree of hydrolysis (DH) Int Food Res J. 2015;22:337–343. [Google Scholar]
- Tsumura K, Saito T, Tsuge K, et al. Functional properties of soy protein hydrolysates obtained by selective proteolysis. LWT Food Sci Technol. 2005;38:255–261. doi: 10.1016/j.lwt.2004.06.007. [DOI] [Google Scholar]
- Wilding P, Lillford PJ, Regenstein JM. Functional properties of proteins in foods. J Chem Technol Biotechnol. 1984;34:182–189. doi: 10.1002/jctb.280340307. [DOI] [Google Scholar]
- Yıldırım A, Mavi A, Kara AA. Determination of antioxidant and antimicrobial activities of Rumex crispus L. extracts. J Agric Food Chem. 2001;49:4083–4089. doi: 10.1021/jf0103572. [DOI] [PubMed] [Google Scholar]