

Abstract
Pluripotent stem cells are known to display distinct metabolic phenotypes than their somatic counterparts. While accumulating studies are focused on the roles of glucose and amino acid metabolism in facilitating pluripotency, little is known regarding the role of lipid metabolism in regulation of stem cell activities. Here, we show that fatty acid (FA) synthesis activation is critical for stem cell pluripotency. Our initial observations demonstrated enhanced lipogenesis in pluripotent cells and during cellular reprogramming. Further analysis indicated that de novo FA synthesis controls cellular reprogramming and embryonic stem cell pluripotency through mitochondrial fission. Mechanistically, we found that de novo FA synthesis regulated by the lipogenic enzyme ACC1 leads to the enhanced mitochondrial fission via (i) consumption of AcCoA which affects acetylation‐mediated FIS1 ubiquitin–proteasome degradation and (ii) generation of lipid products that drive the mitochondrial dynamic equilibrium toward fission. Moreover, we demonstrated that the effect of Acc1 on cellular reprogramming via mitochondrial fission also exists in human iPSC induction. In summary, our study reveals a critical involvement of the FA synthesis pathway in promoting ESC pluripotency and iPSC formation via regulating mitochondrial fission.
Keywords: Acc1, FA synthesis, Fis1, mitochondrial fission, pluripotency
Subject Categories: Metabolism, Stem Cells
Introduction
Pluripotent stem cells (PSCs), including embryonic stem cells (ESCs) and induced pluripotent stem cells (iPSC), are unique cells with distinct properties such as the ability to self‐renew indefinitely and the potential to differentiate into almost all types of somatic cells (Takahashi & Yamanaka, 2006; Zhang et al, 2012a). It's been revealed recently that PSCs possess specific metabolic phenotypes that are reminiscent of the Warburg effect, or aerobic glycolysis, in cancer cells (Yanes et al, 2010; Folmes et al, 2012; Panopoulos et al, 2012; Zhang et al, 2012a). Many groups have established that cellular bioenergetic transition from oxidative phosphorylation to glycolysis was critical for somatic cell reprogramming (Folmes et al, 2011; Varum et al, 2011; Prigione et al, 2014). We also documented recently an orchestrated regulation via epigenetic, transcriptional, and metabolic networks to promote glycolysis and pluripotency in PSCs and during reprogramming (Cao et al, 2015). Intriguingly, amino acid metabolism is also reported to be critical for PSCs pluripotency. For example, threonine dehydrogenase (TDH)‐mediated threonine metabolism, which promotes DNA synthesis and cell proliferation, was essential for the survival and pluripotency of mESCs and somatic reprogramming (Wang et al, 2009; Shyh‐Chang et al, 2013). Methionine metabolism, which produces S‐SAM that regulates methylation of DNA and histones, was found to regulate the pluripotency and differentiation of hESCs (Shiraki et al, 2014). More recently, it was reported that one carbon involved serine metabolism, nucleotide metabolism, and histone methylation regulated by LIN28 affects naive/primed pluripotency and somatic cell reprogramming (Zhang et al, 2016). Nevertheless, compared to the rapid progress in understanding glycolysis and amino acid metabolism in PSCs, less is known regarding lipid metabolism alterations and its significance in determining the fate of PSCs.
Cellular lipids, such as prostaglandin E2, linoleic acid, and albumin‐associated lipids, have been documented to be involved in the regulation of stem cell pluripotency or differentiation (Feher & Gidali, 1974; Rutherford et al, 2008; Kim et al, 2009; Das, 2011). Moreover, lipid metabolism has been shown to regulate pluripotent state of adult stem cells (Ito et al, 2012; Knobloch et al, 2012). Fatty acid oxidation (FAO) inhibition was reported to induce loss of hematopoietic stem cell (HSC) maintenance by stimulating HSCs into lineage differentiation (Ito et al, 2012), while conditional deletion of fatty acid synthase (Fasn) in mouse neural stem and progenitor cells (NSPCs) impaired adult neurogenesis by inhibiting NSPC proliferation (Knobloch et al, 2012). There are also some evidence suggesting that lipid metabolism plays important role in cellular reprogramming (Vazquez‐Martin et al, 2013; Wu et al, 2016). Acetyl‐CoA (AcCoA), a key precursor of lipid synthesis and the sole donor of the acetyl groups for acetylation, was recently shown to occupy a critical position in multiple cellular events, including energy metabolism, mitosis, and autophagy, both directly and via the epigenetic regulation of gene expression (Pietrocola et al, 2015). However, the metabolism of lipid precursor metabolites such as AcCoA may have more profound effects that warrant further investigation. In general, the roles and underlying mechanisms of lipid metabolic pathways in iPSC generation and ESC pluripotent maintenance remain largely unclear.
Somatic cell reprogramming is a complex process that not only involves cellular metabolic changes, MET transitions (Samavarchi‐Tehrani et al, 2010), epigenetic regulation (Zhao et al, 2013), and autophagy activation (Wang et al, 2013), but also requires cytoskeleton and organelles remodeling. Mitochondria are in a delicately orchestrated dynamic equilibrium between fusion and fission that alter mitochondrial morphology constantly. Mitochondrial fission was reported to be critical in somatic cell reprogramming (Vazquez‐Martin et al, 2012; Son et al, 2013). Pharmacological inhibition of mitochondrial fission impeded somatic cell reprogramming to pluripotent cells (Vazquez‐Martin et al, 2012). Interestingly, Son et al reported recently that mitochondrial fission shifted glucose oxidative phosphorylation to glycolytic metabolism to drive cell entry into pluripotency (Son et al, 2013). Moreover, Mfn1/2 ablation, which promotes mitochondrial fission, facilitates the induction of pluripotency by regulating mitochondrial dynamics and bioenergetics (Son et al, 2015). Nevertheless, while the role of mitochondrial fission/fusion dynamics in cell reprogramming has gradually attracted more attentions, very little is known regarding the mechanisms by which mitochondrial fission/fusion dynamics is regulated, in particular, we are yet to know how the metabolism‐related factors and pathways contribute to mitochondrial dynamics, especially in stem cells.
Based on our recent discovery that relates glycolytic metabolism to pluripotency (Cao et al, 2015), here, we set out to investigate the potential roles of lipid metabolism and its underlying mechanisms in determining the fate of PSCs. First, our observations demonstrated enhanced de novo lipogenesis in pluripotent cells and during somatic cell reprogramming. Further analysis indicated that de novo FA synthesis, which is proceeded by its rate‐limiting enzyme Acc1 (acetyl‐coenzyme A carboxylase alpha), controls cellular reprogramming and embryonic stem cell pluripotency by inducing mitochondrial fission. Mechanistically, we found that both decreased cellular AcCoA level and increased lipid generation, as a result of Acc1 activation, lead to enhanced mitochondrial fission and cellular reprogramming. On the one hand, high levels of AcCoA promote ubiquitin–proteasome degradation of Fis1 protein by regulating its acetylation, resulting in decreased mitochondrial fission, and thus, AcCoA consumption for FA synthesis following Acc1 activation will decrease its level and attenuates its inhibitory effect on mitochondrial fission; on the other hand, generated lipid products could drive mitochondrial dynamic equilibrium toward mitochondrial fission. Moreover, we further demonstrate that the effect of de novo FA synthesis on cellular reprogramming via mitochondrial fission also exists during human iPSC induction. These observations provide a previously unappreciated link between FA synthesis, mitochondrial fission, and cellular pluripotency.
Results
Enhanced lipogenesis in ESCs and during somatic cell reprogramming
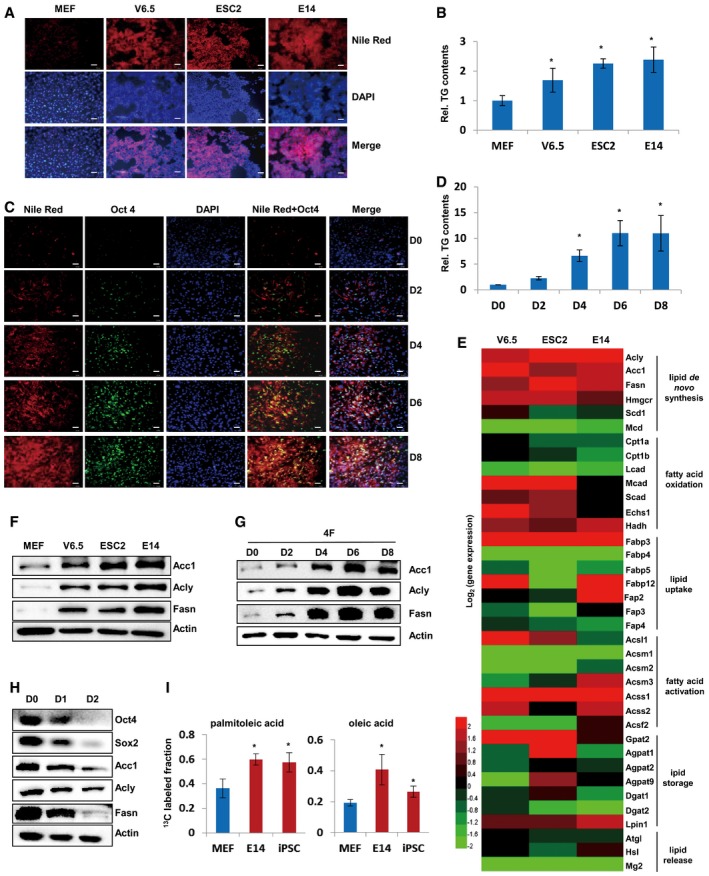
To study the roles and underlying mechanisms of lipid metabolic pathway or relevant metabolic enzymes in iPSC generation and ESC pluripotency maintenance, we set out to measure the lipid changes in ES cells and during somatic cell reprogramming. Nile Red staining demonstrated that lipids remarkably accumulated in mES cell lines including V6.5, ESC2, and E14, as compared to MEF cells (Fig 1A). Cellular triglyceride (TG) measurement also revealed that V6.5, ESC2, and E14 cells possess significantly more TG than MEF cells (Fig 1B). These results were consistent with previous reports demonstrating lipid accumulation in iPSC (Vazquez‐Martin et al, 2013). More importantly, when MEF cells were infected with viruses expressing four Yamanaka factors (Oct4/Sox2/Klf4/c‐Myc) to generate iPSCs, cellular lipids gradually increased along with the induction of the pluripotent gene Oct4 expression during cellular reprogramming (Fig 1C). Consistently, cellular TG levels also gradually increased during the reprogramming process (Fig 1D), suggesting the potential involvement of lipid metabolism in iPSC induction and ESC pluripotency maintenance.
Figure 1. Enhanced lipogenesis in ESCs and during somatic cell reprogramming.
-
ALipids in MEF, V6.5, ESC2, and E14 cells were stained by Nile Red. DAPI was used to stain the cell nucleus. Scale bars, 50 μm.
-
BCellular TG contents were measured in MEF, V6.5, ESC2, and E14 cells. Values were normalized to cellular protein levels.
-
CLipids were stained by Nile Red and Oct4 expression was visualized by anti‐Oct4 antibody in MEF cells infected with viruses expressing four Yamanaka factors (four factors; Klf4/Sox2/Oct4/c‐Myc) on days 0, 2, 4, 6, and 8 during reprogramming. DAPI was used to stain the cell nucleus. Scale bars, 50 μm.
-
DCellular TG contents were measured in MEF cells infected with viruses expressing four factors (Klf4/Sox2/Oct4/c‐Myc) on days 0, 2, 4, 6, and 8 during reprogramming. Values were normalized to cellular protein levels.
-
EHeat map from qRT‐PCR analysis showed the mRNA expression of lipid metabolism‐related genes in V6.5, ESC2, and E14 cells as compared to MEF cells. Red indicates up‐regulated, whereas green indicates down‐regulated genes.
-
F, GWestern blot analysis of Acc1, Acly, and Fasn expression in MEF, V6.5, ESC2, and E14 cells (F) or in MEF cells infected with viruses expressing four factors (Klf4/Sox2/Oct4/c‐Myc) on days 0, 2, 4, 6, and 8 during reprogramming (G).
-
HWestern blot analysis of Oct4, Sox2, Acc1, Acly, and Fasn expression in E14 cells cultured in RA differentiation medium for 0, 24, and 48 h.
-
ILC‐MS analysis of 13C‐incorporated palmitoleic acid and oroleic acid in MEF, ESCs, and iPSCs incubated with 25 mM [U‐13C6]‐labeled glucose. The ratios of 13C‐incorporated palmitoleic acid or oleic acid to total palmitoleic acid or oleic acid, respectively, are shown.
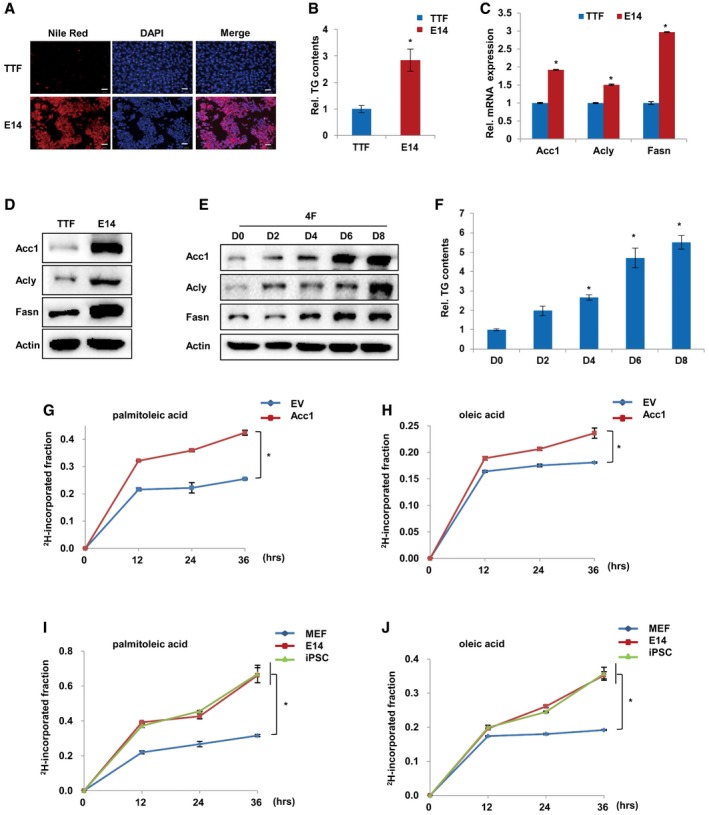
To investigate the metabolic pathways leading to lipid accumulation in mES cells, we performed reverse transcription and quantitative real‐time PCR (qRT‐PCR) to analyze the expression of lipid metabolism‐related genes. Interestingly, we found that Acc1, Acly, and Fasn, the major enzymes responsible for de novo FA synthesis, showed markedly higher expression in V6.5, ESC2, and E14 cells as compared to MEF cells (Fig 1E), suggesting that de novo FA synthesis was involved in the lipid accumulation in mES cells. Western blotting analysis further revealed that the protein levels of Acc1, Acly, and Fasn were dramatically higher in V6.5, ESC2, and E14 cells when compared to MEF cells (Fig 1F). Consistent with the observed lipid accumulation during iPSC induction, protein levels of Acc1, Acly, and Fasn were gradually elevated during the reprogramming of MEF cells induced by four Yamanaka factors (four factors; Fig 1G). More interestingly, we found that protein levels of Acc1, Acly, and Fasn were gradually decreased during retinoic acid (RA)‐induced differentiation of E14 cells (Fig 1H). Furthermore, besides MEF cells, we also compared mouse tail tip fibroblast (TTF) cells with ES and iPS cells and obtained consistent results (Fig EV1A–F). Collectively, these data suggest that de novo FA synthesis is associated with cellular pluripotency.
Figure EV1. Enhanced de novo lipogenesis in pluripotent cells.
-
ANile Red staining of TTF and E14 cells. DAPI was used to stain the cell nucleus. Scale bars, 50 μm.
-
BCellular TG was measured in TTF and E14 cells. Values were normalized to cellular protein.
-
CqRT‐PCR analysis showing the mRNA expression of Acc1, Acly, and Fasn expression in TTF and E14 cells.
-
DWestern blot analysis of Acc1, Acly, and Fasn expression in TTF and E14 cells.
-
EWestern blot analysis of Acc1, Acly, and Fasn protein in TTF cells infected with viruses expressing four factors (Klf4/Sox2/Oct4/c‐Myc) on days 0, 2, 4, 6, and 8 during reprogramming.
-
FCellular TG was measured in TTF cells infected with viruses expressing four factors (Klf4/Sox2/Oct4/c‐Myc) on days 0, 2, 4, 6, and 8 during reprogramming. Values were normalized to cellular protein.
-
G, HLC‐MS analysis of 2H‐labeled palmitoleic acid and oleic acid in empty vector (EV)‐ or Acc1‐overexpressing MEF cells incubated with 3.3% 2H‐labeled water (2H2O) for 0, 12, 24, and 36 h. The ratios of 2H‐incorporated palmitoleic acid (G) or oleic acid (H) to total palmitoleic acid or oleic acid, respectively, are shown.
-
I, JLC‐MS analysis of 2H‐incorporated palmitoleic acid and oroleic acid in MEF, ESCs, and iPSCs incubated with 3.3% 2H‐labeled water (2H2O) for 0, 12, 24, and 36 h. The ratios of 2H‐incorporated palmitoleic acid (I) or oleic acid (J) to total palmitoleic acid or oleic acid, respectively, are shown.
The elevated expression of Acc1, Acly, and Fasn suggested the activation of de novo FA synthesis in mES cells and during iPSC generation. Thus, we traced the metabolic flux of [U‐13C6]‐labeled glucose by liquid chromatography–mass spectrometry (LC‐MS) analysis. Our results revealed that E14 and iPSC cells possessed higher capacity of synthesizing palmitoleic acid and oleic acid from 13C‐labeled glucose as compared to MEF cells (Fig 1I). We further treated cells with 2H‐labeled water (2H2O), which has been widely used in the literatures (Turner et al, 2003; Rabol et al, 2011; Foletta et al, 2016; Paglialunga & Dehn, 2016), and detected the 2H isotope‐incorporated metabolites of FA de novo synthesis pathway in a time‐dependent manner. Our results revealed that MEF cells with exogenous Acc1 overexpression possessed higher capacity of synthesizing palmitoleic acid and oleic acid from 2H‐labeled water as compared to EV control group (Fig EV1G and H). Meanwhile, E14 and iPS cells exhibited higher capacity of synthesizing palmitoleic acid and oleic acid from 2H‐labeled water as compared to MEF cells (Fig EV1I and J), demonstrating that de novo FA synthesis was activated in PSCs including ES cells and iPSCs.
De novo FA synthesis is required for maintenance of ESC pluripotency and iPSC generation
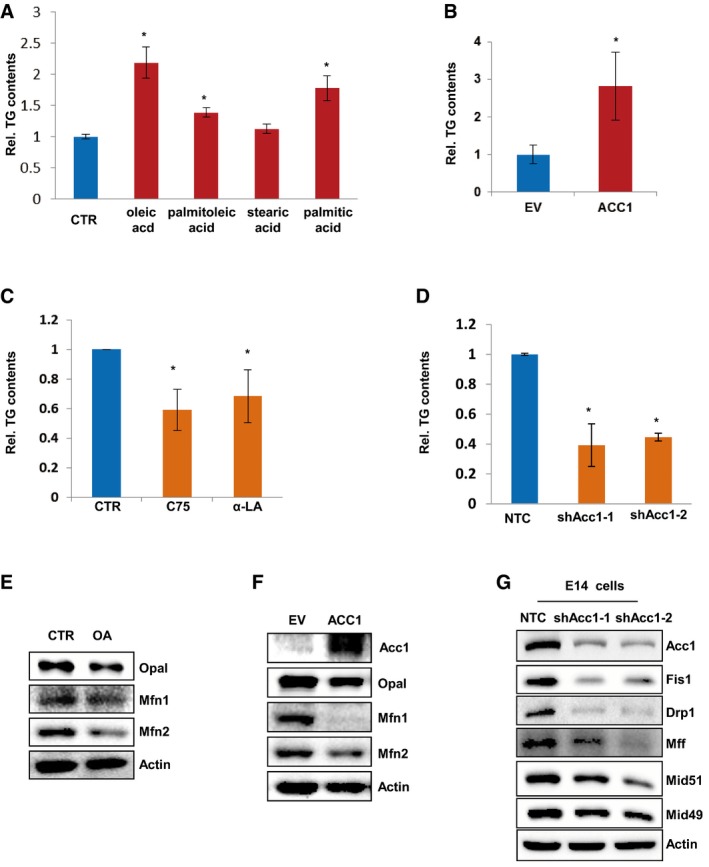
To study whether FA synthesis activation is important for cellular reprogramming, we added oleic acid, palmitoleic acid, stearic acid, or palmitic acid, the final products of de novo fatty acid synthesis pathway, into the medium of MEF cells. Their addition all increased the cellular TG levels in MEF cells, but oleic acid was more effective than other fatty acids (Fig EV2A). Thus, we next treated MEF cells with oleic acid during four‐factor‐induced reprogramming. As expected, AP and SSEA1 staining revealed that addition of oleic acid increased the numbers of formed iPSC colonies (Fig 2A), indicating enhanced efficiency of four‐factor‐induced iPSC formation by oleic acid. Moreover, forced overexpression of Acc1, the rate‐limiting enzyme of de novo FA synthesis pathway, also increased the cellular TG levels in MEF cells (Fig EV2B). AP and SSEA1 staining identified markedly increased numbers of iPSC colonies from Acc1‐overexpressing MEF cells induced by four factors (Fig 2B). Stem cell markers (Oct4, Sox2, and SSEA1) staining (Fig 2C) as well as teratoma formation experiment in vivo (Fig 2D) confirmed the pluripotency of the iPSCs generated in the presence of oleic acid or from Acc1‐overexpressing MEF cells. On the other hand, blocking de novo FA synthesis by lipogenesis inhibitors C75 or α‐LA (α‐lipoic acid; Kuhajda et al, 2005; Fernández‐Galilea et al, 2014) or knocking down Acc1 significantly decreased the cellular TG in MEF cells (Fig EV2C and D). Consistently, iPSC induction experiments demonstrated that addition of C75 or α‐LA in medium or knocking down Acc1 in MEF cells dramatically decreased the numbers of iPSC colonies induced by four factors (Fig 2E and F). More interestingly, blocking de novo FA synthesis by adding C75 or α‐LA into medium abolished the enhanced iPSC generation from Acc1‐overexpressing MEF cells (Fig 2G). In contrast, supplementation of oleic acid recovered the iPSC generation ability of Acc1 knocked down MEF cells to some extent (Fig 2H), illustrating that OA as a product of FA synthesis is very important for Acc1‐enhanced iPSC generation. Taken together, all these data proved that Acc1‐regulated FA production is critical for iPSC generation.
Figure EV2. Acc1‐mediated de novo FA synthesis affects TG contents and induces mitochondrial fission.
-
A, BCellular TG was measured in MEF cells treated with oleic acid, palmitoleic acid, stearic acid, and palmitic acid (A) or with forced overexpression of Acc1 (B). Values were normalized to cellular protein levels.
-
C, DCellular TG was measured in MEF cells treated with C75 or α‐LA (C) or in MEF cells expressing shAcc1 (D). Values were normalized to cellular protein levels.
-
E, FWestern blot analysis of Opa1, Mfn1, and Mfn2 protein levels in MEF cells treated with OA (E) or with forced overexpression of Acc1 (F).
-
GWestern blot analysis of Fis1, Drp1, Mff, Mid51, and Mid49 protein levels in E14 cells expressing NTC or shAcc1.
Figure 2. De novo FA synthesis is required for maintenance of ESC pluripotency and iPSC generation.
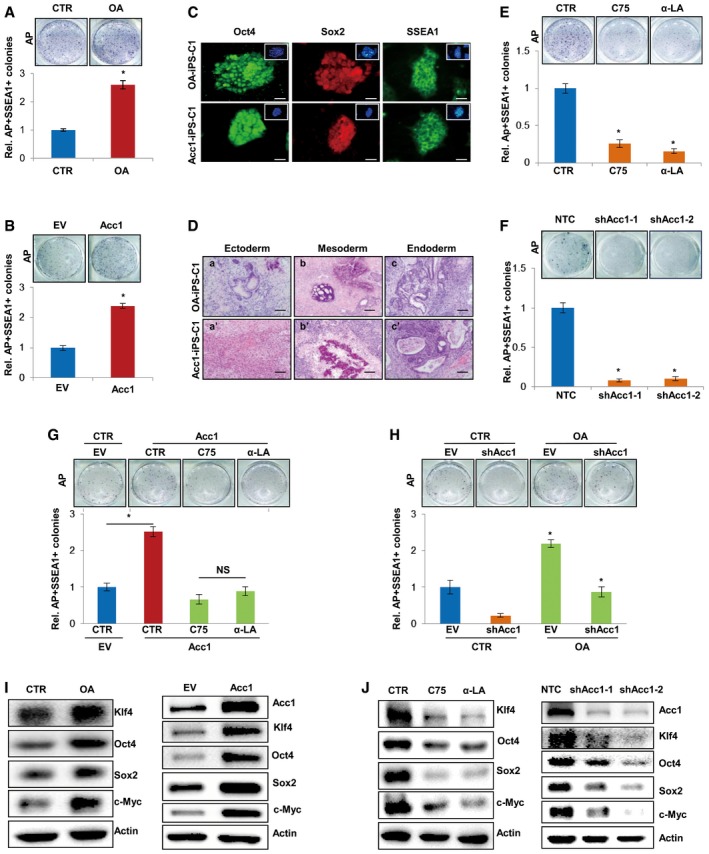
- Oleic acid (OA) was supplemented in the medium of MEF cells staring from 2 days after infection with viruses expressing four factors. AP staining (upper panel) showed the formed iPSC colonies. AP‐ and SSEA1‐positive iPSC numbers were counted (lower panel).
- Acc1‐overexpressing MEF cells were infected with viruses expressing four factors to induce iPSC formation. AP staining (upper panel) showed the formed iPSC colonies. AP‐ and SSEA1‐positive iPSC numbers were counted (lower panel).
- Immunofluorescence analysis was performed in iPSCs generated from (A) and (B) using anti‐Oct4/Sox2/SSEA1 antibodies. Nucleus was visualized by DAPI. Scale bars, 20 μm.
- Hematoxylin and eosin staining of teratoma sections derived from iPSC cells generated in (A) and (B) showed differentiation of iPSCs into cell types of three germ layers: squamous epithelium (a, a′), cartilage and osteoid matrix (b), osteoid matrix (b′) and glandular tissue (c, c′). Scale bars, 100 μm.
- FA synthesis inhibitor C75 or α‐LA was added into the medium of MEF cells staring from 2 days after infection with viruses expressing four factors. AP staining (upper panel) showed the formed iPSC colonies. AP‐ and SSEA1‐positive iPSC numbers were counted (lower panel).
- MEF cells with Acc1 knocked down by shRNAs were infected with viruses expressing four factors to induce iPSC. AP staining (upper panel) showed the formed iPSC colonies. AP‐ and SSEA1‐positive iPSC numbers were counted (lower panel).
- C75 or α‐LA was added into the medium of Acc1‐overexpressing MEF cells starting from 2 days after infection with viruses expressing four factors. AP and SSEA1 staining were used to distinguish the positive iPSC colonies.
- OA was added in the medium of shAcc1‐expressing MEF cells starting from 2 days after infection with viruses expressing four factors. AP and SSEA1 staining were used to distinguish the positive iPSC colonies.
- Western blot analysis of Klf4, Oct4, Sox2, c‐Myc pluripotent proteins expression in E14 cells treated with oleic acid (left panel) or with forced overexpression of Acc1 (right panel).
- Western blot analysis of Klf4, Oct4, Sox2, c‐Myc pluripotent proteins expression in E14 cells treated with FA synthesis inhibitor C75 or α‐LA (left panel) or in E14 cells expressing shAcc1 (right panel).
Further, to study the role of FA synthesis in maintenance of ESC pluripotency, we treated E14 cells with oleic acid. As a result, supplementation of oleic acid in culture medium significantly elevated the protein expression of pluripotent genes in E14 cells (Fig 2I, left panel). Moreover, forced overexpression of Acc1 also led to enhanced protein expression of the pluripotent genes in E14 cells (Fig 2I, right panel). On the other hand, blocking FA synthesis by C75 or α‐LA or by knocking down the rate‐limiting enzyme Acc1 significantly decreased the protein expression of pluripotent genes in E14 cells (Fig 2J). These data were all indicated that FA synthesis activation and its products are important for ES cells to maintain their pluripotency.
Enhanced de novo FA synthesis promotes mitochondrial fission
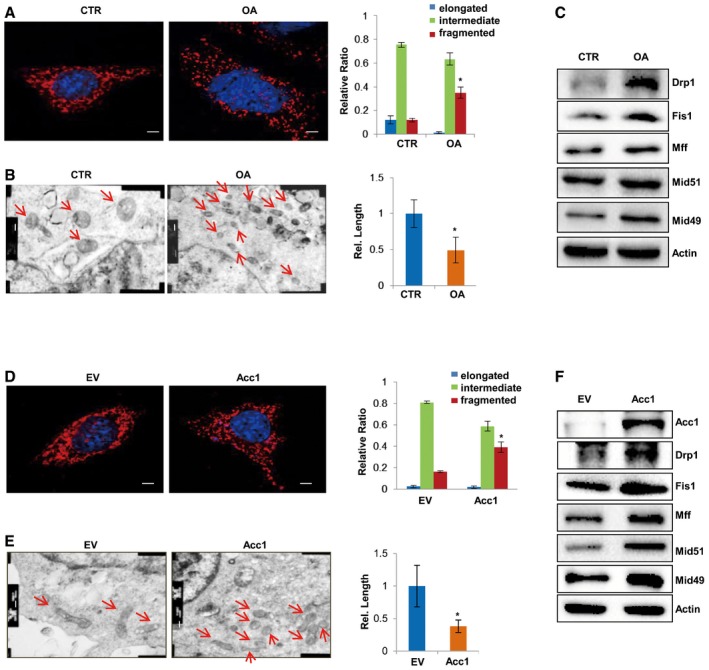
Next, we sought to determine how de novo FA synthesis affects cellular pluripotency and iPSC induction. Since lipogenesis provides lipids for cell membranes and membranous organelles, such as mitochondria, for the integrity of cell structure (Currie et al, 2013), we used MitoTracker staining to observe the mitochondrial morphology by fluorescence confocal microscopy. Intriguingly, we observed that oleic acid‐treated MEF cells displayed a significantly increased proportion of cells with fragmented mitochondria (Fig 3A). Transmission electron microscopy analysis provided more direct evidence showing that oleic acid treatment markedly decreased mitochondrial size but increased mitochondrial numbers in MEF cells (Fig 3B). More interestingly, oleic acid treatment markedly enhanced protein expression of mitochondrial fission genes in MEF cells (Fig 3C) but decreased that of mitochondrial fusion genes (Fig EV2E), suggesting that oleic acid treatment induced mitochondria fission, resulting in smaller mitochondria in MEF cells. Moreover, forced overexpression of Acc1 significantly increased the proportion of cells in mitochondrial fission states, leading to an increase in fragmented and smaller mitochondria in MEF cells (Fig 3D and E). Consistently, Western blotting analysis revealed that the protein levels of mitochondrial fission genes were increased, while those of fusion genes were decreased in Acc1‐overexpressing MEF cells (Figs 3F and EV2F). Thus, our data indicated that enhanced FA synthesis promotes mitochondrial fission in MEF cells.
Figure 3. Enhanced de novo FA synthesis promotes mitochondrial fission.
-
AFluorescent confocal microscopy analysis of mitochondria in MEF cells treated with or without OA by MitoTracker staining (left panel). The relative numbers of mitochondria showing three different statuses were quantified from 300 cells under each condition (right panel). Nucleus was visualized by DAPI. Scale bars, 5 μm.
-
BTransmission electron microscopy analysis of mitochondrial ultrastructural morphology in MEF cells treated with or without OA (left panel). The relative length of mitochondria was measured under each condition (right panel). Scale bars, 200 nm.
-
CWestern blot analysis of mitochondrial fission‐related protein Drp1, Fis1, Mff, Mid51, and Mid49 in MEF cells treated with OA.
-
D–FMEF cells were stably overexpressing Acc1. Their mitochondria were visualized with MitoTracker staining by fluorescent confocal microscopy (D) or by transmission electron microscopy (E). Nucleus was visualized by DAPI (D). Mitochondrial fission‐related protein Drp1, Fis1, Mff, Mid51, and Mid49 were analyzed by Western blot (F). Scale bars, 5 μm (D) and 200 nm (E).
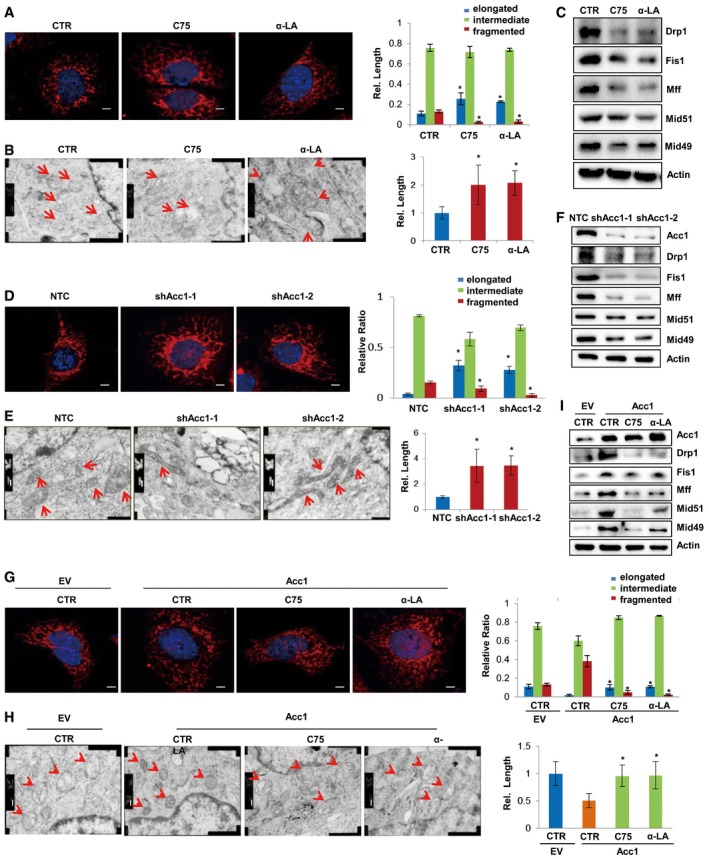
On the other hand, blocking de novo FA synthesis with C75 or α‐LA or knocking down Acc1 significantly increased the cell population with elongated mitochondria but decreased the cell population with fragmented mitochondria when mitochondrial morphology was observed under confocal microscopy (Fig 4A and D). Electron microscope further revealed that C75 or α‐LA treatment or silencing Acc1 with shRNAs resulted in elongated mitochondria in MEF cells, exhibiting growing form of mitochondrial fusion, especially in shAcc1‐expressing MEF cells (Fig 4B and E). Western blotting analysis further demonstrated that C75 and α‐LA treatment or silencing Acc1 with shRNAs inhibited the mitochondrial fission protein expression (Fig 4C and F). Knockdown Acc1 in E14 cells also decreased protein levels of mitochondrial fission genes (Fig EV2G). These data further demonstrate that FA synthesis is involved in mitochondrial fission and fusion dynamic regulation. More interestingly, blocking de novo FA synthesis by adding C75 or α‐LA into medium abolished the enhanced mitochondrial fission induced by Acc1 overexpression in MEF cells (Fig 4G and H), suggesting that Acc1 induced mitochondrial fission via activating de novo FA synthesis. Consistently, Western blotting analysis showed that C75 or α‐LA treatment attenuated Acc1‐mediated high expression of the mitochondrial fission proteins (Fig 4I). Taken together, these data demonstrate that Acc1‐regulated de novo FA synthesis is critical for the regulation of mitochondria fission and fusion dynamics, whose balance is closely related to the morphology change of mitochondria.
Figure 4. Blockade of de novo FA synthesis inhibits mitochondrial fission.
-
A–CMEF cells treated with FA synthesis inhibitors C75 or α‐LA. Their mitochondria were visualized with MitoTracker staining by fluorescent confocal microscopy (A) or by transmission electron microscopy (B). Nucleus was visualized by DAPI (A). Mitochondrial fission‐related protein Drp1, Fis1, Mff, Mid51, and Mid49 were analyzed by Western blot (C). Scale bars, 5 μm (A) and 200 nm (B).
-
D–FMEF cells were infected with lenti‐viruses expressing NTC (none target control) or shAcc1. Their mitochondria were visualized with MitoTracker staining by fluorescent confocal microscopy (D) or by transmission electron microscopy (E). Nucleus was visualized by DAPI (D). Mitochondrial fission‐related protein Drp1, Fis1, Mff, Mid51, and Mid49 were analyzed by Western blot (F). Scale bars, 5 μm (D) and 200 nm (E).
-
G–IAcc1‐overexpressing MEF cells were treated with C75 or α‐LA. Their mitochondria were visualized with MitoTracker staining by fluorescent confocal microscopy (G) or by transmission electron microscopy (H). Nucleus was visualized by DAPI (G). Mitochondrial fission‐related protein Drp1, Fis1, Mff, Mid51, and Mid49 were analyzed by Western blot (I). Scale bars, 5 μm (G) and 200 nm (H).
Mitochondrial fission is critical for Acc1‐regulated iPSC generation and ESC pluripotency
Mitochondria are important intracellular organelles which provide energy for cells and are involved in many cellular events, such as cell growth, development, aging, and apoptosis (Balaban et al, 2005; Chan, 2006; Kim et al, 2011). Mitochondrial fission has been reported to play important roles in acquisition and maintaining cellular pluripotency (Vazquez‐Martin et al, 2012). In our experiments, we also observed that protein levels of mitochondrial fission genes gradually increased during the reprogramming of MEF cells by four factors (Fig EV3A), but gradually decreased during retinoic acid (RA)‐induced differentiation of E14 cells, accompanied by increased protein expression of mitochondrial fusion genes (Fig EV3B). Knocking down mitochondrial fission genes with shRNAs significantly inhibited, while overexpression of those genes enhanced, the AP‐ and SSEA1‐positive iPSC colonies formation from MEF cells (Fig EV3C and D), confirming that mitochondrial fission plays important roles in iPSC generation. More interestingly, knocking down mitochondrial fission genes by shRNAs in MEF cells abolished the accelerated iPSC formation induced by Acc1 overexpression (Fig 5A), suggesting that mitochondrial fission is involved in Acc1‐regulated iPSC generation. On the other hand, forced expression of Drp1, Mff, or Fis1 in MEF cells rescued the iPSC generation efficiency suppressed by shAcc1 (Fig 5B), further demonstrating that mitochondrial fission functions downstream of Acc1 in regulating cellular reprogramming. Of note, among the mitochondrial fission genes, Fis1 exhibited the most potent effects on Acc1‐regulated iPSC generation. Thus, we next focused on this gene for further study.
Figure EV3. Mitochondrial fission is involved in cellular reprogramming.
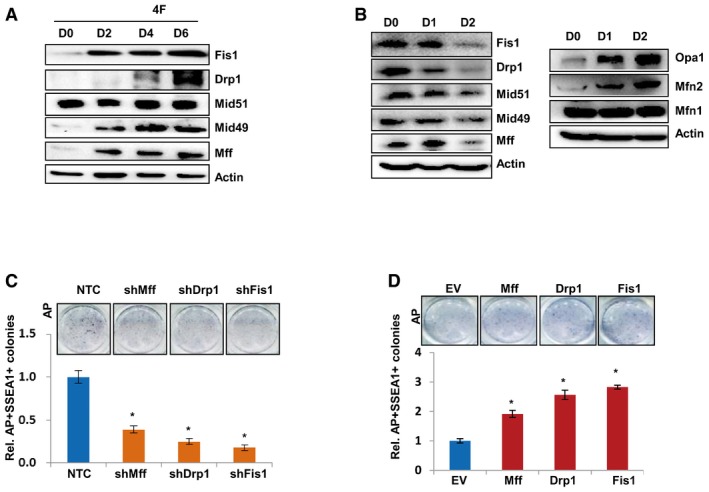
- Western blot analysis of Fis1, Drp1, Mid51, Mid49, and Mff protein levels in MEF cells infected with viruses expressing four factors (Klf4/Sox2/Oct4/c‐Myc) on days 0, 2, 4, and 6 during reprogramming.
- Western blot analysis of mitochondrial fission‐related protein Fis1, Drp1, Mid51, Mid49, Mff, and mitochondrial fusion‐related protein Opa1, Mfn1, and Mfn2 expression in E14 cells cultured in RA differentiation medium for 0, 24, and 48 h.
- MEF cells with Fis1, Drp1, or Mff knocked down by shRNAs were infected with viruses expressing four factors to induce iPSCs. AP staining (upper panel) showed the formed iPSC colonies. AP‐ and SSEA1‐positive iPSC numbers were counted (lower panel).
- Fis1, Drp1, or Mff overexpressing MEF cells were infected with viruses expressing four factors to induce iPSCs. AP staining (upper panel) showed the formed iPSC colonies. AP‐ and SSEA1‐positive iPSC numbers were counted (lower panel).
Figure 5. Mitochondrial fission is critical for Acc1‐regulated iPSC generation and ESC pluripotency.
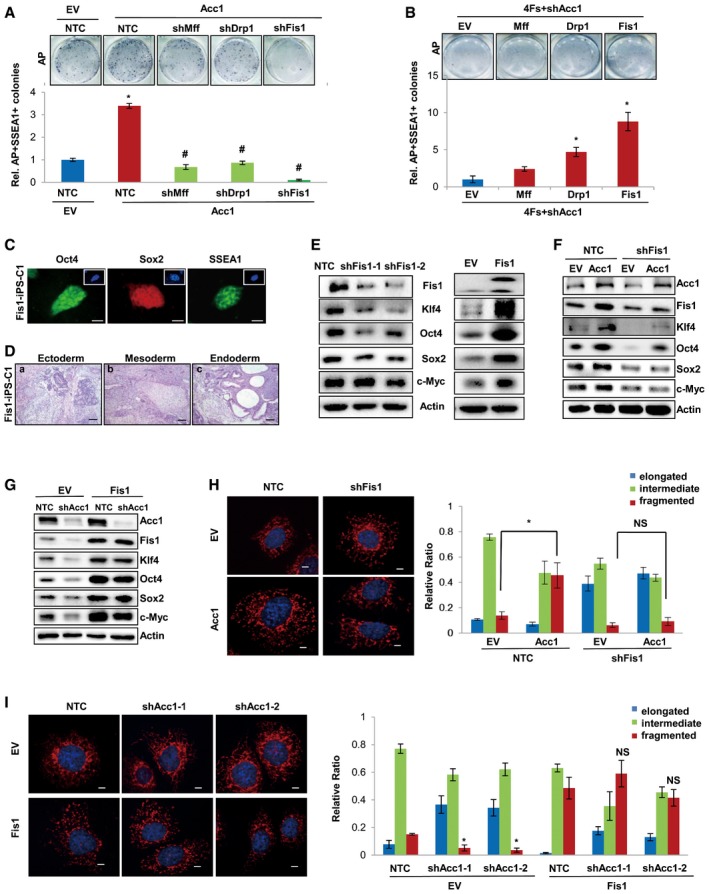
- MEFs were introduced with four factors and the indicated factors. AP‐ and SSEA1‐positive colonies were counted on day 14 after virus infection. AP staining of iPSC colonies is shown on the top.
- MEFs were introduced with the indicated factors. AP‐ and SSEA1‐positive colonies were counted on day 14 after virus infection. AP staining of iPSC colonies is shown on the top.
- IPSC induced from Fis1‐overexpressing MEF cells by four factors showing positive expression of Oct4, Sox2, and SSEA1. DAPI was used to stain cell nucleus. Scale bars, 20 μm.
- Hematoxylin and eosin staining of teratoma sections derived from iPSC cells generated from Fis1‐overexpressing MEF cells showed differentiation of iPSCs into cell types of three germ layers: immature neuroectodermal tubules (a), cartilage (b), and glandular tissue (c). Scale bars, 100 μm.
- Western blotting showing the expression of Fis1, Klf4, Oct4, Sox2, and c‐Myc in E14 cells expressing shFis1 (lift panel) or overexpressing Fis1 (right panel).
- Western blotting showing the protein expression of Acc1, Fis1, Klf4, Oct4, Sox2, and cMyc in Acc1‐overexpressing E14 cells with Fis1 knocked down by shRNA.
- Western blotting showing the protein expression of Acc1, Fis1, Klf4, Oct4, Sox2, and cMyc in Acc1 knocked down E14 cells with Fis1 overexpression.
- Acc1‐overexpressing MEF cells were further infected with viruses expressing shFis1. Their mitochondria were visualized by fluorescent confocal microscopy with MitoTracker staining (left panel). The relative numbers of mitochondria showing three different statuses were quantified from 300 cells under each condition (right panel). Nucleus was visualized by DAPI. Scale bars, 5 μm.
- Acc1 knocked down MEF cells were further infected with viruses expressing Fis1. Their mitochondria were visualized by fluorescent confocal microscopy with MitoTracker staining (left panel). The relative numbers of mitochondria showing three different statuses were quantified from 300 cells under each condition (right panel). Nucleus was visualized by DAPI. Scale bars, 5 μm.
Immunofluorescent staining of stem cell markers (Oct4, Sox2, and SSEA1) as well as teratoma formation experiment in vivo confirmed the pluripotency of the iPSC formed from Fis1‐overexpressed MEF cells (Fig 5C and D). Consistent with the effect on iPSC induction, shFis1 decreased while Fis1 overexpression increased the expression of pluripotent proteins in E14 cells (Fig 5E), confirming that mitochondria fission was critical for maintaining ESC pluripotency. More interestingly, knocking down Fis1 by shRNAs attenuated the elevated protein expression of pluripotent genes induced by Acc1 overexpression in E14 cells (Fig 5F). On the other hand, forced expression of Fis1 recovered the expression of pluripotent proteins suppressed by shAcc1 in E14 cells (Fig 5G), demonstrating that Fis1 is involved in Acc1‐regulated ESC pluripotency.
Mitochondria morphology study further revealed that knockdown of Fis1 abolished the Acc1‐induced increase in fragmented mitochondria, leading to elongated mitochondria in MEF cells (Fig 5H). Consistently, overexpression of Fis1 in MEF cells recovered the fragmented mitochondria suppressed by shAcc1, resulting in a mitochondrial fission state (Fig 5I). Collectively, these data demonstrated that Fis1‐regulated mitochondrial fission was downstream of Acc1 in facilitating pluripotency in ES cells and during cellular reprogramming.
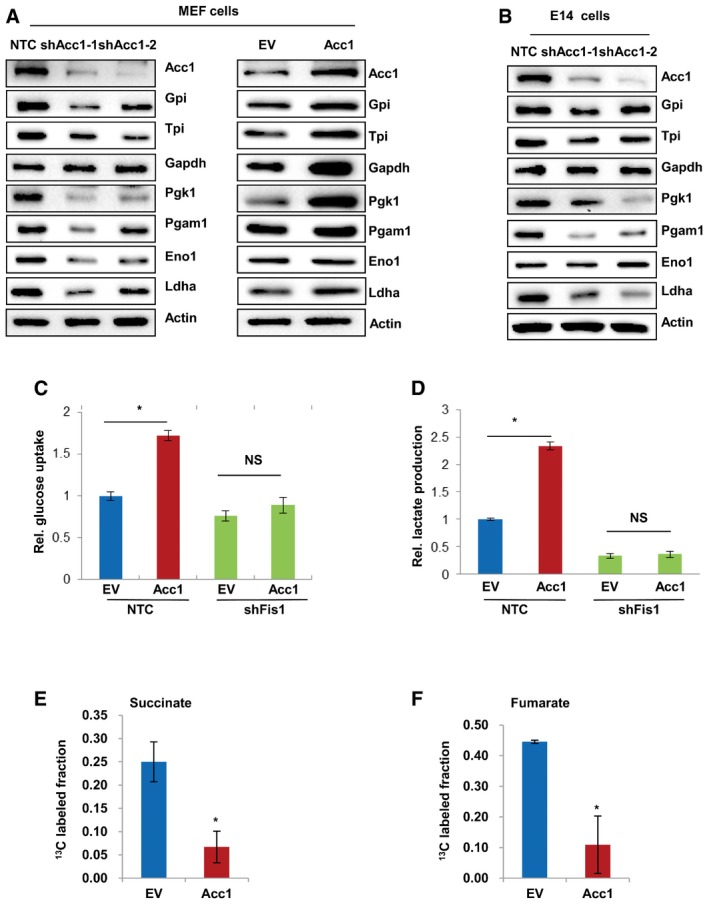
A recent report showed that mitochondrial fission influenced cellular reprogramming via affecting glucose metabolism, leading to a rapid aerobic glycolysis phenotype (Son et al, 2015). Thus, we further investigated whether de novo FA synthesis alters glucose metabolism by affecting mitochondrial fission and further affects cellular pluripotency. Western blot results showed that knocking down Acc1 significantly decreased, while Acc1 overexpression increased protein levels of glycolytic enzymes, in MEF cells (Fig EV4A). We also knocked down Acc1 in E14 cells and our Western blot analysis displayed that protein levels of a variety of glycolytic enzymes were decreased in Acc1‐knockdown E14 cells (Fig EV4B). These results all proved that Acc1‐mediated de novo FA synthesis regulates glycolysis. We further measured the cellular glycolysis level with two functional assays, glucose uptake and lactate production, and the data showed that knockdown of Fis1 abolished the Acc1‐enhanced cellular glucose uptake (Fig EV4C) and lactate production (Fig EV4D), demonstrating that Acc1 affected glycolysis via Fis1‐mediated mitochondrial fission. Consistently, using 1,2‐13C‐labeled acetate, we observed that Acc1 overexpression resulted in a significant decrease in TCA cycle flux as indicated by 13C isotope‐incorporated TCA metabolites such as succinate and fumarate (Fig EV4E and F), further suggesting that Acc1 overexpression might result in a shift of glucose metabolism from TCA cycle to aerobic glycolysis.
Figure EV4. Acc1 affects glycolysis via Fis1 in MEF cells.
-
AProtein levels of glycolytic enzymes were detected in Acc1 knocked down (left panel) or overexpressing (right panel) MEF cells by Western blot.
-
BWestern blot analysis of glycolytic enzymes in E14 cells expressing NTC or shAcc1.
-
C, DCellular glucose uptake (C) and lactate production (D) were measured in Acc1‐overexpressing MEF cells with further Fis1 knockdown by shRNAs. Values were normalized to cellular protein.
-
E, FEV‐ or Acc1‐overexpressing MEF cells were treated with 6 mM [1,2‐ 13C] acetate for 24 h, followed by GC‐MS analysis of the TCA cycle metabolites succinate (E) and furnarate (F).
Acc1 stabilizes Fis1 protein by inhibiting its acetylation modification
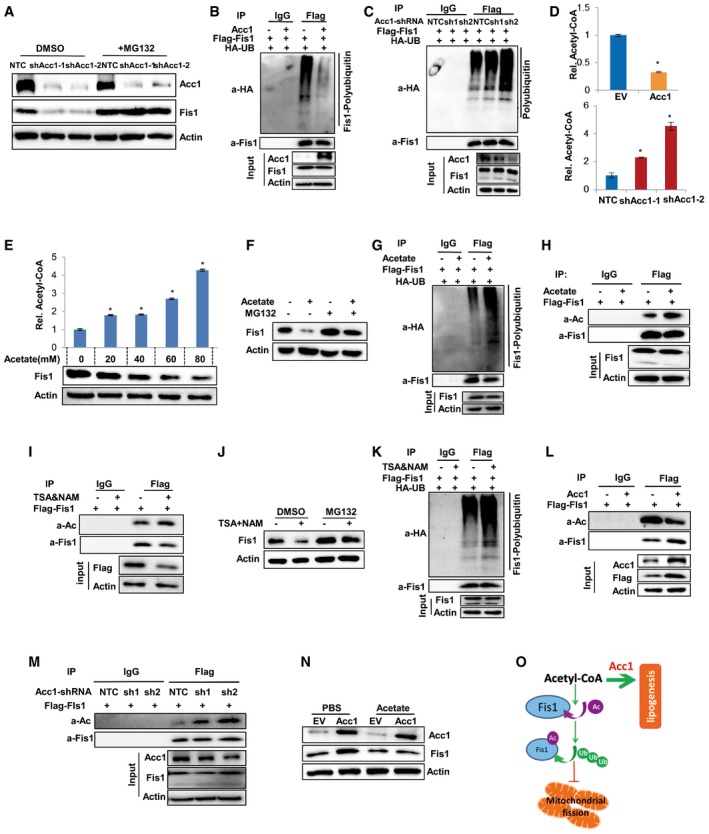
Addition of oleic acid, a metabolite product of fatty acid synthesis pathway, enhanced the protein expression of mitochondrial fission genes, including Fis1, suggesting that Acc1‐mediated FA synthesis affects mitochondrial fission gene expression. However, qRT‐PCR analysis showed no effect of Acc1 on Fis1 mRNA expression (Fig EV5A), indicating that Acc1 might regulate Fis1 at post‐transcriptional levels. Furthermore, when cells were treated with proteasome inhibitor MG132, the inhibitory effect of shAcc1 on Fis1 protein was abolished in MEF cells (Fig 6A), suggesting that Acc1 regulates Fis1 protein stability. Ubiquitination analysis revealed that overexpression of Acc1 led to decreased, while shAcc1 resulted in increased polyubiquitination of Fis1 in the presence of MG132 (Fig 6B and C), further demonstrating that Acc1 stabilizes Fis1 by inhibiting its proteasome degradation.
Figure EV5. De novo FA synthesis mediated by Acc1 affects mitochondrial fission via Fis1 acetylation or ER stress/UPR.
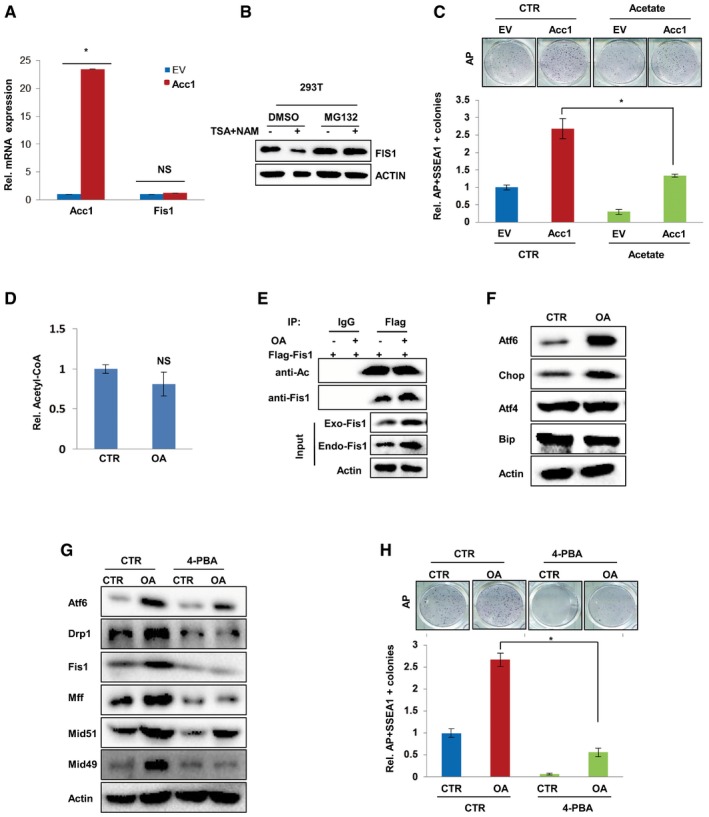
- qRT‐PCR analysis showed the mRNA expression of Acc1 and Fis1 in Acc1 overexpressing MEF cells.
- Western blotting showing the expression of FIS1 in 10 μM TSA‐ and 5 mM NAM‐treated 293T cells in the presence or absence of MG132.
- EV‐ or ACC1‐overexpressing MEFs were infected with viruses expressing four factors in the presence or absence of acetate treatment for 12 days. AP‐ and SSEA1‐positive colonies were counted on day 14 after virus infection. AP staining of iPSC colonies is shown on the top.
- Cellular AcCoA levels were measured in MEF cells treated with oleic acid by ELISA Kit. The values were normalized by cellular protein.
- Equal amount of proteins from Flag‐Fis1‐overexpressing MEF cells treated with or without OA were used for immunoprecipitation with anti‐Flag antibody, followed by blotting with anti‐acetylated‐lysine or anti‐Fis1.
- Western blot analysis of ER stress or UPR related protein Atf6, Chop, Atf4, and Bip in MEF cells treated with OA.
- Mitochondrial fission protein Drp1, Fis1, Mff, Mid51, and Mid49 were analyzed by Western blot in MEF cells treated with OA in the presence or absence of 0.5 mM 4‐PBA for 24 h.
- OA or/and 4‐PBA was added into the medium of MEF cells starting from 2 days after infection with viruses expressing four factors. AP staining (upper panel) showed the formed iPSC colonies. AP‐ and SSEA1‐positive iPSC colonies were counted (lower panel).
Figure 6. Acc1 stabilizes Fis1 protein by inhibiting its acetylation modification.
-
AWestern blotting showing the expression of Acc1 and Fis1 in shAcc1‐expressing MEF cells in the presence or absence of proteasome inhibitor MG132.
-
BHA‐Ub, Flag‐Fis1, and Acc1 cotransfected HEK293T cells were treated with MG132 (5 μM) for 6 h before lysis. Equal amount of proteins were used for immunoprecipitation with anti‐Flag antibody, followed by blotting with HRP‐conjugated anti‐HA or anti‐Fis1.
-
CHA‐Ub, Flag‐Fis1, and shAcc1 cotransfected HEK293T cells were treated with MG132 (5 μM) for 6 h before lysis. Equal amount of proteins were used for immunoprecipitation with anti‐Flag antibody, followed by blotting with HRP‐conjugated anti‐HA or anti‐Fis1.
-
DCellular AcCoA levels were measured in MEF cells with Acc1 overexpression (upper) or Acc1 knockdown (lower) by ELISA Kit. The values were normalized by the cellular protein.
-
ECellular AcCoA and Fis1 protein levels were detected in MEF cells treated with gradient concentrations of acetate for 48 h. The values were normalized by the cellular protein levels.
-
FWestern blotting showing protein expression of Fis1 in acetate‐treated MEF cells in the presence or absence of MG132.
-
GHA‐Ub and Flag‐Fis1 cotransfected HEK293T cells were treated with acetate for 48 h followed by incubated with MG132 (5 μM) for 6 h before lysis. Equal amount of proteins were used for immunoprecipitation with anti‐Flag antibody, followed by blotting with HRP‐conjugated anti‐HA or anti‐Fis1.
-
HEqual amount of proteins from Flag‐Fis1‐overexpressing MEF cells treated with or without acetate followed by incubated with MG132 (5 μM) were used for immunoprecipitation with anti‐Flag antibody, followed by blotting with anti‐acetylated‐lysine or anti‐Fis1.
-
IEqual amount of proteins from Flag‐Fis1‐overexpressing MEF cells treated with or without 10 μM TSA and 5 mM NAM were used for immunoprecipitation with anti‐Flag antibody, followed by blotting with anti‐acetylated‐lysine or anti‐Fis1.
-
JWestern blotting showing the protein expression of Fis1 in 10 μM TSA‐ and 5 mM NAM‐treated MEF cells in the presence or absence of MG132.
-
KHA‐Ub and Flag‐Fis1 cotransfected HEK293T cells were treated with or without 10 μM TSA and 5 mM NAM, followed by incubation with MG132 (5 μM) for 6 h before lysis. Equal amount of proteins were used for immunoprecipitation with anti‐Flag antibody, followed by blotting with HRP‐conjugated anti‐HA or anti‐Fis1.
-
L, MFlag‐Fis1‐overexpressing MEF cells were further infected with viruses expressing Acc1 (L) or shAcc1 (M) followed by incubated with MG132 (5 μM). Cells were lysed and equal amount of proteins were used for immunoprecipitation with anti‐Flag antibody, followed by blotting with anti‐acetylated‐lysine or anti‐Fis1.
-
NWestern blotting showing the expression of Fis1 and Acc1 in Acc1‐overexpressing MEF cells treated with or without acetate.
-
OWork model depicting that Acc1 regulates Fis1 acetylation and proteasome degradation.
Acc1 is an enzyme that catalyzes acetyl‐CoA to malonyl‐CoA. Our data showed that Acc1 overexpression significantly reduced, while shAcc1 markedly increased cellular AcCoA levels in MEF cells (Fig 6D). To address whether the changes in cellular AcCoA affect Fis1 protein stability, we treated MEF cells with acetate, which produced significant levels of intracellular AcCoA (Fig 6E, upper panel). Surprisingly, Western blotting analysis demonstrated that supplementation of acetate reduced Fis1 protein level in a dose‐dependent manner in MEF cells (Fig 6E, lower panel), which was blocked by proteasome inhibitor MG132 (Fig 6F). Ubiquitination analysis further revealed that addition of acetate promoted the polyubiquitination of Fis1 in the presence of MG132 (Fig 6G), suggesting that increased cellular AcCoA promotes Fis1 protein degradation by facilitating its polyubiquitination modification.
Cellular AcCoA concentration is important for protein acetylation modification (Pietrocola et al, 2015). We observed that supplementation of acetate resulted in elevated Fis1 acetylation modification (Fig 6H). To study whether acetylation was involved in Fis1 protein degradation, deacetylation inhibitors, TSA and NAM, were employed. As a result, treatment with TSA and NAM increased Fis1 acetylation and decreased Fis1 protein, which was blocked by proteasome inhibitor MG132 in MEF cells (Fig 6I and J). Similar results were observed in HEK293T cells (Fig EV5B). Ubiquitination analysis revealed that TSA and NAM treatment enhanced polyubiquitinated Fis1 in the presence of MG132 (Fig 6K), indicating that acetylation was involved in Fis1 protein degradation. Furthermore, we observed that forced expression of Acc1 inhibited, but shAcc1 enhanced, Fis1 acetylation modification (Fig 6L and M), which is consistent with the effect of Acc1 on cellular AcCoA levels (Fig 6D). More importantly, supplementation of acetate attenuated the Acc1‐enhanced Fis1 protein in MEF cells (Fig 6N) and the Acc1‐enhanced efficiency of iPSC generation (Fig EV5C), supporting that Acc1 regulates Fis1 protein stability and cellular pluripotency via affecting cellular AcCoA levels. Collectively, our data suggested that Acc1 activation reduced cellular AcCoA level, thereby inhibiting Fis1 protein acetylation, which blocked Fis1 protein polyubiquitination and subsequent proteasome degradation (Fig 6O).
Since both cellular AcCoA level and OA addition affect mitochondrial fission, we next went on to determine whether OA addition regulates mitochondrial fission via affecting cellular AcCoA levels. However, our experimental results showed that OA addition had no effect on cellular AcCoA (Fig EV5D). We also found that OA addition had no effect on Fis1 acetylation modification either (Fig EV5E), suggesting that OA regulates mitochondrial fission via some potential mechanisms other than AcCoA. A recent report confirmed that lipids induced endoplasmic reticulum (ER) stress, resulting in unfolded protein response (UPR; Danino et al, 2015). Thus, it is possible that de novo FA synthesis would affect ER stress and further facilitate mitochondrial fission (Youle & van der Bliek, 2012; Runkel et al, 2014). Indeed, our results showed that OA supplementation into the medium of MEF cells increased the protein levels of Atf6 and Chop, two ER stress markers, in MEF cells (Fig EV5F), suggesting activated Atf6/Chop ER stress pathway (Joshi et al, 2016). Furthermore, we added 4‐PBA, which inhibits ER stress in cells (Luo et al, 2015), in the medium of OA‐treated MEF cells and found that 4‐PBA attenuated OA‐induced mitochondrial fission protein expression in MEF cells (Fig EV5G). Blocking ER stress with 4‐PBA in MEF cells also attenuated the OA‐accelerated iPSC formation (Fig EV5H), suggesting that ER stress is involved in OA‐regulated mitochondrial fission and iPSC generation. Collectively, these data demonstrated that ER stress was downstream of OA in facilitating mitochondrial fission and cellular pluripotency.
ACC1 promotes reprogramming of human fibroblasts via FIS1
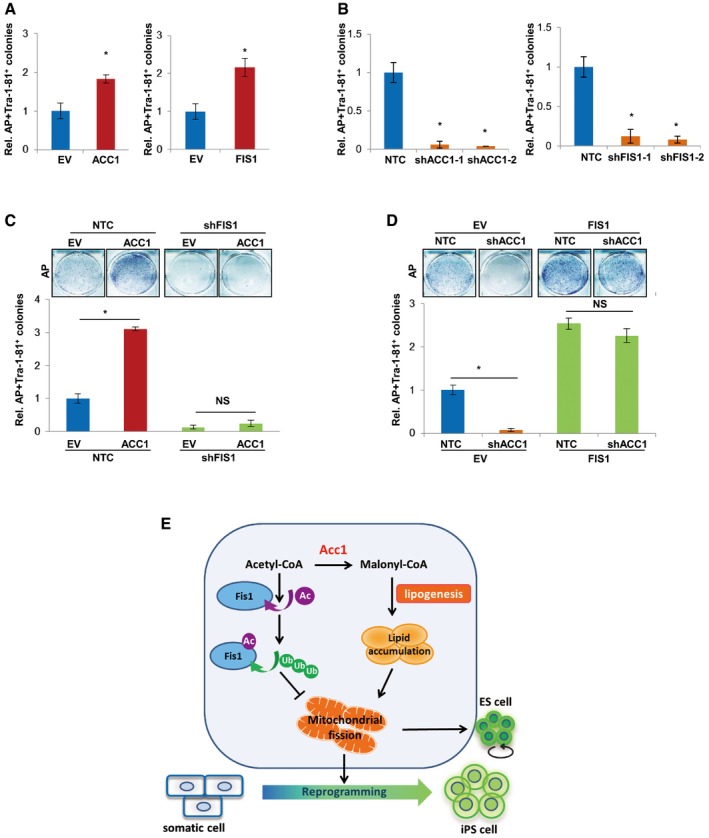
Next, we tested whether the ACC1‐regulated somatic cell reprogramming was conserved in human cells. Our results showed that forced overexpression of ACC1 or FIS1 increased the efficiency of four‐factor‐induced reprogramming from human IMR90 cells as determined by AP and TRA‐1‐81 staining (Fig 7A). Consistently, knocking down ACC1 or FIS1 with shRNAs significantly inhibited the reprogramming of IMR90 cells by four factors (Fig 7B), supporting that both ACC1 and FIS1 are critical for the reprogramming of human somatic cells. Furthermore, knockdown of FIS1 with shRNAs in IMR90 cells completely blocked the reprogramming‐promoting effect of ACC1 (Fig 7C), while overexpression of FIS1 in IMR90 cells markedly recovered the shACC1‐induced reduction in reprogramming efficiency (Fig 7D), judged from AP and TRA‐1‐81 staining results. In conclusion, these data suggest the conservation of ACC1‐FIS1 axis that regulates cellular reprogramming in both mouse and human cells.
Figure 7. ACC1 promotes reprogramming of human fibroblasts via affecting mitochondrial fission.
-
AAP‐ and TRA‐1‐81‐positive colonies were counted on day 30 after infection of ACC1‐ or FIS1‐overexpressing IMR90 cells using four factors.
-
BAP‐ and TRA‐1‐81‐positive colonies were counted on day 30 after infection of shACC1‐ or shFIS1‐expressing IMR90 cells using four factors.
-
C, DIMR90 were introduced with the indicated factors and Yamanaka four factors. AP‐ and TRA‐1‐81‐positive colonies were counted on day 30 after infection. AP staining of iPSC colonies is shown on the top.
-
EA working model: FA synthesis is critical for stem cell pluripotency via promoting mitochondrial fission. Acc1 activation increases AcCoA consumption, resulting in a decrease in the content of intracellular AcCoA, thereby blocking ubiquitin–proteasome degradation of Fis1 via acetylation. The enhanced Fis1 level leads to mitochondria fission. On the other hand, generated lipid products (such as OA) could drive mitochondrial dynamic equilibrium toward mitochondrial fission, which ultimately affects cellular pluripotency. This study reveals a critical involvement of FA synthesis pathway in promoting ESC pluripotency as well as iPSC formation via regulating mitochondrial fission.
Discussion
Cell metabolism not only provides energy and biomass for cell growth and proliferation but also regulates cell fate via transcriptional and epigenetic regulation mechanisms. Lipids are known to have many effects on stem cells, with most of them being focused on their roles as signaling molecules (Feher & Gidali, 1974; Rutherford et al, 2008; Kim et al, 2009; Das, 2011). Enhanced de novo lipogenesis was previously considered critical for maintaining the integrity of cell membrane and membrane‐enclosed organelle of cells during proliferation (Zhang et al, 2012a; Currie et al, 2013). Here, our study established that de novo FA synthesis promotes somatic cell reprogramming efficiency and ESC pluripotency maintenance by regulating mitochondrial fission. Our initial results confirmed that lipids accumulate as a result of enhanced de novo FA synthesis in pluripotent stem cells and during cellular reprogramming (Figs 1 and EV1). More importantly, we demonstrate that intervention of de novo FA synthesis exerts a significant impact on the acquisition and maintenance of cellular pluripotency (Fig 2). Mechanistically, we found that enhanced de novo FA synthesis induces mitochondrial fragmentation, confirmed as mitochondrial fission, which is an essential part of cellular remodeling during reprogramming. Furthermore, we found that Acc1, a rate‐limiting enzyme of FA synthesis, promoted mitochondrial fission by consuming intracellular AcCoA during activation of de novo FA synthesis, thereby inhibiting the acetylation status of Fis1, a mitochondrial fission‐associated molecule, which blocks Fis1 ubiquitination and proteasome degradation, resulting in elevated Fis1 protein and accelerated mitochondrial fission. At the same time, generated lipid products (such as OA) could drive mitochondrial dynamic equilibrium toward mitochondrial fission, not through its effect on AcCoA level but via a potential parallel mechanism, such as affecting ER stress/UPR. Taken together, our results revealed a novel mechanism that enhanced de novo FA synthesis promotes pluripotency by affecting mitochondrial remodeling (Fig 7E).
The currently known major roles for lipid metabolism include energy storage, incorporation into membrane, ATP production via oxidization, and generation of signaling molecules. Our novel discovery that de novo FA synthesis affects cellular pluripotency via mitochondrial remodeling suggests additional profound impact of lipid metabolism in determining cell fate. Mitochondria have many biological functions such as producing energy via oxidative phosphorylation, maintaining iron and calcium homeostasis, and providing a metabolic hub for amino acid, fatty acid, steroid hormone, and actors of cell apoptosis (Furt & Moreau, 2009). Since mitochondrial remodeling is tightly connected with its functions (Balaban et al, 2005; Chan, 2006; Xu et al, 2013), our data suggest that FA synthesis may regulate other mitochondria biological functions by inducing mitochondrial fission. For instance, Guido et al reported that mitochondrial fission affected the glycolytic metabolism which has been shown to facilitate iPSC generation from human and mouse fibroblasts (Guido et al, 2012; Son et al, 2013). In this regard, our study provided additional evidence that Acc1‐regulated de novo FA synthesis enhanced cell glycolytic metabolism through inducing Fis1‐mediated mitochondrial fission (Fig EV4). Therefore, we envision more roles to be revealed related to lipid‐mediated mitochondrial functions.
Several papers have documented previously that Acc1, the rate‐limiting enzyme of FA synthesis, affected cellular protein acetylation via inhibition of AcCoA (Galdieri & Vancura, 2012; Chow et al, 2014). Studies have also shown that acetylation influences the ubiquitination to stabilize proteins (Lin et al, 2013) or to promote the degradation of ubiquitinated protein (Qian et al, 2013). Fis1 was reported to be degraded via ubiquitination proteasome pathway (Zhang et al, 2012b). Thus, we investigated how Fis1 acetylation affected its ubiquitination. Our results demonstrated that treatment with acetate or TSA&NAM increased Fis1 acetylation modification in cells, which led to increased Fis1 ubiquitination, resulting in Fis1 protein degradation. Moreover, our data also demonstrated that Acc1 regulated Fis1 by affecting cellular AcCoA levels (Figs 6 and EV5). Of note, we focused on FA synthesis enzyme Acc1 rather than Acly or Fasn in this study because Acc1 is the rate‐limiting enzyme of de novo FA synthesis pathway. The role of Acly or Fasn on cellular pluripotency could be of potential interest for further studies. For mitochondrial fission genes, we only focused on the role of Fis1, in this regulatory pathway. It remains to be studied whether the other mitochondrial fission factors might have the same regulatory mechanism. Additionally, it was reported recently that impeded de novo lipogenesis impacts lipid‐sensitive signaling network and transcription circuits, which is critical for maintaining the pluripotent state of stem cells (Folmes Clifford et al, 2013). Thus, it is open to suggest that there are still other mechanisms downstream of the lipogenesis to regulate cell pluripotency acquisition and maintenance. Nevertheless, our novel discovery that lipogenesis regulates cellular pluripotency via mitochondrial remodeling might serve to invite more mechanistic insights that will further advance our understanding of pluripotency substantially.
Materials and Methods
Cell culture and reagents
MEF cells were obtained from E13.5 CF1 mouse embryos. Feeder cells were prepared by treating MEF cells with mitomycin C. MEF cells, feeder cells, and IMR90 cells were all cultured in DMEM medium supplemented with 1% penicillin–streptomycin, 10% FBS, and 0.1 mM nonessential amino acids. Mouse iPS and ES cells were cultured in 0.1% gelatin‐coated dishes in DMEM containing 15% KnockOut SR (KSR) XenoFree Kit, 0.1 mM nonessential amino acids, 2 mM l‐glutamax, 55 μM β‐mercaptoethanol, 1 mM sodium pyruvate, and 103 U/ml mouse Leukemia Inhibitory Factor (mLIF, ESG1107 from Millipore). Mouse iPSC and ES cells cultured on feeder layers used the DMDM containing 15% ES‐standard FBS instead of KSR. Human HEK293T cells were cultured in DMEM containing 10% heat‐inactivated fetal bovine serum (FBS) and 1% penicillin–streptomycin. Cell culture medium and reagents were purchased from Thermo Fisher Scientific. Gelatin (G1890), C75 (C5490), a‐lipoic acid (T1395), acetate (S5636), and oleic acid(O1383) were purchased from Sigma‐Aldrich. V6.5 cell line was from Yangming Wang's laboratory (Cao et al, 2015) and E14 cell line was from Jinsong Li's laboratory. ESC2 cell line was from Qi Zhou's laboratory, which was established by themselves (Zhao et al, 2009; Zhang et al, 2013).
Induction of pluripotent stem cells
For mouse iPS cell induction, HEK293T cells were transfected with pMXs‐based vectors expressing mouse Klf4, Sox2, Oct4, c‐Myc (Addgene), or other proteins of interest. Forty‐eight hours after transfection, the supernatant of culture medium containing virus particles was collected, filtered, and supplemented with 8 μg/ml polybrene (Sigma‐Aldrich). Equal amounts of virus supernatant expressing four Yamanaka factors and other interested genes were mixed and used to infect pre‐seeded CF‐1 MEF cells. Two days after infection, the medium was replaced with mES medium. Six days after infection, MEF cells were reseeded onto feeder cells. The mES medium was changed everyday. AP‐ or SSEA1‐positive colonies were counted on day 14 after infection.
For human iPS cell induction, viral supernatants produced from transfected HEK293T cells were concentrated by Centricon (Millipore), followed by infecting IMR90 cells. Six days after infection, IMR90 cells were reseeded onto feeder cells. The medium was replaced with fresh hES medium and was changed everyday. AP‐ and TRA‐1‐81‐positive colonies were counted on day 30 after infection.
Nile red staining and alkaline phosphatase staining
Cultured cells were fixed with 4% paraformaldehyde (PFA) solution and stained with final concentration 0.05 μg/ml Nile Red (19123; Sigma) for 30 min, followed by washing with PBS and staining with DAPI. The images were captured by immunofluorescence microscopy. Mouse and human iPS cells were fixed with 4% PFA, stained with the BCIP/NBT solution which is the alkaline phosphatase substrate, followed by washing with PBS for three times to stop the reaction (C3206; Beyotime).
Triglyceride and AccoA measurement
Cells were lysed in RIPA buffer with 1% NP‐40 (Sangon Bio) for 45 min. Cellular triglyceride and AcCoA were measured with the Biochemical Triglyceride Determination Kit (F001‐2; NJJC Bio) and the AcCoA ELISA Kit (JM‐E536; TSZ), respectively, following the manufacturer's instructions. The values were normalized to cellular protein concentration.
Liquid chromatography–mass spectrometry (LC‐MS) analysis of metabolites
Cells were incubated in culture medium supplemented with 25 mM [U‐13C6]‐labeled glucose (CLM‐1396; Cambridge) for 48 h or 3.3% 2H‐labeled water (2H2O; DLM‐6DB; Cambridge) for 0, 12, 24, and 36 h. Metabolites were extracted from cells as previously described (Viant et al, 2005; Dietmair et al, 2010). Briefly, cells were collected and immediately flash‐frozen in liquid N2. Metabolites were extracted with 50% ice‐cold acetonitrile by ultrasonication, followed by centrifugation to remove protein. Samples were analyzed using Hypersil™ GOLD HPLC column (25003‐152130; Thermo) in the Thermo LTO ORBITRAP XL LC/MS system. Peaks representing each metabolite were extracted and analyzed using Xcablibur software. 13C‐labeled metabolite values were presented by dividing the labeled ions with total ion intensity.
Gas chromatography–mass spectrometry (GC‐MS) analysis of metabolites
Cells were incubated in the low‐glucose culture medium supplemented with 6 mM 1,2‐13C‐labeled acetate (CLM‐440‐1; Cambridge) for 24 h. Metabolites were extracted from cells as previously described (Carey et al, 2015; Huang et al, 2016). Briefly, cells were collected and immediately flash‐frozen in liquid N2. After repeated freezing and thawing, metabolites were extracted with ice‐cold methanol, followed by centrifugation to remove protein. The supernatant was dried in an evaporator overnight and resuspended in 200 μl pyridine. Metabolites were further derivatized by addition of 25 μl of MTBSTFA containing 1% t‐BDMCS at 60°C for 1 h. Samples were analyzed using Agilent 5MS column in the Agilent 7890/5975C GC/MS system (Agilent Technologies, Santa). Peaks representing each metabolite were extracted and integrated using MassHunter software (Agilent Technologies). 13C‐labeled metabolite data are presented as percentage of 13C‐labeled metabolites, which was calculated by dividing the labeled ions with total ion intensity. The distribution of mass isotopomers was corrected for natural abundance using defined intensities from known standards. The natural abundance of the tracers and derivative reagents were corrected using IsoCor software.
Immunofluorescence assays
Cells cultured on 0.1% gelatin‐coated cover slips were fixed with 4% paraformaldehyde (PFA) for 30 min followed by permeabilization with 0.5% Triton X‐100 and blocking with 3% bovine serum albumin (BSA). Cells were incubated with primary antibodies overnight at 4°C, followed by washing with PBS and incubating with the secondary antibodies. Oct4 (09‐0023; Stemgent), Sox2 (AB5603; Millipore), and SSEA1 (SC‐21702; Santa Cruz) antibodies were used to detect mouse iPSCs and TRA‐1‐81 antibody (MAB4381A4; Millipore) was used to detect human iPSCs. Cells were also stained with DAPI (D9542; Sigma). The images were captured by fluorescence microscope (Olympus).
MitoTracker staining and fluorescent confocal microscopy
MEF cells grown on 0.1% gelatin‐coated cover slips were incubated with pre‐warmed (37°C) staining solution containing 100 nM MitoTracker Red CMXRos (M7512; Invitrogen) for 30 min. After washing with PBS, the cells were fixed with 4% formaldehyde and stained with DAPI. Images were visualized by fluorescent confocal microscope (ZEISS710), and data were analyzed by ZEN microscope imaging software (ZEISS). The percentages of cells with three different types of mitochondrial morphology were calculated as previously described (Kim et al, 2011).
Transmission electron microscopy
MEF cells were harvested by trypsin digestion and fixed with 2.5% glutaraldehyde. After washing with PBS, the cells were further fixed with 1% osmic acid. Then, the cells were sequentially immersed in epoxy propane, epoxy propane: epoxy resin, epoxy resin after dehydrating with sequential washes in 30, 50, 70, 80, 95, and 100% ethanol. Samples in epoxy resin were heated at 40°C for 12 h and then at 60°C for 48 h. The ultrathin sections (70 nm) were collected on copper grids and stained using electronic staining regents. Images were obtained with JEM‐1230 transmission electron microscope.
Quantitative real‐time PCR
Total RNA was prepared using Trizol followed by DNase (Ambion) treatment and reverse transcription with iScript cDNA Synthesis Kit (Promaga). QRT‐PCR was performed using iQ SYBR Green Supermix on the iCycler Real‐time System (Bio‐Rad). Primer sequences are listed in Table EV1. The relative expression of individual transcript was normalized to 18S rRNA. The fold change of target mRNA expression was calculated based on threshold cycle (C t), where ΔC t = Cttarget − C t18S and Δ(ΔC t) = ΔC t Control − ΔC t Indicated condition.
Western blot
Cells were collected and lysed using RIPA buffer (50 mM Tris‐Cl, pH 8.0, 150 mM NaCl, 5 mM EDTA, 0.1% SDS, 1% NP‐40). Equal amounts of protein in the lysates were boiled and separated by SDS–PAGE. Primary antibodies against the following proteins were used: cMyc (Epitomics), Oct4 (Stemgene), Sox2 (Millipore), DRP1 (Novus), SSEA1 (Santa cruz), HRP‐HA (Abcam); Acc1, Acly, Fasn, Klf4, Fis1, Mff, Mid49, Mid51, Actin, Opa1, Mfn1, Mfn2, Gpi1, Tpi1, Gapdh, Pgk1, Pgam1, Eno1, and Ldha (Proteintech). HRP‐conjugated anti‐rabbit or anti‐mouse (Bio‐Rad) secondary antibodies were used, and the signal was detected using the Western ECL Substrate (Bio‐Rad). Antibody information is listed in Table EV2.
Plasmid construction and RNA interference
CDS sequence of Acc1, Fis1, Drp1, or Mff gene was cloned into the lentiviral vector pSin‐EF2‐Pur (Addgene). All shRNAs in PLKO vector were commercially purchased (Sigma‐Aldrich).
Teratoma formation experiment
3×10⁶ mouse iPS cells were suspended in 100 μl of DMEM containing 50% matrigel, followed by injection into the dorsal flank of BALb/c nude mice (SJA Laboratory Animal Company). Four weeks after injection, tumors were extracted and fixed with 4% formaldehyde. The samples were embedded in paraffin, sectioned, and stained with hematoxylin and eosin. All animal procedures were approved by the Animal Research Ethics Committee of the University of Science and Technology of China.
Acetylation and ubiquitylation assay
For acetylation analysis, cells were collected and lysed with 0.1% NP‐40 buffer. After centrifugation to remove cell debris, equal amount of proteins in the supernatant were pre‐cleared with beads and incubated with anti‐flag antibody (F1804; Sigma) to immunoprecipitate the Flag‐tagged Fis1 protein. After washing with NP‐40 buffer, the immunoprecipitants were eluted and separated by SDS–PAGE. Acetylated‐lysine antibody (#9441; cell signaling) was used to detect the acetylated Fis1 protein.
For ubiquitylation analysis, samples were treated as described before (Jiang et al, 2011). Briefly, HA‐ubiquitin‐transfected cells were collected and lysed with Tris–HCl buffer containing 1% SDS (Tris[pH 7.5]), 0.5 mM EDTA, and 1 mM DTT. Then, the lysates were diluted 10‐fold in Tris–HCl buffer. After centrifugation to remove cell debris, equal amount of proteins in the supernatant were pre‐cleared with beads and incubated with antibody to immunoprecipitate the Fis1 protein. After washing with Tris–HCl buffer containing 0.5% NP‐40, the immunoprecipitants were eluted and separated by SDS–PAGE. Anti‐HA antibody was used to detect the ubiquitinated Fis1 protein.
Statistical analysis
Data were presented as the mean (± SD) of at least three independent experiments. Student's t‐test was used to calculate P‐values for the data which have only two groups, while ANOVA was used to calculate P‐values for the data which have more than two groups. Statistical significance is displayed in figures by * or # (P < 0.05).
Author contributions
PG and HZ conceived this study. LihW, LH, MW, HZ, and PG designed the experiments. Lihua Wang, TZ, LinW, YC, XZ, XH, LH, and ST performed the experiments. PG, HZ, and LihW wrote the paper. All the authors read and approved the manuscript.
Conflict of interest
The authors declare that they have no conflict of interest.
Supporting information
Expanded View Figures PDF
Table EV1
Table EV2
Source Data for Expanded View
Review Process File
Source Data for Figure 1
Source Data for Figure 2
Source Data for Figure 3
Source Data for Figure 4
Source Data for Figure 5
Source Data for Figure 6
Acknowledgements
Our work is supported in part by National Basic Key Research Program of China (2014CB910600), National Nature Science Foundation of China (81530076, 81525022, 31371429, 31571472 and 81372148), Chinese Academy of Sciences (XDA01010404), the Fundamental Research Funds for the Central Universities, the Development Foundation of Hefei Center for Physical Science and Technology, and CAS Key laboratory of Innate Immunity and Chronic Disease.
The EMBO Journal (2017) 36: 1330–1347
Contributor Information
Huafeng Zhang, Email: hzhang22@ustc.edu.cn.
Ping Gao, Email: pgao2@ustc.edu.cn.
References
- Balaban RS, Nemoto S, Finkel T (2005) Mitochondria, oxidants, and aging. Cell 120: 483–495 [DOI] [PubMed] [Google Scholar]
- Cao Y, Guo WT, Tian SY, He XP, Wang XW, Liu XM, Gu KL, Ma XY, Huang D, Hu L, Cai YP, Zhang HF, Wang YM, Gao P (2015) miR‐290/371‐Mbd2‐Myc circuit regulates glycolytic metabolism to promote pluripotency. EMBO J 34: 609–623 [DOI] [PMC free article] [PubMed] [Google Scholar]
- Carey BW, Finley LW, Cross JR, Allis CD, Thompson CB (2015) Intracellular alpha‐ketoglutarate maintains the pluripotency of embryonic stem cells. Nature 518: 413–416 [DOI] [PMC free article] [PubMed] [Google Scholar]
- Chan DC (2006) Mitochondria: dynamic organelles in disease, aging, and development. Cell 125: 1241–1252 [DOI] [PubMed] [Google Scholar]
- Chow JDY, Lawrence RT, Healy ME, Dominy JE, Liao JA, Breen DS, Byrne FL, Kenwood BM, Lackner C, Okutsu S, Mas VR, Caldwell SH, Tomsig JL, Cooney GJ, Puigserver PB, Turner N, James DE, Villén J, Hoehn KL (2014) Genetic inhibition of hepatic acetyl‐CoA carboxylase activity increases liver fat and alters global protein acetylation. Mol Metab 3: 419–431 [DOI] [PMC free article] [PubMed] [Google Scholar]
- Currie E, Schulze A, Zechner R, Walther Tobias C, Farese Robert V (2013) Cellular fatty acid metabolism and cancer. Cell Metab 18: 153–161 [DOI] [PMC free article] [PubMed] [Google Scholar]
- Danino H, Ben‐Dror K, Birk R (2015) Exocrine pancreas ER stress is differentially induced by different fatty acids. Exp Cell Res 339: 397–406 [DOI] [PubMed] [Google Scholar]
- Das UN (2011) Influence of polyunsaturated fatty acids and their metabolites on stem cell biology. Nutrition 27: 21–25 [DOI] [PubMed] [Google Scholar]
- Dietmair S, Timmins NE, Gray PP, Nielsen LK, Kromer JO (2010) Towards quantitative metabolomics of mammalian cells: development of a metabolite extraction protocol. Anal Biochem 404: 155–164 [DOI] [PubMed] [Google Scholar]
- Feher I, Gidali J (1974) Prostaglandin‐E2 as stimulator of hemopoietic stem‐cell proliferation. Nature 247: 550–551 [DOI] [PubMed] [Google Scholar]
- Fernández‐Galilea M, Pérez‐Matute P, Prieto‐Hontoria PL, Sáinz N, López‐Yoldi M, Houssier M, Martínez JA, Langin D, Moreno‐Aliaga MJ (2014) α‐lipoic acid reduces fatty acid esterification and lipogenesis in adipocytes from overweight/obese subjects. Obesity 22: 2210–2215 [DOI] [PubMed] [Google Scholar]
- Foletta VC, Palmieri M, Kloehn J, Mason S, Previs SF, McConville MJ, Sieber OM, Bruce CR, Kowalski GM (2016) Analysis of mammalian cell proliferation and macromolecule synthesis using deuterated water and gas chromatography‐mass spectrometry. Metabolites 6: E34 [DOI] [PMC free article] [PubMed] [Google Scholar]
- Folmes CDL, Nelson TJ, Martinez‐Fernandez A, Arrell DK, Lindor JZ, Dzeja PP, Ikeda Y, Perez‐Terzic C, Terzic A (2011) Somatic oxidative bioenergetics transitions into pluripotency‐dependent glycolysis to facilitate nuclear reprogramming. Cell Metab 14: 264–271 [DOI] [PMC free article] [PubMed] [Google Scholar]
- Folmes CDL, Dzeja PP, Nelson TJ, Terzic A (2012) Metabolic plasticity in stem cell homeostasis and differentiation. Cell Stem Cell 11: 596–606 [DOI] [PMC free article] [PubMed] [Google Scholar]
- Folmes Clifford DL, Park S, Terzic A (2013) Lipid metabolism greases the stem cell engine. Cell Metab 17: 153–155 [DOI] [PubMed] [Google Scholar]
- Furt F, Moreau P (2009) Importance of lipid metabolism for intracellular and mitochondrial membrane fusion/fission processes. Int J Biochem Cell Biol 41: 1828–1836 [DOI] [PubMed] [Google Scholar]
- Galdieri L, Vancura A (2012) Acetyl‐CoA carboxylase regulates global histone acetylation. J Biol Chem 287: 23865–23876 [DOI] [PMC free article] [PubMed] [Google Scholar]
- Guido C, Whitaker‐Menezes D, Lin Z, Pestell RG, Howell A, Zimmers TA, Casimiro MC, Aquila S, Ando’ S, Martinez‐Outschoorn UE, Sotgia F, Lisanti MP (2012) Mitochondrial fission induces glycolytic reprogramming in cancer‐associated myofibroblasts, driving stromal lactate production, and early tumor growth. Oncotarget 3: 798–810 [DOI] [PMC free article] [PubMed] [Google Scholar]
- Huang D, Li TT, Wang L, Zhang L, Yan RH, Li K, Xing SG, Wu GW, Hu L, Jia WD, Lin SC, Dang CV, Song LB, Gao P, Zhang HF (2016) Hepatocellular carcinoma redirects to ketolysis for progression under nutrition deprivation stress. Cell Res 26: 1112–1130 [DOI] [PMC free article] [PubMed] [Google Scholar]
- Ito K, Carracedo A, Weiss D, Arai F, Ala U, Avigan DE, Schafer ZT, Evans RM, Suda T, Lee C‐H, Pandolfi PP (2012) A PML–PPAR‐δ pathway for fatty acid oxidation regulates hematopoietic stem cell maintenance. Nat Med 18: 1350–1358 [DOI] [PMC free article] [PubMed] [Google Scholar]
- Jiang WQ, Wang SW, Xiao MT, Lin Y, Zhou LS, Lei QY, Xiong Y, Guan KL, Zhao SM (2011) Acetylation regulates gluconeogenesis by promoting PEPCK1 degradation via recruiting the UBR5 ubiquitin ligase. Mol Cell 43: 33–44 [DOI] [PMC free article] [PubMed] [Google Scholar]
- Joshi AU, Kornfeld OS, Mochly‐Rosen D (2016) The entangled ER‐mitochondrial axis as a potential therapeutic strategy in neurodegeneration: a tangled duo unchained. Cell Calcium 60: 218–234 [DOI] [PMC free article] [PubMed] [Google Scholar]
- Kim MH, Kim MO, Kim YH, Kim JS, Han HJ (2009) Linoleic acid induces mouse embryonic stem cell proliferation via Ca2+/PKC, PI3K/Akt, and MAPKs. Cell Physiol Biochem 23: 53–64 [DOI] [PubMed] [Google Scholar]
- Kim H, Scimia MC, Wilkinson D, Trelles RD, Wood MR, Bowtell D, Dillin A, Mercola M, Ronai ZA (2011) Fine‐tuning of Drp1/Fis1 availability by AKAP121/Siah2 regulates mitochondrial adaptation to hypoxia. Mol Cell 44: 532–544 [DOI] [PMC free article] [PubMed] [Google Scholar]
- Knobloch M, Braun SMG, Zurkirchen L, von Schoultz C, Zamboni N, Araúzo‐Bravo MJ, Kovacs WJ, Karalay Ö, Suter U, Machado RAC, Roccio M, Lutolf MP, Semenkovich CF, Jessberger S (2012) Metabolic control of adult neural stem cell activity by Fasn‐dependent lipogenesis. Nature 493: 226–230 [DOI] [PMC free article] [PubMed] [Google Scholar]
- Kuhajda FP, Landree LE, Ronnett GV (2005) The connections between C75 and obesity drug‐target pathways. Trends Pharmacol Sci 26: 541–544 [DOI] [PubMed] [Google Scholar]
- Lin R, Tao R, Gao X, Li T, Zhou X, Guan K‐L, Xiong Y, Lei Q‐Y (2013) Acetylation stabilizes ATP‐citrate lyase to promote lipid biosynthesis and tumor growth. Mol Cell 51: 506–518 [DOI] [PMC free article] [PubMed] [Google Scholar]
- Luo T, Chen BH, Wang XB (2015) 4‐PBA prevents pressure overload‐induced myocardial hypertrophy and interstitial fibrosis by attenuating endoplasmic reticulum stress. Chem‐Biol Interact 242: 99–106 [DOI] [PMC free article] [PubMed] [Google Scholar]
- Paglialunga S, Dehn CA (2016) Clinical assessment of hepatic de novo lipogenesis in non‐alcoholic fatty liver disease. Lipids Health Dis 15: 159 [DOI] [PMC free article] [PubMed] [Google Scholar]
- Panopoulos AD, Yanes O, Ruiz S, Kida YS, Diep D, Tautenhahn R, Herrerias A, Batchelder EM, Plongthongkum N, Lutz M, Berggren WT, Zhang K, Evans RM, Siuzdak G, Izpisua Belmonte JC (2012) The metabolome of induced pluripotent stem cells reveals metabolic changes occurring in somatic cell reprogramming. Cell Res 22: 168–177 [DOI] [PMC free article] [PubMed] [Google Scholar]
- Pietrocola F, Galluzzi L, Bravo‐San Pedro José M, Madeo F, Kroemer G (2015) Acetyl coenzyme a: a central metabolite and second messenger. Cell Metab 21: 805–821 [DOI] [PubMed] [Google Scholar]
- Prigione A, Rohwer N, Hoffmann S, Mlody B, Drews K, Bukowiecki R, Blumlein K, Wanker EE, Ralser M, Cramer T, Adjaye J (2014) HIF1 alpha modulates cell fate reprogramming through early glycolytic shift and upregulation of PDK1‐3 and PKM2. Stem Cells 32: 364–376 [DOI] [PMC free article] [PubMed] [Google Scholar]
- Qian M‐X, Pang Y, Liu Cui H, Haratake K, Du B‐Y, Ji D‐Y, Wang G‐F, Zhu Q‐Q, Song W, Yu Y, Zhang X‐X, Huang H‐T, Miao S, Chen L‐B, Zhang Z‐H, Liang Y‐N, Liu S, Cha H, Yang D, Zhai Y et al (2013) Acetylation‐mediated proteasomal degradation of core histones during DNA repair and spermatogenesis. Cell 153: 1012–1024 [DOI] [PMC free article] [PubMed] [Google Scholar]
- Rabol R, Petersen KF, Dufour S, Flannery C, Shulman GI (2011) Reversal of muscle insulin resistance with exercise reduces postprandial hepatic de novo lipogenesis in insulin resistant individuals. Proc Natl Acad Sci USA 108: 13705–13709 [DOI] [PMC free article] [PubMed] [Google Scholar]
- Runkel ED, Baumeister R, Schulze E (2014) Mitochondrial stress: balancing friend and foe. Exp Gerontol 56: 194–201 [DOI] [PubMed] [Google Scholar]
- Rutherford S, Garcia‐Gonzalo FR, Izpisúa Belmonte JC (2008) Albumin‐associated lipids regulate human embryonic stem cell self‐renewal. PLoS ONE 3: e1384 [DOI] [PMC free article] [PubMed] [Google Scholar]
- Samavarchi‐Tehrani P, Golipour A, David L, Sung H‐K, Beyer TA, Datti A, Woltjen K, Nagy A, Wrana JL (2010) Functional genomics reveals a BMP‐driven mesenchymal‐to‐epithelial transition in the initiation of somatic cell reprogramming. Cell Stem Cell 7: 64–77 [DOI] [PubMed] [Google Scholar]
- Shiraki N, Shiraki Y, Tsuyama T, Obata F, Miura M, Nagae G, Aburatani H, Kume K, Endo F, Kume S (2014) Methionine metabolism regulates maintenance and differentiation of human pluripotent stem cells. Cell Metab 19: 780–794 [DOI] [PubMed] [Google Scholar]
- Shyh‐Chang N, Locasale JW, Lyssiotis CA, Zheng YX, Teo RY, Ratanasirintrawoot S, Zhang J, Onder T, Unternaehrer JJ, Zhu H, Asara JM, Daley GQ, Cantley LC (2013) Influence of threonine metabolism on S‐adenosylmethionine and histone methylation. Science 339: 222–226 [DOI] [PMC free article] [PubMed] [Google Scholar]
- Son M‐Y, Choi H, Han Y‐M, Sook Cho Y (2013) Unveiling the critical role of REX1 in the regulation of human stem cell pluripotency. Stem Cells 31: 2374–2387 [DOI] [PubMed] [Google Scholar]
- Son MJ, Kwon Y, Son MY, Seol B, Choi HS, Ryu SW, Choi C, Cho YS (2015) Mitofusins deficiency elicits mitochondrial metabolic reprogramming to pluripotency. Cell Death Differ 22: 1957–1969 [DOI] [PMC free article] [PubMed] [Google Scholar]
- Takahashi K, Yamanaka S (2006) Induction of pluripotent stem cells from mouse embryonic and adult fibroblast cultures by defined factors. Cell 126: 663–676 [DOI] [PubMed] [Google Scholar]
- Turner SM, Murphy EJ, Neese RA, Antelo F, Thomas T, Agarwal A, Go C, Hellerstein MK (2003) Measurement of TG synthesis and turnover in vivo by (2HO)‐O‐2 incorporation into the glycerol moiety and application of MIDA. Am J Physiol Endocrinol Metab 285: E790–E803 [DOI] [PubMed] [Google Scholar]
- Varum S, Rodrigues AS, Moura MB, Momcilovic O, Easley CA, Ramalho‐Santos J, Van Houten B, Schatten G (2011) Energy metabolism in human pluripotent stem cells and their differentiated counterparts. PLoS ONE 6: e20914 [DOI] [PMC free article] [PubMed] [Google Scholar]
- Vazquez‐Martin A, Cufi S, Corominas‐Faja B, Oliveras‐Ferraros C, Vellon L, Menendez JA (2012) Mitochondrial fusion by pharmacological manipulation impedes somatic cell reprogramming to pluripotency: new insight into the role of mitophagy in cell stemness. Aging 4: 393–401 [DOI] [PMC free article] [PubMed] [Google Scholar]
- Vazquez‐Martin A, Corominas‐Faja B, Cufi S, Vellon L, Oliveras‐Ferraros C, Menendez OJ, Joven J, Lupu R, Menendez JA (2013) The mitochondrial H+‐ATP synthase and the lipogenic switch New core components of metabolic reprogramming in induced pluripotent stem (iPS) cells. Cell Cycle 12: 207–218 [DOI] [PMC free article] [PubMed] [Google Scholar]
- Viant MR, Bundy JG, Pincetich CA, de Ropp JS, Tjeerdema RS (2005) NMR‐derived developmental metabolic trajectories: an approach for visualizing the toxic actions of trichloroethylene during embryogenesis. Metabolomics 1: 149–158 [Google Scholar]
- Wang J, Alexander P, Wu LJ, Hammer R, Cleaver O, McKnight SL (2009) Dependence of mouse embryonic stem cells on threonine catabolism. Science 325: 435–439 [DOI] [PMC free article] [PubMed] [Google Scholar]
- Wang S, Xia P, Ye B, Huang G, Liu J, Fan Z (2013) Transient activation of autophagy via Sox2‐mediated suppression of mTOR is an important early step in reprogramming to pluripotency. Cell Stem Cell 13: 617–625 [DOI] [PubMed] [Google Scholar]
- Wu Y, Chen KS, Liu XY, Huang LL, Zhao DY, Li LP, Gao M, Pei DQ, Wang CG, Liu XG (2016) Srebp‐1 interacts with c‐Myc to enhance somatic cell reprogramming. Stem Cells 34: 83–92 [DOI] [PubMed] [Google Scholar]
- Xu XL, Duan SL, Yi F, Ocampo A, Liu GH, Belmonte JCI (2013) Mitochondrial regulation in pluripotent stem cells. Cell Metab 18: 325–332 [DOI] [PubMed] [Google Scholar]
- Yanes O, Clark J, Wong DM, Patti GJ, Sanchez‐Ruiz A, Benton HP, Trauger SA, Desponts C, Ding S, Siuzdak G (2010) Metabolic oxidation regulates embryonic stem cell differentiation. Nat Chem Biol 6: 411–417 [DOI] [PMC free article] [PubMed] [Google Scholar]
- Youle RJ, van der Bliek AM (2012) Mitochondrial fission, fusion, and stress. Science 337: 1062–1065 [DOI] [PMC free article] [PubMed] [Google Scholar]
- Zhang J, Nuebel E, Daley GQ, Koehler CM, Teitell MA (2012a) Metabolic regulation in pluripotent stem cells during reprogramming and self‐renewal. Cell Stem Cell 11: 589–595 [DOI] [PMC free article] [PubMed] [Google Scholar]
- Zhang Q, Wu J, Wu R, Ma J, Du G, Jiao R, Tian Y, Zheng Z, Yuan Z (2012b) DJ‐1 promotes the proteasomal degradation of Fis1: implications of DJ‐1 in neuronal protection. Biochem J 447: 261–269 [DOI] [PubMed] [Google Scholar]
- Zhang Y, Teng F, Luo GZ, Wang M, Tong M, Zhao XY, Wang L, Wang XJ, Zhou Q (2013) MicroRNA‐323‐3p regulates the activity of polycomb repressive complex 2 (PRC2) via targeting the mRNA of embryonic ectoderm development (Eed) gene in mouse embryonic stem cells. J Biol Chem 288: 23659–23665 [DOI] [PMC free article] [PubMed] [Google Scholar]
- Zhang J, Ratanasirintrawoot S, Chandrasekaran S, Wu Z, Ficarro SB, Yu C, Ross CA, Cacchiarelli D, Xia Q, Seligson M, Shinoda G, Xie W, Cahan P, Wang L, Ng SC, Tintara S, Trapnell C, Onder T, Loh YH, Mikkelsen T et al (2016) LIN28 regulates stem cell metabolism and conversion to primed pluripotency. Cell Stem Cell 19: 66–80 [DOI] [PubMed] [Google Scholar]
- Zhao XY, Li W, Lv Z, Liu L, Tong M, Hai T, Hao J, Guo CL, Ma QW, Wang L, Zeng FY, Zhou Q (2009) iPS cells produce viable mice through tetraploid complementation. Nature 461: 86–U88 [DOI] [PubMed] [Google Scholar]
- Zhao W, Li Q, Ayers S, Gu Y, Shi Z, Zhu Q, Chen Y, Wang Helen Y, Wang R‐F (2013) Jmjd3 inhibits reprogramming by upregulating expression of INK4a/Arf and targeting PHF20 for ubiquitination. Cell 152: 1037–1050 [DOI] [PMC free article] [PubMed] [Google Scholar]
Associated Data
This section collects any data citations, data availability statements, or supplementary materials included in this article.
Supplementary Materials
Expanded View Figures PDF
Table EV1
Table EV2
Source Data for Expanded View
Review Process File
Source Data for Figure 1
Source Data for Figure 2
Source Data for Figure 3
Source Data for Figure 4
Source Data for Figure 5
Source Data for Figure 6