

Abstract
Cerebral organoids recapitulate human brain development at a considerable level of detail, even in the absence of externally added signaling factors. The patterning events driving this self‐organization are currently unknown. Here, we examine the developmental and differentiative capacity of cerebral organoids. Focusing on forebrain regions, we demonstrate the presence of a variety of discrete ventral and dorsal regions. Clearing and subsequent 3D reconstruction of entire organoids reveal that many of these regions are interconnected, suggesting that the entire range of dorso‐ventral identities can be generated within continuous neuroepithelia. Consistent with this, we demonstrate the presence of forebrain organizing centers that express secreted growth factors, which may be involved in dorso‐ventral patterning within organoids. Furthermore, we demonstrate the timed generation of neurons with mature morphologies, as well as the subsequent generation of astrocytes and oligodendrocytes. Our work provides the methodology and quality criteria for phenotypic analysis of brain organoids and shows that the spatial and temporal patterning events governing human brain development can be recapitulated in vitro.
Keywords: development, human brain development, neurogenesis, organoid, patterning, signaling
Subject Categories: Development & Differentiation
Introduction
Our current understanding of mammalian brain development is largely derived from studies in animal models, particularly rodents. These studies have shed light on a variety of processes underlying brain patterning, neurogenesis, and neuronal positioning and maturation (Taverna et al, 2014). How these processes are conserved in humans and how they are modified to explain the enormous increase in size and complexity in the human brain, however, is much less clear (Lui et al, 2011; Geschwind & Rakic, 2013).
To overcome this problem and to model human neurodevelopmental disorders, multiple 3D culture systems have recently been developed that allow the recapitulation of human brain development in vitro starting from pluripotent stem cells (PSCs; Eiraku et al, 2008; Mariani et al, 2012; Kadoshima et al, 2013; Paşca et al, 2015). Such in vitro systems have great potential for revealing the human‐specific aspects of formation of particular brain regions, but the extent to which these isolated brain regions model overall patterning is limited.
We have recently developed a 3D culture model termed cerebral organoids (Lancaster et al, 2013) that can recapitulate many aspects of brain development, including the establishment of discrete regions of the central nervous system (retina, forebrain, and choroid plexus), organized germinal zones, and both radial and tangential migration of cortical neuron populations. Unlike other protocols (Eiraku et al, 2008; Chambers et al, 2009; Kadoshima et al, 2013; Mariani et al, 2015; Paşca et al, 2015; Qian et al, 2016), cerebral organoids are not patterned by externally added growth factors or morphogens, suggesting that their development relies purely on self‐organization.
In vivo, the developing forebrain is patterned by morphogen gradients secreted from organizing centers within the forebrain (Borello & Pierani, 2010). After neural tube closure, three main signaling centers determine forebrain anterior–posterior and dorsal–ventral patterning. Rostrally, the anterior neural ridge secretes Fgf8 family molecules. At the midline of the cortical hemispheres, the cortical hem secretes Wnts (Wnt2b, Wnt3a, Wnt5a) and Bmps (Bmp2, Bmp4, Bmp6, Bmp7). The cortical hem regulates dorsal–ventral patterning of the cerebral cortex by promoting dorsal forebrain and repressing ventral forebrain identity (Caronia‐Brown et al, 2014). Opposite to the hem, at the sharp boundary between dorsal and ventral telencephalon, the pallial–subpallial boundary (PSPB) or antihem separates dorsal from ventral forebrain. Cells at the PSPB express the soluble Wnt inhibitor Sfrp2, Fgf7, and the EGF‐like factors, Tgf alpha, Nrg1, and Nrg3 (O'Leary et al, 2007; Medina & Abellán, 2009; Subramanian et al, 2009; Grove & Monuki, 2013).
Following establishment of these key morphogenetic boundaries, neural progenitors begin to generate neurons of specific identities following a precise temporal program (Molyneaux et al, 2007). The first neurons to populate the dorsal cortex are the Cajal–Retzius cells, which are generated in regions adjacent to the cortex including hem and PSPB and then migrate into the early preplate of the cortex. Subsequently, neurons are generated from radial glia in an inside‐out manner with deep‐layer identities being generated early, and superficial identities being generated later. Finally, forebrain neural stem cells terminate their divisions by producing glial identities including astrocytes and oligodendrocytes. While this pattern of development is highly stereotypical across mammals, the extent to which these spatial and temporal patterning events can be recapitulated in vitro is currently unknown.
In contrast to actual organs, organoids lack externally recognizable body axes that guide their gross morphogenesis and help with phenotypic analysis. Therefore, cerebral organoids require careful analysis to decipher regional identities and spatial organization. Here, we systematically analyze regional identity in cerebral organoids using established markers to reveal discrete dorsal and ventral forebrain regions. We show that variability within organoid cultures can be addressed by using a critical marker set during the analysis of development. This approach, along with clearing of organoids to determine the overall 3D arrangement, reveals that major forebrain signaling centers are present within organoids and neuronal and glial differentiation occurs in a timed manner matching that seen in vivo.
Results
Forebrain regional specification in cerebral organoids
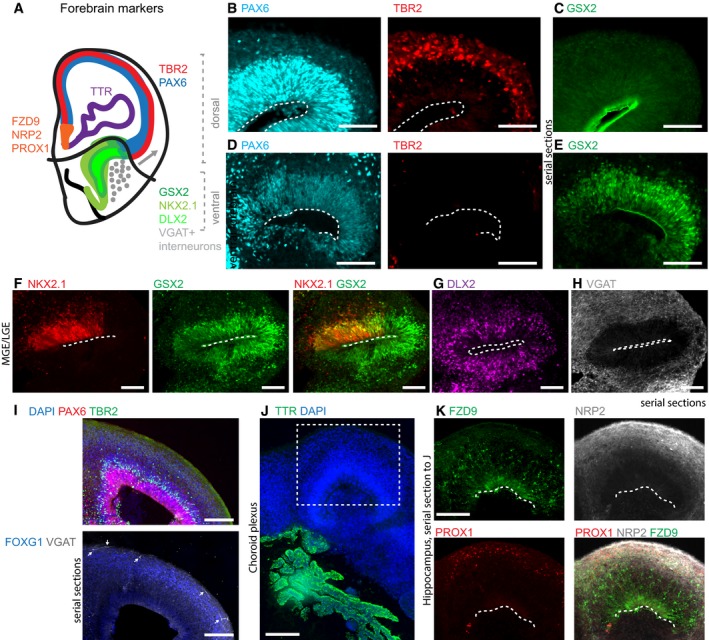
Cerebral organoids form complex tissues of variable identities. However, because tissues appear somewhat randomly distributed throughout the organoids, and without body axes as a neuroanatomical guide, it can be difficult to unambiguously identify specific brain regions. We therefore researched numerous markers of brain regional identity and cross‐checked them for consistency between mouse and human brain development (Eurexpress and BrainSpan; Geffers et al, 2012; Miller et al, 2014). In vivo, the forebrain is subdivided into various distinct regions that assume stereotypic positions along the dorso‐ventral (D/V) and medio‐lateral axes (Sanes et al, 2011). The choroid plexus forms at the most medial–dorsal site, followed by the developing hippocampus and dorsal cortex. Laterally, the cortex abuts the ventral forebrain that comprises the ganglionic eminences (GE) during embryonic development. The GE is the major source of cortical interneurons. It is subdivided into medial, lateral, and caudal ganglionic eminences (LGE, MGE, CGE) that can be distinguished by marker expression and morphology (Hansen et al, 2013; Ma et al, 2013). We ascertained a set of markers that are specific for these subregions and were used for subsequent analyses either in isolation or in combination with other markers (summarized in Fig 1A).
Figure 1. Cerebral organoids organize into different forebrain regions.
-
ASummary of the markers used for forebrain regional characterization.
-
B, CDorsal forebrain regions stain (B) positive for PAX6 (cyan, radial glia progenitors in the VZ) and TBR2 (red, intermediate progenitors in the SVZ) and (C) negative for GSX2 (green). GSX2 staining along the ventricle is unspecific signal, and panel (C) shows a serial section to (B).
-
D, ELGE/CGE regions can be (D) PAX6 positive (cyan) and are TBR2 negative (red), (E) but are positive for GSX2 (green). Panel (E) shows a serial section to (D).
-
F–H(F) MGE stains for NKX2.1 (red) and can be found continuous with LGE/CGE positive for GSX2 (green). Radially organized NKX2.1 is very rare. (G) Progenitors and young neurons of the GE stain for DLX2 (magenta). (H) VGAT interneurons (white) are densely arranged around GE regions. Panels (G) and (H) are serial sections to (F).
-
IVGAT‐positive interneurons (white arrows) can be found in dorsal forebrain tissue marked by TBR2‐positive cells (green) in the SVZ. Shown are serial sections.
-
J, K(J) TTR (green) stains choroid plexus. (K) Expression of hippocampal markers adjacent to choroid plexus. Panel (K) shows a serial section to (J), and the boxed area in (J) is analyzed. Note that fully differentiated hippocampal tissue expressing all three markers was relatively rare.
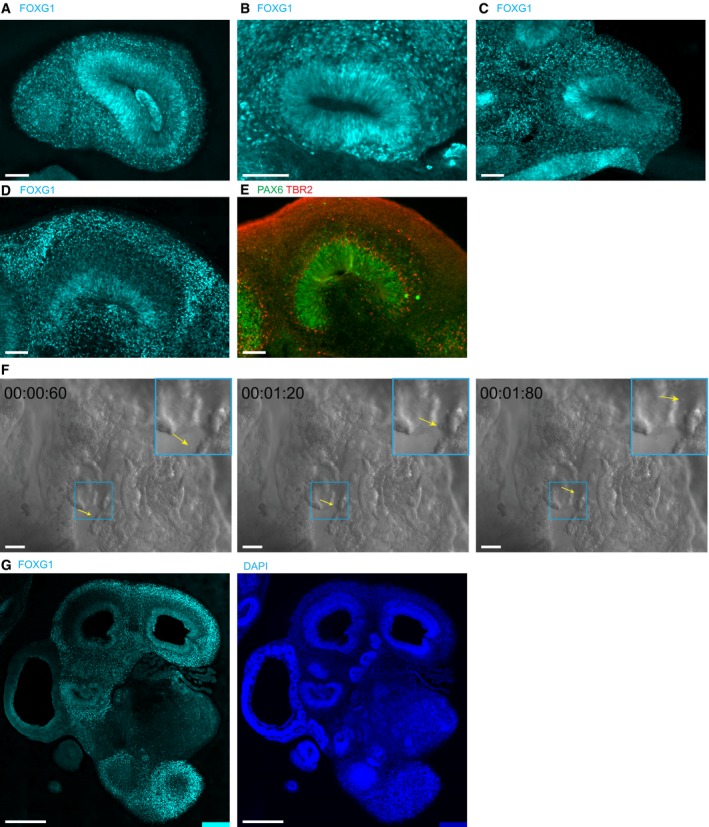
A hallmark of the cerebral organoid approach is the formation of large continuous forebrain tissues (here defined as radially organized tissues greater than 400 μm in diameter) containing well‐defined progenitor zones and neuronal populations. Our analysis was restricted to those regions as they are structurally more similar to the developing human brain and better defined than small neural rosettes that can also form within cerebral organoids. To determine the D/V identity of the forebrain tissues (forebrain identity was confirmed by staining for FOXG1: Fig EV1), we performed a series of immunohistochemical stainings. We stained for PAX6, widely considered a dorsal cortical marker (Georgala et al, 2011; Shi et al, 2012) and the more definitive dorsal forebrain marker TBR2. PAX6 is expressed in radial glial progenitors in the ventricular zone (VZ), and these radial glia give rise to intermediate progenitor cells, which downregulate PAX6, express TBR2, and move to the subventricular zone (SVZ; Englund, 2005). Besides regions with cortical morphology containing both PAX6‐ and TBR2‐positive cells in the typical VZ–SVZ arrangement (Fig 1B; Lancaster et al, 2013), we detected many PAX6‐positive but TBR2‐negative tissues with typical radial VZ organization (Fig 1D). Although these regions were morphologically indistinguishable from dorsal forebrain, subsequent staining for GSX2 confirmed their ventral GE identity, more specifically LGE or CGE (Fig 1D and E). Notably, when separate GSX2+ and TBR2+ regions were present within a single organoid, PAX6 staining revealed a lower level of expression in GSX2+ regions, consistent with the in vivo pattern (Georgala et al, 2011). However, in organoids without TBR2+ dorsal regions with high PAX6 as a reference, PAX6 staining alone or in combination with morphology is not sufficient to assign dorsal cortex identity in brain organoid models. Thus, cerebral organoids contain both dorsal and ventral forebrain regions with organized progenitor zones and regional identity needs to be confirmed by careful marker stainings.
Figure EV1. FOXG1 staining verifies forebrain identities (related to Figs 1 and 2).
- A–D
-
EPAX6 and TBR2 staining of a tissue section adjacent to the one shown in Fig 1J and K, confirming dorsal forebrain identity by TBR2 staining.
-
FA particle (yellow arrow) moving unidirectionally within choroid plexus tissue (frames from Movie EV1).
-
GSerial section of tissue shown in Fig 2A to confirm forebrain identity by FOXG1 staining.
To further characterize the GSX2‐positive GE regions, we used the MGE marker NKX2.1. NKX2.1 staining in radially organized tissues was very rare and overlapped with GSX2 where it probably marked the transition from LGE to MGE, a pattern also seen in vivo (Fig 1F). In vivo, the GE generates interneurons that migrate tangentially into the dorsal forebrain (Hansen et al, 2013; Ma et al, 2013). Indeed, GE regions in organoids not only contained abundant DLX2‐positive intermediate progenitors and young neurons (Fig 1G), but were also surrounded by abundant VGAT‐positive GABAergic interneurons (Fig 1H). Consistent with previous observations (Lancaster et al, 2013), interneurons were also found in dorsal forebrain regions (Fig 1I, arrows) in the majority of organoids containing dorsal regions (Table EV1). However, in two organoids of almost exclusively dorsal identity, we did not find interneurons, which could be due to the absence of a ventral region. Thus, the interaction of regions with different cortical identities is preserved in organoid models.
In addition to ventral GE, cerebral organoids also contained the medial parts of the dorsal forebrain, the choroid plexus, and in rare cases hippocampus (Lancaster et al, 2013). Choroid plexus (CP) stained positive for the CP marker TTR (Fig 1J). Live imaging of choroid plexus tissue revealed small unidirectionally moving particles, indicating that circulation of the surrounding liquid by CP cilia is preserved in organoids (Fig EV1 and Movie EV1). Hippocampal tissues stained positive for the dorsal forebrain markers PAX6 and TBR2 (Fig EV1) and the hippocampal markers PROX1, FZD9, and NRP2 (Fig 1K). Thus, both lateral and medial cortical tissues can be uniquely identified in organoids.
Efficiency of generation of forebrain regions
To address the degree of variability in regional identity determination, we quantified dorsal or non‐dorsal identity of large forebrain regions in 104 organoids from 22 distinct experiments. For this, we generated 20‐μm sections spanning the entire volume of each organoid in 200‐μm intervals. Only tissues containing radially organized regions of more than 400 μm end‐to‐end diameter were analyzed (Fig 2A arrows; smaller rosettes, marked with “x”, were disregarded; FOXG1 staining was used to determine forebrain identity, Fig EV1). Importantly, we only processed organoids that passed the quality criteria previously described (Lancaster & Knoblich, 2014), namely clearing of EB borders before transfer to neural induction medium, formation of radially organized neuroepithelium in neural induction medium before Matrigel embedding, and outgrowth and development of defined buds in Matrigel without massive cyst formation and/or complete overgrowth by migratory cells.
Figure 2. Organization of large regions within cerebral organoids.
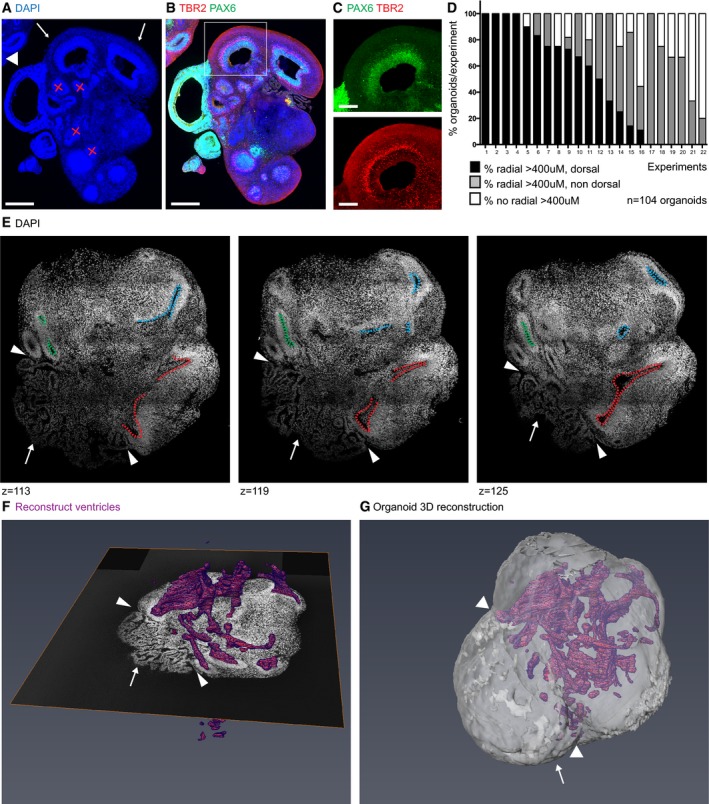
- Selection of organoids for analysis is based on large, radially organized tissues (arrows) as seen by DAPI staining on entire slides scanned by a fluorescence slide scanner. Rosette‐like structures (×) were disregarded. Arrows point at dorsal forebrain structures > 400 μm in diameter. The arrowhead marks a non‐forebrain structure (Fig EV1). Serial sections 200 μm apart through the entire organoids were analyzed. Each section contained two to six individual organoids that were used for analysis if at least one organoid contained radially organized tissue that was > 400 μm in diameter.
- Staining of organoids with PAX6 (green, RG in SVZ) and TBR2 (red, IP of dorsal forebrain in SVZ) to identify dorsal forebrain regions > 400 μm.
- Higher magnification image of tissue marked in (B) showing PAX6 and TBR2 staining.
- Quantification of experiments showing the percentage of organoids per experiment that contained dorsal forebrain regions > 400 μm, large radial tissue of non‐dorsal identity > 400 μm, or no large radial tissues > 400 μm. For each experiment, three to 11 organoids were analyzed at one or more time points between 30 and 70 days, and each bar represents an experiment. Organoids of all ages (30–70 days) were capable of efficiently generating dorsal forebrain tissue.
- Optical sections of an organoid cleared by SWITCH and stained by 4′,6‐diamidino‐2‐phenylindole (DAPI). Examples of individual ventricular zones belonging to one structure are marked in different colors. Arrowheads point to choroid plexus (arrow) attached to the organoid throughout multiple optical sections.
- The ventricular system of organoids, cleared by SWITCH and imaged entirely in 3D, was reconstructed by manually outlining the ventricular zone by a line in the program “Amira” every 9–10 μm through the entire stack. Example of one plane with the 3D rendered ventricular system in purple. Movie EV2 shows entire reconstruction. Arrowheads and arrow as in (E).
- 3D reconstruction of an entire organoid, arrow points to choroid plexus, arrowheads as in (E).
We imaged the entire volume of each organoid by an automated slide scanner and identified dorsal forebrain as tissue containing a radially organized VZ and staining positive for both PAX6 and TBR2, or FOXG1 and TBR2 (Fig 2B and C). We found large dorsal forebrain tissues in 16 out of 22 experiments (Fig 2D). Of these, 12 experiments displayed large dorsal regions to varying degrees, while four experiments contained dorsal forebrain tissues larger than 400 μm in all the organoids analyzed. In the six experiments where we could not find any tissues with large dorsal forebrain, the organoids either generated large radially organized regions with overall low efficiency or the tissue was of ventral, non‐dorsal, or unknown identity (Fig 2D).
Organoid clearing and 3D imaging reveal tissue interconnectivity
To visualize entire organoids in 3D, we used the recently described SWITCH protocol (Murray et al, 2015) that allows clearing and imaging of highly diffractive brain tissue. This enabled an unprecedented representation of organoid structure, revealing a high level of internal tissue connectivity. Most importantly, this experiment demonstrated that many of the cortical tissues that appeared isolated in 2D sections were instead part of one large heavily intertwined cortical region as they were connected only a few optical sections later (Fig 2E). We therefore marked all ventricles throughout the entire organoid and performed 3D reconstruction, revealing a complex three‐dimensional ventricular network within the organoid (Fig 2F and G, and Movie EV2).
These findings suggest that tissues of different dorsal–ventral forebrain identities might be connected in a single neuroepithelial structure within organoids. This structural organization may allow not only for short‐distance signaling between forebrain regions, but also long‐distance communication through signaling molecules secreted into the connected ventricular network. The presence of an elaborate CP (Fig 2E and F, arrow) attached to large, radially organized tissues (Fig 2E and F, arrowheads), and our findings that the CP generated unidirectional flow (Fig EV1 and Movie EV1), supports this hypothesis.
Cerebral organoids generate forebrain organizing centers
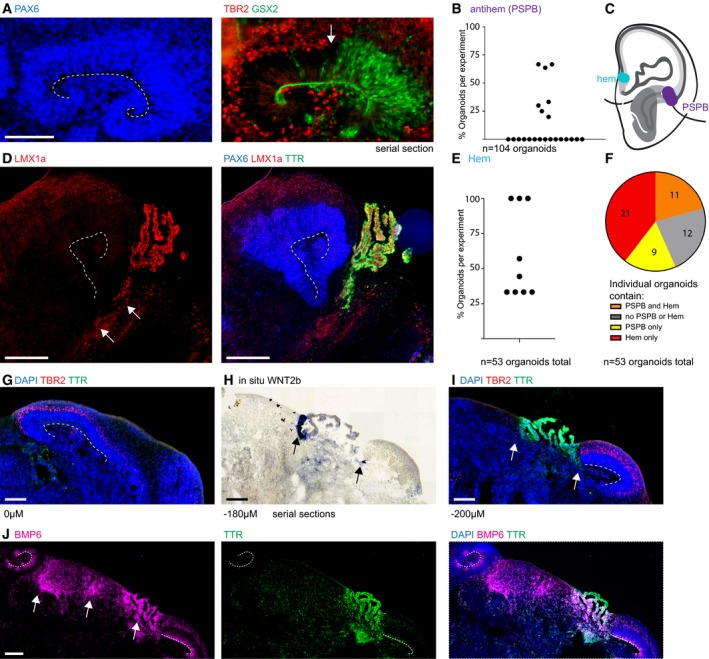
In vivo, the dorsal forebrain is patterned along the dorsal–ventral axis by two organizing centers: the cortical hem located medially between the choroid plexus and cortex, and the PSPB or antihem, separating the cortex from the lateral GE. To address whether organoids contain forebrain organizing centers that could influence the generation of dorsal and ventral forebrain regions, we performed immunohistochemistry to identify regions reminiscent of the cortical hem and the PSPB. To identify PSPB structures, we analyzed the same set of organoids as in Fig 2D. We identified the PSPB as dorsal forebrain tissue (PAX6+, TBR2+, GSX2−) directly abutting ventral forebrain tissue (GSX2+, PAX6+/−, TBR2−; Fig 3A). Indeed in seven out of 22 experiments, we found several tissues with a sharp boundary between dorsal and ventral forebrain tissues (Fig 3A and B). This staining is consistent with the arrangement of a PSPB (Fig 3C).
Figure 3. Cerebral organoids contain tissue reminiscent of forebrain organizing centers.
-
ATissue arrangement is reminiscent of the pallial–subpallial boundary (PSPB)/antihem with an abrupt termination of TBR2 staining (red) where GSX2 staining (green) begins (arrow). The whole tissue is positive for PAX6 (blue) on the adjacent section.
-
BQuantification of the percentage of organoids within individual experiments that contained tissues reminiscent of a PSPB; the same organoid dataset as in Fig 2D was analyzed.
-
CSchematic depiction of the organizing centers hem and PSPB within the forebrain.
-
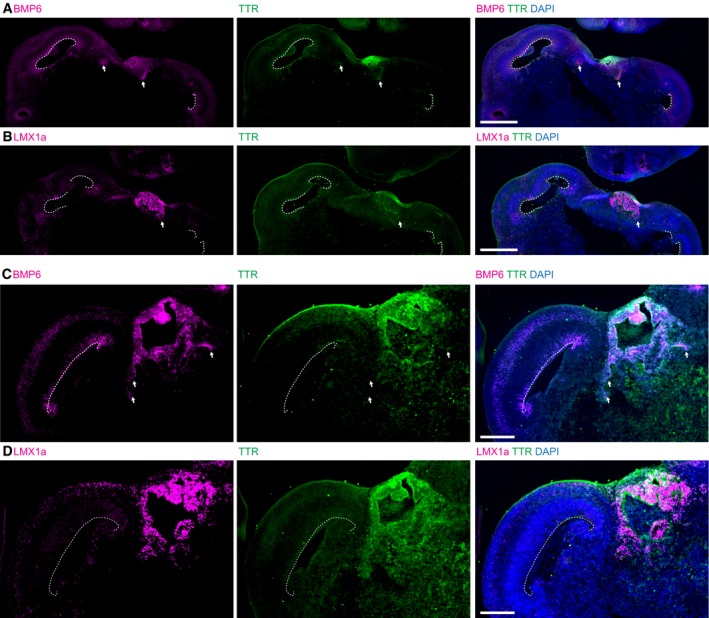
DTissues containing LMX1a staining (red, arrows) can be found in between choroid plexus (TTR, green) and dorsal forebrain (PAX6 positive, blue). The presence of TBR2 was verified on an adjacent section. LMX1a also stains the choroid plexus.
-
EQuantification of the percentage of organoids within individual experiments containing hem‐like tissue as described in (D). Only experiments containing large dorsal forebrain regions in > 50% of organoids were analyzed.
-
FFifty‐three organoids analyzed in (E) were analyzed also for the presence of PSPB‐like tissue on adjacent sections.
-
G–ITBR2 staining (magenta) for dorsal forebrain and TTR staining (green) for choroid plexus on serial sections across 200 μm and in situ hybridization for Wnt2b which is specifically expressed in the cortical hem (arrows). Note the presence of dorsal cortical tissue (G, I) flanking the Wnt2b hem with choroid plexus in between. Z‐positions are indicated.
-
JBMP6 (magenta) is expressed in the hem and choroid plexus (arrows). A serial section to (G–I) is shown.
To identify hem in cerebral organoids, we performed immunohistological experiments using markers for specific brain regions. To exclude artifacts from mispatterned organoids, we included only those experiments in which more than 50% of all organoids contained dorsal forebrain tissue larger than 400 μm in diameter. Sections adjacent to those large dorsal forebrain regions were stained for PAX6, LMX1a (Chizhikov et al, 2010), and the choroid plexus marker TTR. Indeed, in nine experiments analyzed (53 organoids in total, Table EV1), we detected LMX1a‐positive cell populations between the choroid plexus and the dorsal forebrain in several organoids, recapitulating the organization of the cortical hem (Fig 3D and E). This might be an underestimate as organoids do not display an externally visible axis and therefore some hem structures could be missed in the random 2D sections through complex 3D tissues. When we analyzed the presence of a PSPB in the experiments that were analyzed for cortical hem, we found that 11 out of 53 organoids contained both hem and PSPB tissues. Twenty‐one contained only hem and nine contained only PSPB, while the remaining 12 organoids contained neither hem nor PSPB (Fig 3F). These results suggest that organoids are capable of generating structures reminiscent of forebrain organizing centers.
The cortical hem has an important signaling function within the dorsal forebrain. The signaling factor Wnt2b is expressed in a narrow stripe, while other signaling molecules such as Wnt3a, Bmp6, and Bmp7 are more dispersed (Grove et al, 1998; Abu‐Khalil et al, 2004). Indeed, using in situ hybridization on serial sections, we found that Wnt2b was expressed in organoids between the choroid plexus and the dorsal forebrain (Fig 3G–I, arrows). For quantification, we used anti‐BMP6 staining to be compatible with immunohistological identification of regional markers. We analyzed BMP6 expression in experiments in which we could find dorsal forebrain tissue larger than 400 μm in diameter in more than 50% of organoids. BMP6 is expressed in the cortical hem and also choroid plexus. We analyzed 29 organoids from five independent experiments and found BMP6‐positive hem tissue located next to dorsal forebrain tissue in 79% of them. All of these regions were also positive for LMX1a in serial sections (Fig EV2).
Figure EV2. BMP6 and LMX1a stainings overlap in hem and choroid plexus (related to Fig 3).
-
A–DTwo examples of forebrain tissue (A, C) stained for BMP6 (magenta) and TTR (green) reveal staining in a cell population, “hem”, in between TTR‐positive choroid plexus and the radially organized dorsal forebrain tissue (arrows). The dashed lines mark the ventricular surface. LMX1A staining (magenta) (B, D) in serial sections to (A) and (C), respectively, reveals LMX1a staining in the same regions. Because both antibodies were raised in rabbit, costaining of the two markers was not possible.
Thus, cerebral organoids contain the organizing centers that are involved in patterning the mammalian brain in vivo. Our analysis shows that they can produce signaling molecules normally present in those organizers. These morphogens might influence regional identity both in the immediate vicinity, but also over long distances through the interconnected ventricular network, although genetic loss‐of‐function analysis will be required to demonstrate that cortical patterning in organoids is indeed influenced by the presence of PSPB or hem tissue.
Timed generation of excitatory neuronal subtypes
Having observed the presence of spatial patterning, we next sought to test whether brain organoids displayed evidence of temporal patterning. The developing dorsal cortex in vivo displays remarkable timing in the generation of the various neuron types that make up the six layers of the cortex (Rakic, 1974; Hevner et al, 2003; Molyneaux et al, 2007; Gaspard et al, 2008). Specifically, Cajal–Retzius cells are generated first in regions adjacent to the cortex, followed by the sequential generation of deep‐layer neurons and then superficial layer neurons. Therefore, we examined whether cerebral organoids displayed a similar timed generation of these excitatory neuron types. We performed staining for the marker of Cajal–Retzius cells, Reelin, which displayed an abundance of staining in early organoids (day 42) soon after the initiation of neurogenesis followed by a gradual decrease in abundance over time (Fig 4A). Staining for the deep‐layer marker CTIP2 and the superficial layer marker SATB2 at various time points revealed abundant CTIP2 cells at day 48, whereas SATB2 neurons were largely absent at this time point, instead appearing around day 66 and increasing until day 102 (Fig 4B). We further tested for the presence of cells with a glial identity, which are believed to be generated lastly from the terminal divisions of neural stem cells (Sauvageot, 2002). GFAP staining revealed cells with strong positivity and astrocytic morphology beginning at approximately 100 days (Fig 4C). Thus, the relative emergence of cell types matches that observed in vivo where Reelin‐positive cells are generated first, followed by deep‐layer CTIP2‐positive cells, then SATB2‐positive superficial layer neurons, and finally cells with glial identities.
Figure 4. Temporal patterning of dorsal forebrain is recapitulated in cerebral organoids.
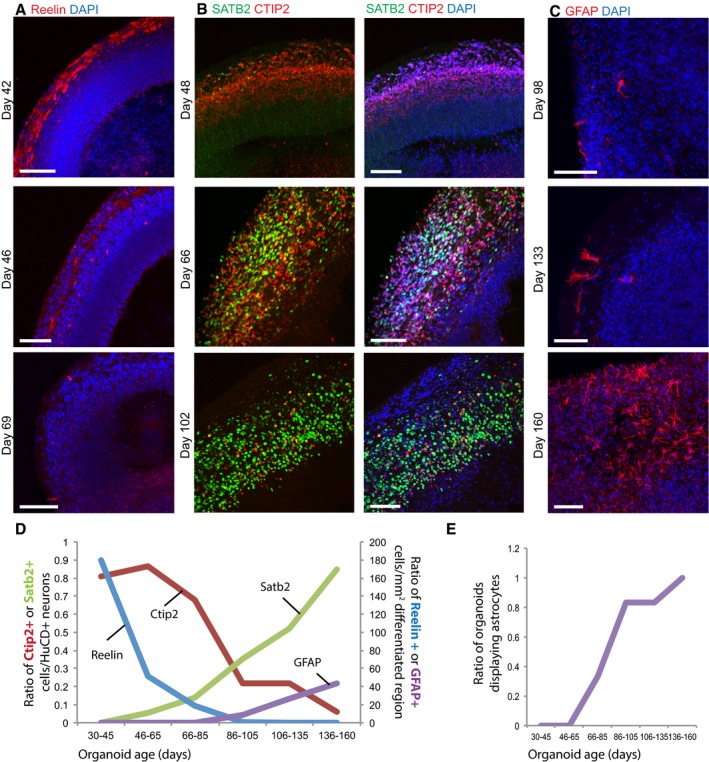
- Staining for early‐born Cajal–Retzius cells with the marker Reelin (red) shows strong staining at day 42 with decreasing staining at day 46 and day 69.
- Staining for markers of deep‐layer early‐born neurons (CTIP2, red) and upper layer late‐born neurons (SATB2, green) reveals progressive switching from CTIP2+ neuron production to SATB2+ neuron production.
- Staining for GFAP (red) reveals cells with typical astrocyte morphology at day 98 and increasing in abundance over time.
- Quantification of neuron and glial identities over time. CTIP2 and SATB2 were counted as a ratio of HuC/D+ neurons (left y‐axis). Because both Reelin and GFAP are not nuclear markers, these were instead quantified as cell counts per mm2 of differentiated region (intermediate zone/cortical plate, excluding germinal zones) as defined by DCX staining (right y‐axis). Measurements were binned into six time windows spanning day 30 to day 160. 15 independent experiments were quantified with at least four organoids from at least two experiments per time window.
- Quantification of the number of organoids displaying at least some GFAP+ astrocytes. Samples were the same as for panel (D).
To further characterize this putative temporal patterning, we quantified the relative abundance of Reelin+, CTIP2+, or SATB2+ neurons, and of GFAP+ cells with astrocytic morphology. We quantified organoids from 15 separate experiments ranging from 33 to 160 days in culture, with at least four organoids per time point (quantification summarized in Table EV2). This revealed the highest abundance of Reelin cells during the earliest time points, followed by a peak of CTIP+ cells, then SATB2+ neurons, and finally GFAP+ astrocytes (Fig 4D). Finally, we examined the robustness of astrocyte generation by quantifying the number of astrocyte‐containing organoids at each time point. We found that this fraction increased with time until finally by approximately 140 days all of the organoids analyzed displayed at least some astrocytes (Fig 4E).
Neurons and glia adopt mature morphological features
We next examined the morphology of excitatory neurons to establish whether they displayed typical morphological characteristics of dorsal cortical excitatory neurons, which are also termed pyramidal cells due to their triangular cell shape and their primary dendrite (Elston, 2003). We performed staining for the markers SATB2 and CTIP2 in combination with the dendritic marker MAP2. Numerous neurons of the dorsal cortical region displayed thickened dendrites extending radially outward, much like the primary dendrite typical of pyramidal cells (Fig 5A). Numerous outer branching dendrites could also be seen, reminiscent of so‐called apical tufts. Imaris tracing of dendrites on a region with sparse staining identified individual dendritic trees, showing the presence of a primary dendrite and distal branching (Fig 5B). Furthermore, sparse labeling by electroporation with a membrane targeting GFP construct revealed neurons with thick primary dendrite and extensive distal branching (Fig 5C). These data suggest excitatory neurons in cerebral organoids are able to mature and take on the typical morphology seen in vivo.
Figure 5. Maturation of neuronal morphology and glial identities in cerebral organoids.
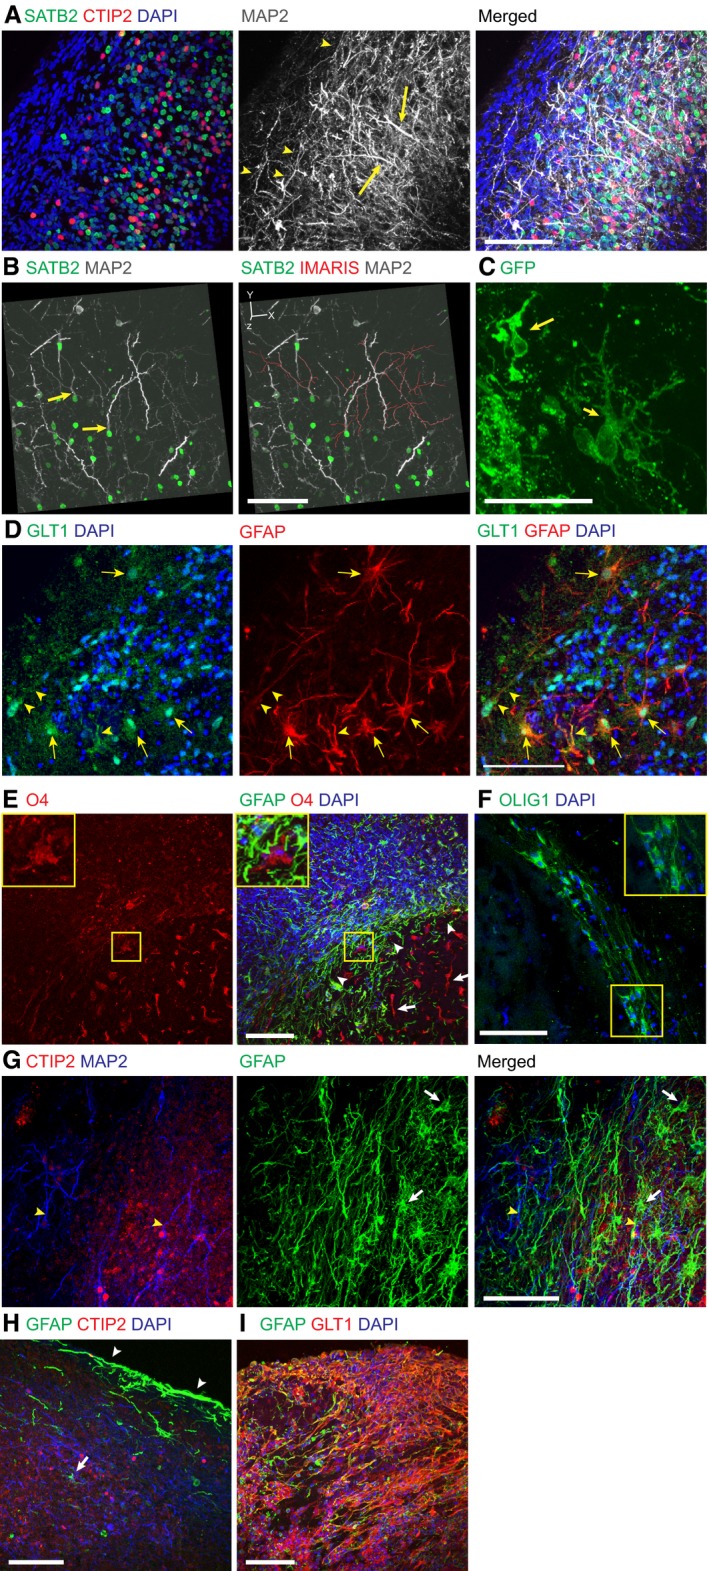
- Staining for neuronal morphology with the dendrite marker MAP2 (grey) and cortical neuronal markers CTIP2 (red) and SATB2 (green), revealing large radially oriented dendrites (arrows) with perpendicular branching along the basal surface (arrowheads).
- 3D reconstruction based on Z‐stacks (axes shown in upper left) and IMARIS tracing (red) of dendrite trees of individual SATB2+ neurons, revealing a primary dendrite (arrows) with multiple branches, typical of pyramidal neuron morphology.
- Neurons marked by an electroporated construct encoding farnesylated GFP targeted to the membrane in order to visualize cell morphology reveal cells with a major dendrite (arrows) proximal to the cell body and more distal branching, consistent with pyramidal cell morphology.
- Staining at day 142 for astrocytes using the broad marker GFAP (red) and the astrocyte marker GLT1 (green). Note the numerous cells with typical astrocyte morphology and exhibiting nuclear/diffuse cytosolic GLT1 staining (arrows) as well as some staining in processes (arrowheads).
- Staining for the oligodendrocyte marker O4 (red) reveals numerous O4+ cells on the interior of the organoid (arrows) in a cell sparse zone, whereas numerous nuclei (DAPI, blue) and astrocytes are located more externally (arrowheads). Inset shows higher magnification of an O4+ cell.
- Staining for the marker OLIG1 additionally marks oligodendrocytes located in a stream in the interior of the organoid. Inset shows a higher magnification of several OLIG1+ cells.
- Costaining for neuronal markers CTIP2 (red) and the dendrite marker MAP2 (blue) as well as GFAP (green) reveals astrocytes (arrows) and astrocytic processes in close proximity to neuronal dendrites (blue, arrowheads).
- Highly GFAP+ (green) thick processes (arrowheads) can cover the surface of the organoids, whereas astrocytes with typical morphology can be seen more internally (arrow).
- Costaining for GFAP (green) and GLT1 (red) in a much older organoid (229 days) reveals extensive overgrowth of glia at this late time point.
We further characterized the cells of glial identities by staining for the broad glial marker GFAP as well as the glutamate transporter GLT1 which is expressed in astrocytes. Astrocytes were positive for both markers and displayed typical morphology consisting of numerous elongated processes (Fig 5D). Furthermore, O4 staining revealed the presence of oligodendrocytes, which primarily resided in the central regions of the organoid, where cells were sparse (Fig 5E). In addition, cells with OLIG1 staining could be identified consistent with oligodendrocyte identity (Fig 5F). Costaining for CTIP2 and MAP2 revealed a close association of GFAP‐positive astrocytes and differentiated cortical neurons (Fig 5G). Interestingly, in addition to astrocytes and oligodendrocytes with typical morphology, we also observed highly positive GFAP cells lining the outer surface of the brain organoids (Fig 5H). Finally, very old organoids (day 229) were almost entirely populated by glia showing staining for both GFAP and GLT1 (Fig 5I). Thus, our data indicate that cerebral organoids can model the emergence and morphological differentiation of glial cells.
Discussion
Our findings demonstrate the remarkable ability of cerebral organoids to self‐organize through endogenous patterning events that mimic the developing brain in vivo. Using detailed marker analysis, we have shown that cerebral organoids can form distinct forebrain structures, and we describe the variability and efficiency of generation of these regions. Furthermore, we identified tissues reminiscent of the cortical hem and PSPB, which in vivo have vital functions in forebrain patterning. In support of this finding, a recent single‐cell transcriptome study also identified cells expressing hem‐specific genes in cerebral organoids (Camp et al, 2015). Although these tissues resembling organizing centers are formed in cerebral organoids, it remains to be determined whether they play a direct functional role in organoid patterning. Unlike the hem, the antihem has not been proven to be an organizing center in vivo; however, its absence leads to a severe disruption of the radial glia progenitor palisade at the PSPB, raising a strong parallel with the function of the hem in organizing the hippocampal radial glia progenitor cells (Subramanian et al, 2009).
Interestingly, our study revealed substantial variability among organoid experiments in the efficiency of generating dorsal or ventral forebrain tissue as well as other tissues whose identity we have not discerned. One hypothesis is that this variability arises depending on which organizing centers are formed. However, resolving the relationship between the presence of organizing centers and regional identity is highly challenging, since by definition, dorsal forebrain is found next to all identified hem tissues and dorsal forebrain and ventral forebrain are always curtailing the PSPB. Furthermore, organizing centers may be active only at certain developmental stages of individual organoids and might not be visible during the entire organoid life span, making it difficult to unambiguously discern which patterning cues are/have been present. Nonetheless, the fact that we observe formation of various different, organized tissue identities within the same organoid without providing external signaling molecules suggests that intrinsic signaling processes and patterning are at work during organoid development. Future functional studies and manipulations will be required to test whether these regions consistent with organizing centers are indeed involved in intrinsic patterning of cerebral organoids.
Making organoids transparent by the recently described SWITCH method (Murray et al, 2015) and imaging of the entire structure allowed us to overcome some of the limitations of analysis of 3D organoids by 2D sections. Our results revealed a significant degree of tissue interconnectivity, even though the abundance of internal connections of the ventricular system varied across different organoids. The internal connection of organoids via a ventricular system has important implications for how we perceive tissue interactions in 3D. Signaling molecules could travel throughout the organoid, and tissues that are seemingly separated by long distances based on histological sections could actually be physically connected and influence each other.
These results underline the remarkable capacity of pluripotent stem cell‐derived brain tissues to form various forebrain structures solely by self‐organization. This shows that even the highly complex development of the telencephalon can be carried out to a surprisingly large extent without external signaling cues. Other published protocols for 3D brain tissue rely on the addition of signaling molecules to drive induction of defined tissue identities (Eiraku et al, 2008; Chambers et al, 2009; Kadoshima et al, 2013; Mariani et al, 2015; Paşca et al, 2015; Qian et al, 2016). This leads to the formation of homogeneous tissue that lacks crucial interactions of different brain regions such as the spatial integration of GABAergic interneurons with excitatory dorsal forebrain neurons. Furthermore, this may explain the capacity for whole brain organoids to form larger, more continuous cortical tissues, due to the interconnectivity with other forebrain regions such as cortical hem, which is important for cortical expansion in vivo (Caronia‐Brown et al, 2014) or CP, which in vivo generates ventricular cerebral spinal fluid.
Our findings reveal that not only are cerebral organoids capable of intrinsic spatial patterning, but they also display acquisition of cell identity in a timed manner that closely mimics the temporal patterning seen in vivo with sequential waves of neurons expressing Reelin, CTIP2, and SATB2. While the timing seen in organoids is overall somewhat slower than that described for 2D cultures (Gaspard et al, 2008), it is closer to that seen in vivo for the developing human brain (http://developinghumanbrain.org). Importantly, while some subtle separation of deep and superficial neurons can be seen in organoids, overall they do not display the separation into discrete layers as would be seen in vivo. This may be due to a lack of later spatial organization into the cortical plate, a prerequisite of cortical layer formation. Finally, the timed formation of glia further demonstrates the potential utility of organoids as a route to study these supportive non‐neural types and may even indicate a potential for myelination.
Although these findings identify a remarkable ability for formation of organizing centers, due to the spontaneous nature of identity acquisition, there is quite significant variability from organoid to organoid and between experiments. We also observed the formation of regions of non‐forebrain identity. While we did not analyze those regions by marker staining, transcriptome profiling of individual cerebral organoids has revealed transcriptional signatures of other brain regions such as hindbrain and spinal cord, and even other embryonic tissues such as digestive tract and skeletal system development (Lancaster et al, 2016). This underlines the importance of careful marker stainings to recognize different tissue identities within 3D brain organoids. This is especially important for studies in which organoids with different genetic backgrounds are analyzed. We propose the use of FOXG1 staining as evidence for forebrain identity and within those tissues TBR2 staining in the SVZ as a marker for dorsal forebrain. The dependence on molecular markers published for in vivo studies where identity can be inferred from morphological landmarks is of course a limitation for further classification of regional identities within organoids. Currently, this can be overcome with combinatorial stainings to identify the region of interest. Further large‐scale sequencing efforts such as Kerwin et al (2010) and Fagerberg et al (2014) will contribute to the identification of new region‐specific molecular markers in the human developing brain that can be used in the organoid field.
Materials and Methods
Human embryonic stem cell culture
Human embryonic stem cells H9 [Wisconsin International Stem Cell (WISC) Bank, WiCell Research Institute, WA09 cells] were cultured according to WiCell protocols (http://www.wicell.org/home/support/stem-cell-protocols/stem-cell-protocols.cmsx) on MEF feeders (CF‐1 MEF, irradiated, GlobalStem) in hESC medium with bFGF or on Matrigel (Corning, hESC‐Qualified) in mTeSR1 (Stemcell Technologies).
Generation and analysis of cerebral organoids
Cerebral organoids were generated and processed for analysis as described in great detail in Lancaster and Knoblich (2014).
Organoids were fixed in 4% PFA for 45–60 min at room temperature, washed in PBS, and cryoprotected in 30% sucrose in PBS overnight at 4°C. Three to five organoids were embedded together in blocks of 7.5% gelatine and 10% sucrose in PB and frozen in −30 to −50°C isopentane. Organoids were cut to 20‐μm cryosections, and every tenth section was collected onto a slide to obtain 10 slides containing serial sections representing the whole organoid. Slides were dried and stored at −80°C (long‐term storage) or −20°C (short‐term storage).
Immunofluorescence stainings
Slides were thawed, dried, and rehydrated in PBS. Slides were incubated for 1 h in 150 μl blocking/permeabilization solution (0.25% Triton X, 4% normal donkey serum in PBS) under parafilm. The sections were incubated overnight at room temperature with 100 μl primary antibodies in blocking solution (0.1% Triton X, 4% normal donkey serum in PBS) under parafilm, washed 3 × 15 min in PBS + 0.05% Triton X, and incubated for 2 h with 1:500 secondary antibodies (Life Technologies) in blocking solution. Nuclei were counterstained with 1 μg/ml DAPI in PBS for 15 min, and the slides were washed in the dark 2 × 15 min in PBS + 0.05% Triton X and 1 × 15 min PBS and mounted with Dako fluorescence mounting medium. See Table 1 for information on antibodies and dilutions.
Table 1.
Antibodies used in the study
| Antigen | Raised in | Company | Cat. No. | Dilution |
|---|---|---|---|---|
| BMP6 | Rabbit | Novus Biologicals | NBP1‐19733 | 1:100 |
| CTIP2 | Rat | Abcam | ab18465 | 1:100 |
| DLX2 | Goat | Santa Cruz | sc‐18140 | 1:100 |
| FOXG1 | Rabbit | Abcam | ab 18259 | 1:200 |
| FZD9 | Rabbit | Acris | SP4153P | 1:200 |
| GFAP | Rabbit | Abcam | ab7260 | 1:750 |
| GLT1 | Guinea pig | Millipore | AB1783 | 1:500 |
| GSX2 | Rabbit | Millipore | abn162 | 1:500 |
| LMX1A | Rabbit | Life Technologies | PA5‐34470 | 1:50 |
| MAP2 | Mouse | Millipore | MAB3418 | 1:500 |
| NKX2.1/TTF‐1 | Mouse | Dako | 3,575 | 1:50 |
| NRP2 | Goat | R&D | AF2215 | 1:40 |
| O4 | Mouse | R&D | MAB1326 | 1:500 |
| Olig1 | Mouse | Millipore | MAB5540 | 1:200 |
| PAX6 | Mouse | DSHB | Pax6‐s | 1:200 |
| PROX1 | Mouse | Millipore | MAB5654 | 1:200 |
| Reelin | Mouse | Millipore | MAB5366 | 1:250 |
| SATB2 | Rabbit | Abcam | ab34735 | 1:100 |
| TBR2 (EOMES) | Chicken | Millipore | AB15894 | 1:100 |
| TBR2 (EOMES) | Rabbit | Abcam | ab23344 | 1:300 |
| TTR | Sheep | Abd Serotec | ahp1837 | 1:100 |
| VGAT | Rabbit | Synaptic systems | 131,013 | 1:2,000 |
Slides were imaged with the Panoramic SCAN slide scanner (3DHISTECH Ltd.) to obtain a representation of the entire organoids in 200‐μm intervals. For analysis of more than three markers within the same tissue, or in case of antibody incompatibility, adjacent sections on a neighboring slide were stained and analyzed. Complete scanning of all samples by the Panoramic SCAN Slide scanner allowed for comprehensive analysis of many tissues, stained with a large variety of different antibodies.
Dorsal forebrain tissue as well as ventral forebrain, PSPB, hem, and choroid plexus (with a diameter > 400 μm) was detected in organoids at all stages analyzed (30–70 days old). Over time, we observed an apparent increase in organoids positive for these regions. Most likely, however, this apparent increase is due to the loss and/or reduced growth of malformed or mispatterned organoids over time rather than being a true increase in those tissues. To make up for this bias, organoids from several stages were combined for this experiment.
Tissue clearing and imaging in 3D
Organoids were fixed in PFA and processed essentially as described in Murray et al (2015).
Sparse labeling by GFP electroporation
Cerebral organoids were electroporated as previously described (Lancaster et al, 2013) with an integrating construct encoding EGFP containing a farnesylation sequence to enable membrane targeting (pT2‐CAG‐fGFP). The CAG promoter was isolated from pCAG‐GFP (a gift from Connie Cepko, Addgene plasmid #11150) and inserted into the pT2/HB transposon donor plasmid (a gift from Perry Hackett, Addgene plasmid #26557), which was also modified to allow the insertion of sequences using Gateway cloning. A farnesylation sequence was inserted directly after the GFP of the pENTREGFP2 plasmid (a gift from Nathan Lawson, Addgene plasmid #22450), and this was then cloned into the above pT2‐CAG‐pDest using Gateway cloning (Thermo Fisher). CAG‐driven sleeping beauty transposase plasmid was generated by cloning SB100X (pCMV(CAT)T7‐SB100 was a gift from Zsuzsanna Izsvak, Addgene plasmid #34879) into the pCAGEN plasmid (a gift from Connie Cepko, Addgene plasmid #11160). Electroporation was performed by injecting 80 ng/μl pT2‐Cag‐fGFP and 240 ng/μl pCAGEN‐SB100X. Organoids were fixed 2 weeks later and analyzed as described below for immunohistochemical analysis.
In situ hybridizations
Probe preparation
Wnt2b was amplified by PCR from human fetal brain cDNA (Invitrogen). The PCR reaction was diluted 1:500, and nested PCR was performed in two separate reactions with the forward or reverse primer containing the T7 site, respectively (Table 2). The PCR products were gel‐purified by the Qiagen Gel Extraction Kit, and > 300 ng was used for reverse transcription with T7 polymerase, DIG‐dNTPs, and RNase inhibitor for 4 h at 37°C. The samples were then incubated for 10 min at 37°C with 1 μl DNase I (RNase free), and RNA was precipitated with EtOH and NaOAc3 at −20°C for 2 h, pelleted for 20 min at 4°C, washed with 70% EtOH, dried, and resuspended in 50 μl nuclease‐free H2O. Five microliter was used to check the probe, and the rest was mixed 1:1 with 100% deionized formamide and stored at −20°C until use.
Table 2.
Primer sequences to generate Wnt2b probe
| Pcr1 from cDNA | For | GACCGGGACCACACCGTCTTTGG |
| Pcr1 from cDNA | Rev | GGTGGAGGGTGGAGGAAGGTG |
| Nested PCR | For‐T7 | aaaataatacgactcactatagggagaCATGCTCAGAAGTAGCCGAGA |
| Nested PCR | Rev | ATGCAAGGATCTTGTGCTTTT |
| Nested PCR | For | CATGCTCAGAAGTAGCCGAGA |
| Nested PCR | Rev‐T7 | aaaataatacgactcactatagggagaATGCAAGGATCTTGTGCTTTT |
Sample preparation and hybridization procedure
Organoids were fixed for 4 h at 4°C in 4% PFA and cryoprotected by sinking in 30% sucrose in PBS overnight at 4°C. They were embedded in OCT compound, frozen, and stored at −80°C. Organoids were sectioned to 20‐μm cryosections. All solutions up to probe hybridization were RNase free. Slides were post‐fixed for 15 min in 4% PFA at RT, washed in PBS, bleached for 15 min in 3% H2O2‐PBS at RT, washed with PBS, and treated for 5 min at RT with 40 μg/ml proteinase K. The slides were directly fixed with 4% PFA for 15 min, washed in PBS, and incubated for 10 min in fresh acetylation solution (250 ml H2O, 2.235 ml triethanolamine, 0.437 ml HCl, 0.938 ml acetic anhydride). Slides were pre‐hybridized with hybridization buffer (25 ml 20× SSC, 250 ml deionized formamide, 5 ml salmon sperm DNA, 10 ml 50× Denhart's solution, 205 ml H2O, 5 ml 0.5 M EDTA) at 65°C for 3 h in a slide mailer and incubated overnight with in situ probe 1:400 (denatured for 10 min at 70°C and quickly cooled on ice) in hybridization buffer at 65°C. Slides were washed 1 × 15 and 2 × 30 min in fresh wash solution (1× SSC, 50% formamide, 0.1% Tween‐20), 2 × 30 min in 1× MABT (5× MABT: 58 g maleic acid, 43.8 g NaCl, ca. 38 g NaOH to pH 7.5, 50 ml 10% Tween‐20, to 1 l with H2O), blocked 2–3 h with 150 μl blocking solution (1× MABT, 2 ml 10% blocking solution–blocking reagent Roche, 2 ml inactivated sheep serum, H2O to 10 ml) under parafilm, and incubated with DIG AP FAB fragments 1:1,500 overnight at 4°C. The slides were washed 5 × 20 min in 1× MABT, 2 × 10 min in fresh staining solution (4 ml 5 M NaCl, 1 ml 1 M MgCl2, 20 ml 1 M Tris pH 9.5, H2O to 200 ml), and incubated with AP substrate (Roche) in the dark until signal appeared. Slides were washed in PBS, fixed 10 min in 4% PFA, washed, and mounted.
Author contributions
MR, MAL, and JAK conceived the project. MR, MAL, SB, and AP performed the experiments. TK and HC performed organoid clearing and imaging under the supervision of KC. MR, MAL, SB, and JAK wrote the manuscript. JAK directed and supervised the project.
Conflict of interest
M.A.L. and J.A.K. are inventors on a patent application (WO2014/090993) describing the cerebral organoid method. K.C. is a cofounder of LifeCanvas Technologies, a start‐up that aims to help the research community adopt technologies developed by the Chung Laboratory.
Supporting information
Expanded View Figures PDF
Table EV1
Table EV2
Movie EV1
Movie EV2
Review Process File
Acknowledgements
We thank all members of the Knoblich, Lancaster, and Chung laboratories for discussions and support. We thank Raika Sieger for technical support. We are grateful to all IMP/IMBA and VBCF service facilities for providing technical support. We are particularly indebted to G. Petri and P. Pasierbek for imaging support and T. Lendl for help with 3D reconstructions. We thank Alex Phillips for generation of the membrane‐targeted GFP construct. M.A.L. was funded by a Marie Curie Postdoctoral Fellowship. Work in M.A.L.'s laboratory is supported by the Medical Research Council MC_UP_1201/9. Work in J.A.K.'s laboratory is supported by the Austrian Academy of Sciences, the Austrian Science Fund (grants I_1281‐B19 and Z_153_B09), and an advanced grant from the European Research Council (ERC). K.C. is supported by Burroughs Wellcome Fund Career Awards at the Scientific Interface, the Searle Scholars Program, Packard award in Science and Engineering, NARSAD Young Investigator Award, JPB Foundation (PIIF and PNDRF), NCSOFT Cultural Foundation, and NIH (1‐U01‐NS090473‐01). Resources that may help enable general users to establish the SWITCH methodology are freely available online (http://www.chunglabresources.com).
The EMBO Journal (2017) 36: 1316–1329
See also: C Dias & F Guillemot (May 2017)
References
- Abu‐Khalil A, Fu L, Grove EA, Zecevic N, Geschwind DH (2004) Wnt genes define distinct boundaries in the developing human brain: implications for human forebrain patterning. J Comp Neurol 474: 276–288 [DOI] [PubMed] [Google Scholar]
- Borello U, Pierani A (2010) Patterning the cerebral cortex: traveling with morphogens. Curr Opin Genet Dev 20: 408–415 [DOI] [PubMed] [Google Scholar]
- Camp JG, Badsha F, Florio M, Kanton S, Gerber T, Wilsch‐Bräuninger M, Lewitus E, Sykes A, Hevers W, Lancaster M, Knoblich JA, Lachmann R, Pääbo S, Huttner WB, Treutlein B (2015) Human cerebral organoids recapitulate gene expression programs of fetal neocortex development. Proc Natl Acad Sci USA 112: 15672–15677 [DOI] [PMC free article] [PubMed] [Google Scholar]
- Caronia‐Brown G, Yoshida M, Gulden F, Assimacopoulos S, Grove EA (2014) The cortical hem regulates the size and patterning of neocortex. Development 141: 2855–2865 [DOI] [PMC free article] [PubMed] [Google Scholar]
- Chambers SM, Fasano CA, Papapetrou EP, Tomishima M, Sadelain M, Studer L (2009) Highly efficient neural conversion of human ES and iPS cells by dual inhibition of SMAD signaling. Nat Biotechnol 27: 275–280 [DOI] [PMC free article] [PubMed] [Google Scholar]
- Chizhikov VV, Lindgren AG, Mishima Y, Roberts RW, Aldinger KA, Miesegaes GR, Currle DS, Monuki ES, Millen KJ (2010) Lmx1a regulates fates and location of cells originating from the cerebellar rhombic lip and telencephalic cortical hem. Proc Natl Acad Sci USA 107: 10725–10730 [DOI] [PMC free article] [PubMed] [Google Scholar]
- Eiraku M, Watanabe K, Matsuo‐Takasaki M, Kawada M, Yonemura S, Matsumura M, Wataya T, Nishiyama A, Muguruma K, Sasai Y (2008) Self‐organized formation of polarized cortical tissues from ESCs and its active manipulation by extrinsic signals. Cell Stem Cell 3: 519–532 [DOI] [PubMed] [Google Scholar]
- Elston GN (2003) Cortex, cognition and the cell: new insights into the pyramidal neuron and prefrontal function. Cereb Cortex 13: 1124–1138 [DOI] [PubMed] [Google Scholar]
- Englund C (2005) Pax6, Tbr2, and Tbr1 are expressed sequentially by radial glia, intermediate progenitor cells, and postmitotic neurons in developing neocortex. J Neurosci 25: 247–251 [DOI] [PMC free article] [PubMed] [Google Scholar]
- Fagerberg L, Hallstrom BM, Oksvold P, Kampf C, Djureinovic D, Odeberg J, Habuka M, Tahmasebpoor S, Danielsson A, Edlund K, Asplund A, Sjostedt E, Lundberg E, Szigyarto CAK, Skogs M, Takanen JO, Berling H, Tegel H, Mulder J, Nilsson P et al (2014) Analysis of the human tissue‐specific expression by genome‐wide integration of transcriptomics and antibody‐based proteomics. Mol Cell Proteomics 13: 397–406 [DOI] [PMC free article] [PubMed] [Google Scholar]
- Gaspard N, Bouschet T, Hourez R, Dimidschstein J, Naeije G, van den Ameele J, Espuny‐Camacho I, Herpoel A, Passante L, Schiffmann SN, Gaillard A, Vanderhaeghen P (2008) An intrinsic mechanism of corticogenesis from embryonic stem cells. Nature 455: 351–357 [DOI] [PubMed] [Google Scholar]
- Geffers L, Herrmann B, Eichele G (2012) Web‐based digital gene expression atlases for the mouse. Mamm Genome 23: 525–538 [DOI] [PubMed] [Google Scholar]
- Georgala PA, Carr CB, Price DJ (2011) The role of Pax6 in forebrain development. Dev Neurobiol 71: 690–709 [DOI] [PubMed] [Google Scholar]
- Geschwind DH, Rakic P (2013) Perspective. Neuron 80: 633–647 [DOI] [PMC free article] [PubMed] [Google Scholar]
- Grove EA, Tole S, Limon J, Yip L, Ragsdale CW (1998) The hem of the embryonic cerebral cortex is defined by the expression of multiple Wnt genes and is compromised in Gli3‐deficient mice. Development 125: 2315–2325 [DOI] [PubMed] [Google Scholar]
- Grove EA, Monuki ES (2013) Chapter 2 ‐ Morphogens, patterning centers, and their mechanisms of action In Patterning and cell type specification in the developing CNS and PNS, Rubenstein JLR, Rakic P. (eds), pp 25–44. Oxford: Academic Press; [Google Scholar]
- Hansen DV, Lui JH, Flandin P, Yoshikawa K, Rubenstein JL, Alvarez‐Buylla A, Kriegstein AR (2013) Non‐epithelial stem cells and cortical interneuron production in the human ganglionic eminences. Nat Neurosci 16: 1576–1587 [DOI] [PMC free article] [PubMed] [Google Scholar]
- Hevner RF, Daza RAM, Rubenstein JLR, Stunnenberg H, Olavarria JF, Englund C (2003) Beyond laminar fate: toward a molecular classification of cortical projection/pyramidal neurons. Dev Neurosci 25: 139–151 [DOI] [PubMed] [Google Scholar]
- Kadoshima T, Sakaguchi H, Nakano T, Soen M, Ando S, Eiraku M, Sasai Y (2013) Self‐organization of axial polarity, inside‐out layer pattern, and species‐specific progenitor dynamics in human ES cell‐derived neocortex. Proc Natl Acad Sci USA 110: 20284–20289 [DOI] [PMC free article] [PubMed] [Google Scholar]
- Kerwin J, Yang Y, Merchan P, Sarma S, Thompson J, Wang X, Sandoval J, Puelles L, Baldock R, Lindsay S (2010) The HUDSEN Atlas: a three‐dimensional (3D) spatial framework for studying gene expression in the developing human brain. J Anat 217: 289–299 [DOI] [PMC free article] [PubMed] [Google Scholar]
- Lancaster MA, Renner M, Martin C‐A, Wenzel D, Bicknell LS, Hurles ME, Homfray T, Penninger JM, Jackson AP, Knoblich JA (2013) Cerebral organoids model human brain development and microcephaly. Nature 501: 373–379 [DOI] [PMC free article] [PubMed] [Google Scholar]
- Lancaster MA, Knoblich JA (2014) Generation of cerebral organoids from human pluripotent stem cells. Nat Protoc 9: 2329–2340 [DOI] [PMC free article] [PubMed] [Google Scholar]
- Lancaster MA, Corsini NS, Burkard TR, Knoblich JA (2016) Guided self‐organization recapitulates tissue architecture in a bioengineered brain organoid model. bioRxiv doi:10.1101/049346 [Google Scholar]
- Lui JH, Hansen DV, Kriegstein AR (2011) Development and evolution of the human neocortex. Cell 146: 18–36 [DOI] [PMC free article] [PubMed] [Google Scholar]
- Ma T, Wang C, Wang L, Zhou X, Tian M, Zhang Q, Zhang Y, Li J, Liu Z, Cai Y, Liu F, You Y, Chen C, Campbell K, Song H, Ma L, Rubenstein JL, Yang Z (2013) Subcortical origins of human and monkey neocortical interneurons. Nat Neurosci 16: 1588–1597 [DOI] [PubMed] [Google Scholar]
- Mariani J, Simonini MV, Palejev D, Tomasini L, Coppola G, Szekely AM, Horvath TL, Vaccarino FM (2012) Modeling human cortical development in vitro using induced pluripotent stem cells. Proc Natl Acad Sci USA 109: 12770–12775 [DOI] [PMC free article] [PubMed] [Google Scholar]
- Mariani J, Coppola G, Zhang P, Abyzov A, Provini L, Tomasini L, Amenduni M, Szekely A, Palejev D, Wilson M, Gerstein M, Grigorenko EL, Chawarska K, Pelphrey KA, Howe JR, Vaccarino FM (2015) FOXG1‐dependent dysregulation of GABA/glutamate neuron differentiation in autism spectrum disorders. Cell 162: 375–390 [DOI] [PMC free article] [PubMed] [Google Scholar]
- Medina L, Abellán A (2009) Development and evolution of the pallium. Semin Cell Dev Biol 20: 698–711 [DOI] [PubMed] [Google Scholar]
- Miller JA, Ding S‐L, Sunkin SM, Smith KA, Ng L, Szafer A, Ebbert A, Riley ZL, Royall JJ, Aiona K, Arnold JM, Bennet C, Bertagnolli D, Brouner K, Butler S, Caldejon S, Carey A, Cuhaciyan C, Dalley RA, Dee N et al (2014) Transcriptional landscape of the prenatal human brain. Nature 508: 199–206 [DOI] [PMC free article] [PubMed] [Google Scholar]
- Molyneaux BJ, Arlotta P, Menezes JRL, Macklis JD (2007) Neuronal subtype specification in the cerebral cortex. Nat Rev Neurosci 8: 427–437 [DOI] [PubMed] [Google Scholar]
- Murray E, Cho JH, Goodwin D, Ku T, Swaney J, Kim S‐Y, Choi H, Park Y‐G, Park J‐Y, Hubbert A, McCue M, Vassallo S, Bakh N, Frosch MP, Wedeen Van J, Seung HS, Chung K (2015) Simple, scalable proteomic imaging for high‐ dimensional profiling of intact systems. Cell 163: 1500–1514 [DOI] [PMC free article] [PubMed] [Google Scholar]
- O'Leary DDM, Chou S‐J, Sahara S (2007) Area patterning of the mammalian cortex. Neuron 56: 252–269 [DOI] [PubMed] [Google Scholar]
- Paşca AM, Sloan SA, Clarke LE, Tian Y, Makinson CD, Huber N, Kim CH, Park J‐Y, O'Rourke NA, Nguyen KD, Smith SJ, Huguenard JR, Geschwind DH, Barres BA, Paşca SP (2015) Functional cortical neurons and astrocytes from human pluripotent stem cells in 3D culture. Nat Methods 12: 671–678 [DOI] [PMC free article] [PubMed] [Google Scholar]
- Qian X, Nguyen HN, Song MM, Hadiono C, Ogden SC, Hammack C, Yao B, Hamersky GR, Jacob F, Zhong C, Yoon K‐J, Jeang W, Lin L, Li Y, Thakor J, Berg DA, Zhang C, Kang E, Chickering M, Nauen D et al (2016) Brain‐region‐specific organoids using mini‐ bioreactors for modeling ZIKV exposure. Cell 165: 1238–1254 [DOI] [PMC free article] [PubMed] [Google Scholar]
- Rakic P (1974) Neurons in rhesus monkey visual cortex: systematic relation between time of origin and eventual disposition. Science 183: 425–427 [DOI] [PubMed] [Google Scholar]
- Sanes DH, Reh TA, Harris WA (2011) Development of the nervous system, 3rd edn Waltham, MA: Academic Press. [Google Scholar]
- Sauvageot C (2002) Molecular mechanisms controlling cortical gliogenesis. Curr Opin Neurobiol 12: 244–249 [DOI] [PubMed] [Google Scholar]
- Shi Y, Kirwan P, Smith J, Robinson HPC, Livesey FJ (2012) Human cerebral cortex development from pluripotent stem cells to functional excitatory synapses. Nat Neurosci 15: 477–486 [DOI] [PMC free article] [PubMed] [Google Scholar]
- Subramanian L, Remedios R, Shetty A, Tole S (2009) Signals from the edges: the cortical hem and antihem in telencephalic development. Semin Cell Dev Biol 20: 712–718 [DOI] [PMC free article] [PubMed] [Google Scholar]
- Taverna E, Götz M, Huttner WB (2014) The cell biology of neurogenesis: toward an understanding of the development and evolution of the neocortex. Annu Rev Cell Dev Biol 30: 465–502 [DOI] [PubMed] [Google Scholar]
Associated Data
This section collects any data citations, data availability statements, or supplementary materials included in this article.
Supplementary Materials
Expanded View Figures PDF
Table EV1
Table EV2
Movie EV1
Movie EV2
Review Process File