

Abstract
Key points
Chronic alcohol consumption causes a spectrum of liver diseases, but the pathogenic mechanisms driving the onset and progression of disease are not clearly defined.
We show that chronic alcohol feeding sensitizes rat hepatocytes to Ca2+‐mobilizing hormones resulting in a leftward shift in the concentration–response relationship and the transition from oscillatory to more sustained and prolonged Ca2+ increases.
Our data demonstrate that alcohol‐dependent adaptation in the Ca2+ signalling pathway occurs at the level of hormone‐induced inositol 1,4,5 trisphosphate (IP3) production and does not involve changes in the sensitivity of the IP3 receptor or size of internal Ca2+ stores.
We suggest that prolonged and aberrant hormone‐evoked Ca2+ increases may stimulate the production of mitochondrial reactive oxygen species and contribute to alcohol‐induced hepatocyte injury.
Abstract
‘Adaptive’ responses of the liver to chronic alcohol consumption may underlie the development of cell and tissue injury. Alcohol administration can perturb multiple signalling pathways including phosphoinositide‐dependent cytosolic calcium ([Ca2+]i) increases, which can adversely affect mitochondrial Ca2+ levels, reactive oxygen species production and energy metabolism. Our data indicate that chronic alcohol feeding induces a leftward shift in the dose–response for Ca2+‐mobilizing hormones resulting in more sustained and prolonged [Ca2+]i increases in both cultured hepatocytes and hepatocytes within the intact perfused liver. Ca2+ increases were initiated at lower hormone concentrations, and intercellular calcium wave propagation rates were faster in alcoholics compared to controls. Acute alcohol treatment (25 mm) completely inhibited hormone‐induced calcium increases in control livers, but not after chronic alcohol‐feeding, suggesting desensitization to the inhibitory actions of ethanol. Hormone‐induced inositol 1,4,5 trisphosphate (IP3) accumulation and phospholipase C (PLC) activity were significantly potentiated in hepatocytes from alcohol‐fed rats compared to controls. Removal of extracellular calcium, or chelation of intracellular calcium did not normalize the differences in hormone‐stimulated PLC activity, indicating calcium‐dependent PLCs are not upregulated by alcohol. We propose that the liver ‘adapts’ to chronic alcohol exposure by increasing hormone‐dependent IP3 formation, leading to aberrant calcium increases, which may contribute to hepatocyte injury.
Keywords: alcohol, calcium signalling, hepatocyte
Key points
Chronic alcohol consumption causes a spectrum of liver diseases, but the pathogenic mechanisms driving the onset and progression of disease are not clearly defined.
We show that chronic alcohol feeding sensitizes rat hepatocytes to Ca2+‐mobilizing hormones resulting in a leftward shift in the concentration–response relationship and the transition from oscillatory to more sustained and prolonged Ca2+ increases.
Our data demonstrate that alcohol‐dependent adaptation in the Ca2+ signalling pathway occurs at the level of hormone‐induced inositol 1,4,5 trisphosphate (IP3) production and does not involve changes in the sensitivity of the IP3 receptor or size of internal Ca2+ stores.
We suggest that prolonged and aberrant hormone‐evoked Ca2+ increases may stimulate the production of mitochondrial reactive oxygen species and contribute to alcohol‐induced hepatocyte injury.
Abbreviations
- ALD
alcoholic liver disease
- ALT
alanine aminotransferase
- ER
endoplasmic reticulum
- FRET
fluorescence resonance energy transfer
- GPCR
G‐protein coupled receptor
- ICB
intracellular‐like buffer
- IP3
inositol, 1,4,5 trisphosphate
- IP3R
inositol, 1,4,5 trisphosphate receptor
- PI‐PLC
phosphoinositide phospholipase C
- PC
pericentral
- PKA
protein kinase A
- PKC
protein kinase C
- PP
periportal
- PTP
permeability transition pore
- ROS
reactive oxygen species
- SOCE
Store operated Ca2+ entry
- UPR
unfolded protein response
- VP
vasopressin
Introduction
Alcoholic liver disease (ALD) remains a major cause of morbidity and mortality worldwide. In Western countries, excessive alcohol consumption is the main aetiological factor in roughly 50% of end‐stage liver disease patients (Gao & Bataller, 2011). ALD manifests initially as fatty liver (steatosis) and then progresses through alcoholic hepatitis, fibrosis and cirrhosis with certain cases resulting in hepatocellular carcinoma (Ishak et al. 1991; Altamirano & Bataller, 2011). Whilst the pathology of ALD is well defined, the mechanisms leading to the onset and progression to ALD are only partially delineated. The liver is the primary site of alcohol clearance, and as such is especially susceptible to the toxic by‐products of alcohol metabolism. Alcohol is metabolized by alcohol dehydrogenases and at higher concentrations by cytochrome P450 isoforms, primarily CYP2E1 (Hoek & Pastorino, 2004). Either of those enzyme systems converts alcohol to the toxic metabolite acetaldehyde, which is subsequently broken down by aldehyde dehydrogenase‐2 in the mitochondrial matrix. Alcohol and its metabolites exert acute toxic effects on the liver increasing oxidative stress, insulin resistance, endoplasmic reticulum (ER) stress and lipid peroxidation (Marcinkeviciute et al. 2000; Hoek & Pastorino, 2004; Koop, 2006; Albano, 2008b; Ramirez et al. 2013). However, the molecular mechanisms by which chronic alcohol exposure leads to steatosis and end‐stage liver disease have yet to be fully elucidated, highlighting the need for novel therapies to halt or slow the progression of ALD (Altamirano & Bataller, 2011).
In this study, we describe the effects of chronic alcohol feeding on hormone‐dependent calcium signalling in hepatocytes. Hormone‐dependent changes in cytosolic free calcium ([Ca2+]i) are an essential signalling pathway to coordinate many basic liver functions, including regulation of glucose homeostasis, bile production, mitochondrial oxidative phosphorylation, stress responses and tissue regeneration (Hajnóczky et al. 1995; Robb‐Gaspers et al. 1998a; Gaspers & Thomas, 2008; Amaya & Nathanson, 2013; Bartlett et al. 2014). Major liver hormones such as catecholamines and vasopressin increase [Ca2+]i by activating the phosphoinositide‐specific phospholipase C (PI‐PLC) signalling cascade (Thomas et al. 1996). Our previous studies have shown that inositol 1,4,5 trisphosphate (IP3)‐linked hormones evoke periodic [Ca2+]i spikes or oscillations that propagate across the cell as a regenerative intracellular Ca2+ wave in isolated hepatocytes (Rooney et al. 1991; Thomas et al. 1996; Bartlett et al. 2014), as well as between hepatocytes within the intact perfused liver as intercellular Ca2+ waves (Robb‐Gaspers & Thomas, 1995a; Robb‐Gaspers et al. 1998b; Patel et al. 2002). Hepatocytes exhibit frequency modulation, whereby the [Ca2+]i oscillation frequency is a function of hormone concentration. By contrast, spike amplitude, kinetics and intracellular Ca2+ wave propagation rates remain constant irrespective of stimulus strength (Rooney et al. 1991; Thomas et al. 1996; Bartlett et al. 2014). In the intact tissue, intercellular Ca2+ waves are coordinated across entire lobules through gap junction communication and propagate along the hepatic plates at a rate dependent on stimulus strength (Robb‐Gaspers & Thomas, 1995a; Gaspers & Thomas, 2005). Significantly, fluctuations in [Ca2+]i are relayed to mitochondria to regulate oxidative phosphorylation via activation of intramitochondrial dehydrogenases, resulting in elevation of NAD(P)H (McCormack & Denton, 1990; Hajnóczky et al. 1995; Robb‐Gaspers et al. 1998b). Thus, changes in the concentration of circulating hormones, e.g. catecholamines, are encoded by alterations in the frequency and intercellular propagation rate of [Ca2+]i increases to match signal strength with metabolic output at the organ level. The ability of mitochondria to perceive and respond to fluctuations in [Ca2+]i is essential to drive oxidative phosphorylation to maintain cellular ATP levels. However, sustained elevations in [Ca2+] can result in enhanced flux through the electron transport chain, which increases reactive oxygen species (ROS) generation (Brookes et al. 2004; Murphy, 2009). Mitochondrial Ca2+ overload can overwhelm the cellular antioxidant systems leading to oxidative stress and ultimately tissue dysfunction (Baumgartner et al. 2009; Santulli et al. 2015). Furthermore, sustained elevations in mitochondrial Ca2+ can also induce the opening of the permeability transition pore (PTP), collapsing the mitochondrial membrane potential leading to apoptotic and necrotic cell death (Rizzuto et al. 2012). We have previously reported that susceptibility to mitochondrial PTP transition in isolated liver mitochondria and hepatocytes is enhanced by alcohol feeding (Pastorino & Hoek, 2000) and sustained increases in cytosolic Ca2+ can stimulate mitochondrial ROS production (Gaspers et al. 2012). Therefore, we hypothesized that pathological conditions that alter hormone‐dependent Ca2+ signalling in the liver may have a profound impact on the health of individual hepatocytes and the organ as a whole.
Previous studies have identified a link between acute alcohol intoxication and perturbation of the PI‐PLC signalling pathway. Acute alcohol exposure activates phosphoinositol 4,5 bisphosphate hydrolysis in the absence of hormone (Hoek et al. 1987, 1992, 1993; Rooney et al. 1989a; Hoek & Rubin, 1990). However, this effect is transient and is followed by a suppression of hormone‐dependent IP3 production and [Ca2+]i release (Higashi & Hoek, 1991; Hoek et al. 1992, 1993; Zhang & Farrell, 1997). The sites of alcohol action, however, are not well defined. A direct effect on G‐protein GDP:GTP turnover is the proposed mechanism for the hormone‐independent effects of alcohol (Rooney et al. 1989a; Hoek et al. 1992). By contrast, the acute effects of alcohol on hormone‐dependent Ca2+ increases have been proposed to depend on alterations in protein kinase C (PKC)‐dependent feedback on IP3 production (Slater et al. 1993; Domenicotti et al. 1998). The effects of chronic alcohol exposure on phosphoinositide signalling in the liver are still controversial. Potentiating effects of chronic alcohol exposure on inositol phosphate signalling have been reported (Smith et al. 1983), whilst other studies show no effect or diminished PI‐PLC‐dependent responses (Hoek et al. 1990; Zhang et al. 1996b). The discrepancies in these studies may arise due to differences in feeding paradigm, alcohol exposure or experimental design.
In the present study, we assessed the effect of chronic alcohol consumption on hormone‐dependent PI‐PLC signalling in rat liver. We demonstrate in intact liver preparations and in cultured cells that chronic alcohol feeding sensitizes hepatocytes to IP3‐linked hormones, potentiating [Ca2+]i increases. These effects are maintained when hepatocytes are cultured overnight in the absence of ethanol. Moreover, the ability of acute alcohol exposure to inhibit vasopressin‐dependent [Ca2+]i increases in intact liver was decreased after chronic alcohol feeding. These data indicate that chronic alcohol feeding results in adaptive changes at the molecular level. Hormone‐coupled PLC activity and phosphoinositide turnover were significantly elevated in hepatocytes from chronic alcohol‐fed rats, whilst IP3 receptor (IP3R) levels, ligand sensitivity and distribution were unaffected. Our data provide evidence that chronic alcohol exposure results in increased PLC activity, access to substrate or decreased IP3 catabolism, which elevates inositol phosphate accumulation and potentiates hormone‐evoked Ca2+ release in hepatocytes.
Methods
Ethical approval and animal model
Animal studies were approved by the Institutional Animal Care and Use Committee at Rutgers, New Jersey Medical School and at Thomas Jefferson University and follow the policies and guidelines spelled out in the in ‘Principles and standards for reporting animal experiments in The Journal of Physiology and Experimental Physiology’ (Grundy, 2015).
The Lieber‐DeCarli pair‐feeding model for chronic alcohol feeding (Lieber & DeCarli, 1989) was carried out using pairs of 3–4 week old male Sprague‐Dawley rat littermates (Harlan laboratories). Rats were acclimated to the liquid diets and then the ‘alcoholic’ animals were maintained on an ethanol‐containing (36% of total calories) liquid diet for 60–120 days, while the littermate controls received an equivalent amount of an isocaloric diet with maltose substituted for ethanol. The Lieber‐DeCarli ’82 alcohol (F1258SP) and control liquid (F1259SP) diets were purchased from Bioserv, Inc. (Frenchtown, NJ, USA). At the end of the feeding protocol, the rats were anaesthetized with intraperitoneal injection of pentabarbital sodium (60 mg kg−1) diluted with PBS (1:1). The livers were harvested under a surgical level of anaesthesia and used to prepare isolated hepatocytes or intact perfused liver preparations. The organ donor does not recover from surgery as the portal vein and vena cava are severed to remove the liver, causing fatal blood loss. Cell viability was not affected by the alcohol feeding as judged by trypan blue staining; hepatocyte viability was 88. 0 ± 1.0 and 87.0 ± 1.0 % in control and alcohol‐fed groups, respectively (n = 19).
Serum alanine transferase (ALT) measurements
Blood was collected from rats anaesthetized under isoflourane via lateral tail vein sampling. The blood was allowed to coagulate for 30 min at room temperature. The clot was removed by centrifugation (2000 g for 10 min) and the supernatant, designated serum, was carefully removed. Serum ALT was then measured using the Stanbio ALT/GPT (Liqui‐UV) kit (Boerne, TX, USA) as per the manufacturer's instruction.
Blood alcohol concentration measurements
Blood alcohol concentration was measured using the ethanol assay kit from Megazyme (Chicago, IL, USA) as per the manufacturer's instruction.
Triglyceride measurements
The analysis of liver triglyceride levels was determined by saponification of blood or liver tissue in ethanolic KOH as described (Salmon & Flatt, 1985). The extract was neutralized with MgCl2 and glycerol content was determined enzymatically with the Glycerol Free Reagent kit (F6428; Sigma, St Louis, MO, USA).
Superoxide generation in liver sections
Freshly cut cross‐sections (10 μm) of unfixed frozen livers were incubated with 10 μm dihydroethidium (Invitrogen, Carlsbad, CA, USA) in an intracellular‐like buffer (ICB) for 30 min. ICB is composed of (in mm) 120 KCl, 10 NaCl, 2 MgCl2.6H2O, 20 Tris‐Hepes and 20% (w/v) sucrose; pH 7.4. Tissue sections were washed with ice‐cold ICB and counterstained with 2 μm Hoechst 34580 for 5 min. Liver sections were coverslipped and immediately visualized using a Zeiss Axiovert 200M fluorescence microscope and a 20× objective. Fluorescence images were analysed using Axiovision software.
Aconitase activity assay
In‐gel aconitase activity was assessed as previously described (Tong & Rouault, 2006). Briefly, isolated mitochondria from control and alcohol‐fed littermates were suspended in lysis buffer containing (in mm): 50 Tris‐HCl (pH 8.0), 50 NaCl, 2 sodium citrate plus 1% (v/v) Triton‐X 100, 10% (v/v) glycerol and 10 U catalase. Normalized levels of protein were resolved on a native gel and aconitase activity was determined by incubating the gel in the dark at 37°C in a buffer containing (in mm) 100 Tris‐HCl (pH 8.0), 1 NADP, 2.5 cis‐aconitic acid, 5 MgCl2, 1.2 3‐(4,5‐dimethylthiazol‐2‐yl)‐2,5‐diphenyltetrazolium bromide (MTT), 0.3 phenazine methosulfate and 5 U ml−1 isocitrate dehydrogenase. Band intensities were quantified using ImageJ software.
Laser scanning confocal microscopy
Confocal imaging of intact livers was performed as previously described (Robb‐Gaspers & Thomas, 1995b; Gaspers & Thomas, 2005). Livers were perfused via the hepatic portal vein with a Hepes‐buffered balance salt solution (HBSS) composed of (in mm): 121 NaCl, 25 Hepes, 5 NaHCO3, 4.7 KCl, 1.2 KH2PO4, 1.2 MgSO4, 1.3 CaCl2, 5.5 glucose, 0.5 glutamine, 3 lactate, 0.3 pyruvate, 0.2 bromosulfophthalein (BSP) and 0.1% BSA (pH 7.4), equilibrated with 100% O2 at 30°C. Loading with Ca2+‐sensitive indicators (5 μm) was done by recirculating the perfusion buffer supplemented with fura2‐AM or fluo8‐AM plus 0.02% Pluronic F‐127 and 2% BSA for 40–50 min. Confocal images were acquired with a 20× objective using a Bio‐Rad Radiance 2002‐MP confocal system equipped with a Mira/Verdi multi‐photon laser and argon laser. Fura2 images (810 nm excitation, 460–600 nm emission) and fluo8 images (488 nm excitation, 520–600 nm emission) were captured every 4 s.
Single cell calcium and PLC activity imaging
Hepatocytes were isolated by collagenase perfusion of livers from control or alcohol‐fed rats as described previously (Rooney et al. 1989b). Cells were plated onto glass coverslips coated with collagen (type I rat tail, Sigma; 10 μg cm−2) and maintained in a humidified atmosphere of 5% CO2 and 95% air at 37°C in Williams’ Medium E supplemented with fetal calf serum (10%, v/v), penicillin, (10 units ml−1), streptomycin (10 μg ml−1), gentamycin sulfate (50 μg ml−1), glutamine (2 mm) and insulin (140 nm). After 3 h, insulin was reduced to 14 nm and cells were cultured for an additional 16–20 h. In some experiments, hepatocytes were transfected by electroporation using an Amaxa Rat/Mouse Hepatocyte Nucleofector Kit according to the manufacturer's instructions (Lonza, Basel Switzerland).
Cultured hepatocytes were loaded with 5 μm fura 2‐AM and 0.02% (w/v) Pluronic F‐127 for 20 min in HBSS [in mm: 25 Hepes, 121 NaCl, 5 NaHCO3, 4.7 KCl, 1.2 KH2PO4, 1.2 MgSO4, 2.0 CaCl2, 10 glucose, 0.04 probenecid and 0.25% (w/v) fatty acid‐free BSA, pH 7.4]. Fluorescence images (excitation, 340 and 380 nm; emission, 420–600 nm) were acquired every 3 s using a cooled charged‐coupled device (CCD) camera as previously described (Rooney et al. 1989b). The Ca2+ concentration was calculated after correcting for autofluorescence.
Cytosolic calcium changes induced by photolysis of caged IP3 were measured using the Ca2+ indicator fluo4‐AM. Cells were loaded with 2 μm caged IP3 (SiChem GmbH, Bremen, Germany) in HBSS for 45 min, followed by 30 min with 5 μm fluo4‐AM. Cells were washed and mounted on the stage of an Axiovert200 (Zeiss, Oberkochen, Germany) spinning disc confocal microscope. Fluo4 fluorescence images (argon laser excitation 488 nm, emission >510 nm) were acquired at 2 Hz with a CCD camera using the data acquisition software Piper Control (Stanford Photonics, Palo Alto, CA, USA). Photorelease of caged IP3 was achieved by light pulses (1 ns duration with a wavelength of 337 nm and 1.45 mJ of energy) from a nitrogen charged UV flash lamp (Photon Technology International, Edison, NJ, USA) guided through the objective (C‐Achromat 20x). Data analysis was performed using ImageJ (NIH, Bethesda, MD, USA).
Near plasma membrane free calcium levels were determined in hepatocytes expressing LynD3cpv cameleon (Palmer et al. 2006). Fluorescence images were acquired with 436 nm excitation and the emitted fluorescent was split into donor and acceptor images with a 515 nm dichroic mirror followed by 480 ± 30 nm (CFP) or 535 ± 40 nm (cpVenus) emission filters (Gaspers & Thomas, 2008). The Ca2+ responses depicted were normalized to the minimal and maximal emission ratios obtained after treating the cells with ionomycin and 2 mm BAPTA followed by the addition of 4 mm calcium, respectively.
Single cell measurements of PLC activity were carried out in hepatocytes co‐expressing the CFP‐ and YFP‐tagged PH domains of PLCδ4 (gift from Dr T. Balla). Fluorescence resonance energy transfer (FRET) between the two probes was determined by simultaneously monitoring CFP emission (480 ± 30 nm) and YFP emission (535 ± 40 nm) whilst exciting CFP (436 ± 20 nm). The changes in the CFP/YFP ratio were normalized to the baseline ratio.
Immunoblotting
Whole cell lysates were analysed by SDS‐PAGE and transferred to nitrocellulose membranes, and antibody binding was visualized by enhanced chemiluminescence using a secondary antibody conjugated to horseradish peroxidase (Amersham Biosciences, Little Chalfont, UK) according to standard procedures. Primary antibodies used were PLC‐β3 (sc‐403, c‐20) (Santa Cruz, Santa Cruz, CA, USA), IP3R Type II (AB3000 ‐ LV1598412) and β‐actin (MAB1501–NG1848416) (Millipore, Billerica, MA, USA). Polyclonal anti‐aconitase and the polyclonal anti‐SERCA antibodies were generously provided by Dr D. Pain (Rutgers, USA) and Dr J. Lytton (University of Calgary, Canada), respectively.
Immunofluorescence
The cryosections of frozen liver were cut to 8–10 μm depth and post‐fixed by alcohol RP (30 min at 4°C), then acetone (1 min at room temperature). Primary antibody incubations were performed in wet atmosphere (60 min at room temperature) followed by fluorescent secondary antibodies Alexafluor 488 nm and Alexafluor 568 nm (Molecular Probes). Primary antibodies used were IP3R type I and II (Covalab, Villeurbanne, France), ZO‐1 (kind gift from Dr Stevenson, University of Alberta, Canada) and E‐cadherin (Clone 34/E) (BD Transduction Laboratories).
Real‐time PCR
mRNA was extracted from overnight cultured hepatocytes (TRIzol) and reverse transcribed (Qiagen, Valencia, CA, USA). Quantitative PCR analyses (MX 3000P; Stratagene, La Jolla, CA, USA) of Gαq and Gα11 genes were performed using the iTaq SYBR Green Supermix with Rox (Bio‐Rad Laboratories, Hercules, CA, USA). Crossing times (CT) are normalized to the reference gene, RNA polymerase II, for each individual sample. The mean CT value for RNA polymerase II (27.9) was similar to the mean CT values for both Gαq (27.7) and Gα11 (26.7).
[3H]‐Inositol phosphate accumulation
Cells were cultured overnight in inositol‐free D‐MEM (MP Biomedicals) supplemented with 25 μCi ml−1 [3H]myo‐inositol (American Radiochemicals), 5% fetal bovine serum, penicillin, (10 units ml−1), streptomycin (10 μg ml−1), gentamycin sulfate (50 μg ml−1), glutamine (2 mm) and insulin (14 nm). Cultures were washed with HBSS and incubated for 15 min in LiCl (10 mm) to block inositol monophosphate hydrolysis prior to agonist stimulation. Experiments were carried out in the absence of extracellular Ca2+ or after incubation with BAPTA‐AM (100 μm; 30 min) where indicated. The reaction was terminated by addition of ice‐cold tricholoroacetic acid, the water‐soluble [H3]inositol‐containing components were then extracted by addition of tri‐n‐octylamine:1,1,2‐trichlorofluoroethane (1:1 ratio) and [H3]inositol phosphates were separated by ion exchange chromatography (Berridge et al. 1982) using Dowex resin in the formate form. Lower order inositols and glycerophospholipids were removed by elution with 40 ml 0.1 m ammonium formate/0.1 m formic acid. IP3 and higher order inositol were then eluted with 10 ml of 1.2 m ammonium formate/0.1 m formic acid. Ultima‐Flo (Perkin Elmer, Waltham, MA, USA) was added to the eluate and disintegrations per minute (d.p.m.) was determined using liquid scintillation counting.
IP3 mass assay
Overnight cultured hepatocytes were washed and incubated in HBSS (30 min) prior to hormone addition. The reactions were terminated and water‐soluble inositol phosphates were extracted as above. The Ins(1,4,5,)P3 content in the extracted samples was determined using a [3H]‐Ins(1,4,5)P3 competition binding assay, using an Ins(1,4,5)P3 binding protein purified from rat cerebellum (Bredt et al. 1989). Ins(1,4,5)P3 standards were diluted in the extracted buffer prepared from the phase separation protocol described above. Samples or standards, [3H]‐Ins(1,4,5,)P3 (American Radiochemicals) and assay buffer (Tris‐HCl; 50 mm, EDTA; 1 mm, dithiothreitol; 1 mm, pH 8.4) were incubated for 1 h prior to collection of binding protein by centrifugation and aspiration of buffer. The IP3 mass content was calculated from the bound [3H]‐Ins(1,4,5,)P3 determined by liquid scintillation counting and conversion of radioactivity in d.p.m. to pmol mg−1 protein.
Statistical analysis
Graph plotting and data analysis was performed with GraphPad Prism software. Statistical analysis was performed using two‐tailed Student's t test or two‐tailed one way ANOVA where indicated in figure legends. All data are expressed as mean ± SEM.
Results
Chronic alcohol feeding and liver function
The Lieber‐Decarli alcohol feeding model employed in this study has been used extensively to recapitulate the early stages of ALD. The feeding paradigm induces liver steatosis and mitochondrial injury within 4 weeks, although alcohol‐fed animals do not progress to liver fibrosis and display little to no inflammation even after prolonged feeding (up to 9 months) (Leo & Lieber, 1983; de la M. Hall et al. 2001). For this study, rats were fed control or alcohol‐containing liquid diets for 60 or 120 days. Biochemical measurements of liver triglycerides confirmed that the diet and exposure protocol induced a fatty liver after either 60 or 120 days of alcohol feeding (Table 1). Moreover, haematoxylin–eosin‐stained liver sections clearly showed an increase in lipid droplet content in alcohol‐fed animals compared to controls (Fig. 1 A). Blood alanine aminotransferase (ALT) levels, whilst still within the normal range reported for rats, were significantly elevated in alcohol‐fed animals after 60 days (Table 1) indicating the onset of mild hepatocellular injury. As we reported previously, there was also an alcohol‐dependent decrease in nuclear and mitochondrial encoded polypeptide subunits involved in the assembly of mitochondrial respiratory chain complexes I and IV, suggesting the onset of mitochondrial injury (see Wang et al. 2016). However, consistent with previous studies we observed no evidence for increased fibrosis using Sirius red staining as a readout.
Table 1.
Biochemical changes induced by the Lieber–DeCarli alcohol feeding paradigm
| Control | Alcohol‐fed | P | |
|---|---|---|---|
| Serum TG (mg dl−1) | 125.3 ± 25.5 | 100.3 ± 21.6 | ns |
| Liver TG (mg dl−1) | 10.8 ± 1.0 | 31.3 ± 7.8 | ˂0.05 |
| Liver TG (120 days; mg dl−1) | 19.6 ± 2.2 | 43.4 ± 3.0 | ˂0.001 |
| ALT (U l−1) | 14.7 ± 0.9 | 26.4 ± 1.1 | ˂0.001 |
| Blood alcohol (mm) | – | 17.6 ± 2.7 | ˂0.001 |
Liver triglyceride (TG) levels and alanine aminotransferase (ALT) levels are elevated after chronic alcohol feeding. All data are mean ± SEM of samples from four pairs of alcohol‐fed rats and their pair‐fed littermate controls. Animals were fed alcohol for 60 days or 120 days where indicated. ns, Not significant.
Figure 1. Chronic alcohol feeding causes steatosis and oxidative damage in the liver.
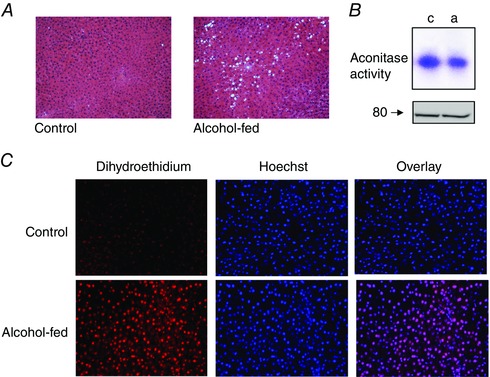
A, representative images of haematoxylin–eosin‐stained liver sections from control (left) and alcohol‐fed rats (right, 120 days). B, in‐gel detection of aconitase activity in liver mitochondria isolated from control (c) and alcohol‐fed (a) animals; total aconitase‐II protein levels are shown below. C, representative images of dihydroethidium‐ (left) and Hoechst 34580‐ (middle) stained frozen liver sections from an alcohol‐fed rat and its pair‐fed control. The oxidation of dihydroethidium produces ethidium which stains the nucleus a bright fluorescent red. The overlay of ethidium and Hoechst 34580 fluorescent images is shown to the right.
We used two independent techniques to assess levels of alcohol‐induced oxidative damage. The activity of aconitase‐II was used as a biomarker of mitochondrial oxidative injury. This tricarboxylic acid cycle enzyme contains an Fe–S cluster in its active site, which can be oxidized and reversibly inactivated by superoxide radicals (Flint et al. 1993; Tong & Rouault, 2006). Aconitase activity was determined in mitochondrial lysates using a colorimetric in‐gel assay (Tong & Rouault, 2006). Fig. 1 B shows the representative aconitase activity assay (top) and total aconitase II protein levels (bottom) in liver mitochondria isolated from an alcohol‐fed rat and its pair‐fed control. Alcohol exposure induced a modest but reproducible, 23.3 ± 3.2%, n = 3, p ˂ 0.01, reduction in aconitase activity compared to controls. Cellular oxidative stress was also determined by dihydroethidium staining of frozen and cryosectioned liver tissue (Fig. 1 C). Dihydroethidium is oxidized by the superoxide anion to the polynucleotide stain ethidium, which accumulates in the nucleus. Co‐staining with Hoechst 34580 revealed a 2‐fold increase in nuclear staining of ethidium in liver tissue from alcohol‐fed animals with lower staining levels detected in controls (nuclear ethidium staining intensity was 45 ± 5 arbitrary fluorescent units in alcohol‐fed tissue compared to 27 ± 0.7 in controls, n = 3, P ˂ 0.05 vs. 120 day alcohol‐fed animals).
Chronic alcohol feeding potentiates hormone‐induced Ca2+ signalling in intact perfused liver
Hormone‐dependent changes in [Ca2+]i in intact liver preparations (Robb‐Gaspers et al. 1998b; Patel et al. 1999; Gaspers & Thomas, 2005) from control and alcohol‐fed animals were assessed to determine sensitivity to vasopressin (VP) challenge. Multi‐photon confocal images of fura‐2‐loaded intact perfused livers (20× magnification) revealed the typical liver architecture of hepatic plates separated by sinusoids (Fig. 2 A and B). Periportal (PP) and pericentral (PC) zones labelled in Figs 2 and 5 were identified by perfusing fluorescein‐conjugated BSA through the portal vein as described (Robb‐Gaspers & Thomas, 1995a). The liver was infused with increasing VP concentrations and changes in [Ca2+]i were monitored in real time. Ca2+ increases are shown in a red overlay (Figs 2 A and B and 5 A–D). Asynchronous [Ca2+]i spikes were observed in individual hepatocytes at low VP stimulation in both control and alcohol‐fed livers, but the threshold dose for the onset of a Ca2+ response was markedly lower after 60 days of alcohol feeding (Figs 2 and 5). Higher VP doses evoked [Ca2+]i increases that propagated across entire lobules as coordinated intercellular Ca2+ waves, starting in the PP and ending in the PC zones. There was a clear difference in [VP] at which propagating intercellular Ca2+ waves are observed in control (100 pm; Fig. 2 A panel 6) vs. alcohol‐fed (10 pm; Fig. 2 B panel 4) liver preparations. Representative fura2 fluorescence intensity changes in individual hepatocytes from control and alcohol‐fed rats are shown in Fig. 2 C and D, respectively. Ca2+ spikes in the absence of VP stimulation were observed in a subset of hepatocytes from alcohol‐fed animals only. The red overlay in Fig. 2 B, panel 2, shows a Ca2+ transient in a hepatocyte 20 s before VP infusion.
Figure 2. Effect of chronic alcohol feeding on vasopressin‐induced [Ca2+]i increases in the intact perfused liver.

Livers from control or alcohol‐fed (60 days) littermates were isolated and loaded with fura2‐AM. Multi‐photon confocal images of fura2 fluorescence are shown in a linear greyscale and differential images of [Ca2+]i increases are depicted with a red overlay. Periportal (PP) and pericentral (PC) regions are indicated in first panel of each montage sequence. Control (A; panels 1–6) or alcohol‐fed (B; panels 1–6) livers were stimulated with increasing vasopressin (VP; 1–300 pm) concentrations and [Ca2+]i responses were monitored in real time. The time and VP concentration in the perfusate are shown on the top of each panel. Ca2+ increases in the absence of VP were observed in some hepatocytes from alcohol‐fed animals only (see red cell in B panel 2). Representative traces of VP‐dependent [Ca2+]i increases in individual hepatocytes from control (C) or alcohol‐fed (D) livers are shown. E, concentration dependence of VP‐induced [Ca2+]i responses in perfused livers of control (blue) or alcohol‐fed (red) rats. Data are the percentage of cells responding to the indicated VP concentration; mean ± SEM from three pairs of alcohol‐fed rats and their pair‐fed control littermates.
Figure 5. Chronic‐alcohol feeding desensitizes hepatocytes to the inhibitory effects of acute alcohol treatment.

Livers from control or alcohol‐fed littermates were isolated and loaded with fluo‐8. Confocal images of fluo‐8 fluorescence are shown in a linear greyscale and differential images of [Ca2+]i increases are depicted with a red overlay. Control (A, B) and alcohol‐fed (C, D) livers were infused with increasing concentrations of vasopressin (VP) in the absence (A, C) or presence (B, D) of acute alcohol (25 mm) treatment. Time and VP concentration in the perfusate are shown on each image. Representative traces of VP‐dependent [Ca2+]i responses in individual hepatocytes are shown below each panel. E, concentration dependence of VP‐induced [Ca2+]i responses in the presence and absence of 25 mm alcohol. Data are the percentage of cells responding to indicated VP concentration; mean ± SEM from three pairs.
VP dose–response curves revealed a leftward shift in hormone potency in alcohol‐fed livers compared to controls with a significant increase in the number of cells responding at lower hormone doses. An increase in hormone sensitivity was apparent after both 60 and 120 days of alcohol feeding (Figs 2 E and 6 D; Table 2). Analysis of the proportion of cells responding to VP stimulation with oscillatory or sustained [Ca2+]i increases in control and alcohol‐fed liver preparations demonstrates that hepatocytes from alcohol‐fed rats are more sensitive to hormone challenge and also show that oscillating and sustained elevations in [Ca2+]i occurred in a greater proportion of cells and at lower concentrations (Fig. 3 A and B). Figure 3 C shows the rates of intercellular Ca2+ wave propagation in intact liver preparations isolated from alcohol‐fed rats and their pair‐fed littermate controls. These data were obtained using hormone doses which evoked Ca2+ increases throughout the lobule. VP doses were 10–30 pm for alcohol‐fed livers and 100–300 pm for their littermate controls, reflecting the differences in hormone sensitivity between the two groups. The data show that the intercellular Ca2+ wave propagation rate was faster in livers from alcohol‐fed rats compared to their controls, even though alcoholic livers were stimulated with lower hormone concentrations.
Figure 6. Chronic alcohol‐induced hypersensitivity to PLC‐coupled hormones is maintained in overnight hepatocyte cultures.
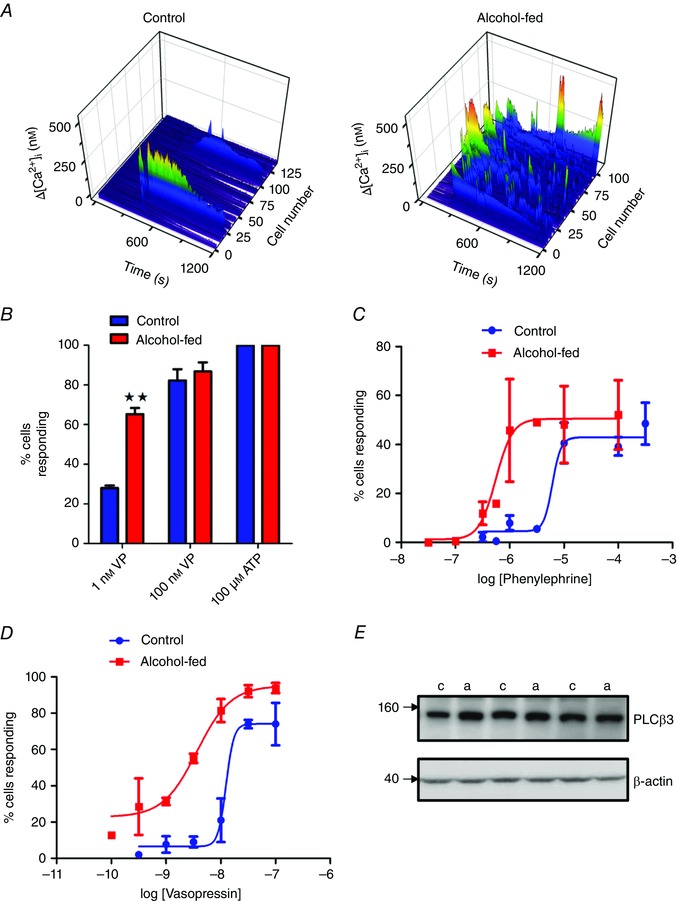
Hepatocytes were cultured overnight in the absence of ethanol as described in the Methods. A, VP‐induced (1 nm) [Ca2+]i increases in hepatocytes from control and alcohol‐fed animals were determined in fura2‐loaded cells. The changes in [Ca2+]i levels (z axis) are shown in pseudocolour (blue low and red high) and plotted against time (x axis) for each individual cell from a single experiment (y axis). B, percentage of cells responding to indicated VP concentrations or maximal ATP stimulation in hepatocytes from control and alcohol‐fed animals. C, concentration dependence of phenylephrine elicited Ca2+ increases in overnight cultured hepatocytes from control (blue) and alcohol‐fed (red) animals. D, concentration dependence of vasopressin elicited Ca2+ increases in overnight cultured hepatocytes from animals fed alcohol for 120 days (red) and their pair‐fed controls (blue). E, Western blot analysis of PLCβ3 protein levels in cultured hepatocytes isolated from control (c) and alcohol‐fed (a) rats. No significant differences were detected. β‐Actin protein levels are shown for protein loading control.
Table 2.
Comparison of EC50 and maximum response values for hormone‐dependent dose–response data for Ca2+ and inositol polyphosphate (IPx) responses
| EC50 | Maximum response | ||||
|---|---|---|---|---|---|
| Control | Alcohol‐fed | Control | Alcohol‐fed | ||
| VP Ca2+ DR, Fig. 2 E | 50.2 ± 0.2 pm | 4.6 ± 0.1 pm *** | 101 ± 17 | 96 ± 5.5 ns | % respond |
| PE Ca2+ DR, Fig. 6 C | 6.1 ± 0.4 μm | 0.6 ± 0.2 μm *** | 42.9 ± 4.3 | 50.5 ± 7.6 ns | % respond |
| VP Ca2+ DR (120 day), Fig. 6 D | 15.4 ± 0.6 nm | 3.7 ± 0.2 nm | 74.1 ± 7.2 | 95.1 ± 9.8 | % respond |
| VP IPx DR, Fig. 9 D | 2.3 ± 0.2 nm | 4.0 ± 0.1 nm ** | 1.7 ± 0.1 | 6.5 ± 0.5*** | fold increase |
| VP IPx DR (120 day), Fig. 9 F | 6.9 ± 0.2 nm | 8.5 ± 0.2 nm ** | 0.5 ± 0.0 | 1.3 ± 0.2** | fold increase |
The EC50 and maximum response values for the dose–response data reported in this study are shown. Chronic alcohol feeding results in a significant shift in EC50 in both hormone‐dependent Ca2+ increases and PLC activity as measured by IPx response. Sensitivity to hormone challenge is altered in both cultured cells and in hepatocytes from older rats, but the effect of chronic alcohol is consistent. Data are mean ± SEM for at least three independent experiments. Specific n values are shown in corresponding figures (with the exception of the VP Ca2+ response in 120 day alcoholic hepatocytes which shows the range observed from two independent experiments). Statistical significance between EC50 and maximum response values was determined with a Student's t test, *** P < 0.001; ** P < 0.01; ns, not significant.
Figure 3. Chronic alcohol feeding sensitizes hepatocytes within intact perfused liver to vasopressin.

Data from experiments shown in Fig. 2 were used to calculate the percentage of cells displaying Ca2+ oscillations (A) or sustained Ca2+ increases (B) in response to infusing the indicated VP concentrations. C, data show the average rates of intercellular Ca2+ wave propagation. The data were calculated for hormone concentrations that evoked Ca2+ increases that propagated across the entire lobule. The concentrations were 10–30 pm VP for alcohol‐fed livers and 100–300 pm VP for their littermate controls, reflecting the differences in hormone sensitivity between the two treatment groups.
We also assessed the response to VP stimulation (50 pm) in freshly isolated hepatocytes from control and alcohol‐fed rats. Similar to results from the intact liver studies, the proportion of cells responding to hormone challenge was greater in alcohol‐fed rats compared to control, with a larger proportion of cells responding with sustained Ca2+ increases (Table 3). Basal resting Ca2+ levels and the peak amplitude of VP‐induced [Ca2+]i spikes were unaffected by chronic alcohol feeding. By contrast, individual [Ca2+]i transients were broader in hepatocytes from alcohol‐fed rats due to a decrease in the Ca2+ decay rate compared to controls (Table 3). Parallel studies in cultured hepatocytes detected no difference in the magnitude of Ca2+ release from the ER store (thapsigargin‐dependent) or rates of Ca2+ influx or efflux after alcohol feeding (Fig. 4). These data suggest that the effects of alcohol on hormone‐evoked Ca2+ signals may be due to sensitization of the PI‐PLC signalling pathway rather than changes in Ca2+ homoeostasis or ER Ca2+ load.
Table 3.
Effect of chronic alcohol feeding on basal and VP‐dependent [Ca2+]i increases in freshly isolated hepatocytes
| Control | Alcohol‐fed | P | |
|---|---|---|---|
| % cells responding | 43.5 | 73.4 | |
| Oscillatory responses (% of total) | 33.7 | 15.4 | |
| Saturated response (% of total) | 9.8 | 58 | |
| Basal [Ca2+]i (nm) | 60.4 ± 3.7 | 70.7 ± 6.4 | ns |
| Peak [Ca2+]i (nm) | 283 ± 13 | 304 ± 18 | ns |
| Rate of Ca2+ i rise (nm s−1) | 30.7 ± 2.6 | 33.5 ± 3.2 | ns |
| Rate of Ca2+ i decay (nm s−1) | 6.2 ± 0.3 | 4.5 ± 0.4 | ≤0.02 |
Fura2‐loaded hepatocytes isolated from control and alcohol‐fed rats were stimulated with VP (50 pm) and changes in [Ca2+]i in individual hepatocytes were analysed by fluorescence microscopy. Peak [Ca2+]i and rates of rise and decay were calculated from all responsive cells. Data are mean ± SEM from four independent experiments. ns, Not significant.
Figure 4. Chronic alcohol feeding has no effect on ER Ca2+ load or rates of Ca2+ influx and efflux.

Isolated hepatocytes were transfected with a membrane‐targeted Ca2+‐sensitive fluoresecent protein (LynD3cpv) or loaded with fura2 then treated with thapsigargin in the absence of extracellular Ca2+ to determine ER store size (area under curve, AUC). The subsequent repletion of extracellular Ca2+ followed by addition of excess BAPTA free acid was used to determine the rates of Ca2+ influx and efflux (τ), respectively. A, representative mean traces from control (blue) and alcohol‐fed (red) hepatocytes expressing LynD3cpv. B, summary table of results showing no differences between control and alcohol‐fed rats. ER store size are means ± SEM from three independent experiments. Ca2+ influx and efflux data are population means of all transfected cells in the field of view; n = 2 independent experiments; 8–15 cells per measurement (similar effects were observed with fura2‐loaded hepatocytes).
The ability of acute alcohol to inhibit hormone‐induced Ca2+ signalling is diminished in chronic alcohol‐fed animals
Inhibitory effects of acute alcohol intoxication on hormone‐dependent Ca2+ increases have been previously reported in isolated hepatocytes (Hoek & Rubin, 1990; Higashi & Hoek, 1991; Hoek et al. 1992). Here we observe similar effects in intact liver preparations from control animals (Fig. 5 A and B). Isolated livers from pair‐fed control or alcohol‐fed rats were perfused with picomolar concentrations of VP in the absence (Fig. 5 A and C) or presence (Fig. 5 B and D) of 25 mm ethanol in the perfusion buffer. This dose approximates the highest blood alcohol levels measured in the alcohol‐fed group (Table 1). Acute alcohol treatment completely abolished the VP‐dependent Ca2+ increases in control livers, whereas only a partial inhibition was observed in alcohol‐fed livers. The proportion of cells responding at each VP dose are shown in Fig. 5 E. Furthermore, acute alcohol intoxication resulted in spatially disorganized calcium increases in alcohol‐fed livers that were sporadic and did not propagate across the lobule as intercellular calcium waves. These data are consistent with studies from isolated hepatocytes demonstrating that acute alcohol treatment inhibits gap junction intercellular communication (Abou Hashieh et al. 1996). Moreover, the data suggest that the inhibitory actions of acute ethanol treatment on gap junctions are not altered by alcohol feeding and that chronic alcohol feeding by itself does not impede gap junction communication.
The effect of chronic alcohol feeding is maintained overnight, indicating adaptive molecular changes occur with chronic alcohol exposure
To determine whether the presence of alcohol, or its metabolites, is required for the stimulatory effects on Ca2+ signalling, we compared hormone‐dependent Ca2+ responses in isolated hepatocytes cultured overnight in the absence of ethanol. Comparison of the proportion of responsive hepatocytes to submaximal hormone challenge revealed the cells from alcohol‐fed animals remained hyper‐sensitive even after ≥16 h in culture compared to cells from controls (Fig. 6 A–D and Table 2). The phenomenon is not specific to the arginine–vasopressin receptors as we also observed a pronounced leftward shift in the dose–response to the α1‐adrenergic agonist, phenylephrine, in cultured hepatocytes from alcohol‐fed rats in comparison to controls (Fig. 6 C). This effect was maintained in animals fed ethanol for 120 days (Fig. 6 D), indicating this adaptation in the Ca2+ signalling pathway persists during chronic exposure to alcohol.
The effects of chronic alcohol feeding on Ca2+ release were observed irrespective of the G‐protein coupled receptor (GPCR) activated, V1a (Figs 2 & 5), α1‐adrenergic (Fig. 6 C; Table 2) or purinergic receptors (see Fig. 9 C), indicating a mechanism downstream of this class of cell surface receptor. These data indicate chronic alcohol exposure may result in adaptive changes in the PI‐PLC signalling pathway. As PI‐PLC‐linked GPCRs transduce their signal via Gαq/11 and PLCβ we looked for changes in the level of these proteins. We observed no change in the mRNA levels of Gαq (control 0.967 ± 0.013; alcohol‐fed 0.963 ± 0.004 relative to RNA polymerase II) or Gα11 (control 0.952 ± 0.011; alcohol‐fed 0.968 ± 0.011 relative to RNA polymerase II) from hepatocytes isolated from control and alcohol‐fed rats. Unfortunately, a lack of available effective antibodies precluded determination of Gαq/11 protein levels. Furthermore, Western blot analysis revealed no change in PLCβ3 expression levels, the major GPCR isoform expressed in hepatocytes (Fig. 6 E). Although we cannot rule out post‐translational regulation of the G‐proteins, these data imply there are no gross changes in the levels of signalling molecules responsible for the generation of IP3.
Figure 9. Phospholipase C activity is potentiated by chronic alcohol feeding.

Cellular IP3 levels were determined using a competitive radioligand binding assay (see Methods). A, representative experiment showing time‐course of VP‐induced IP3 production in hepatocytes from control and alcohol‐fed rats. B, summary data showing VP‐induced peak (30–90 s) and plateau (300 s) levels of IP3 in hepatocytes from alcohol‐fed rats and their pair‐fed controls. Data are expressed as fold increase over basal; n = 5 pairs, ★ P ≤ 0.05. C, relative PLC activity was determined by assessment of hormone‐induced inositol polyphosphate (IPx) production in [3H]myo‐inositol‐labelled hepatocytes as described in the Methods. Data are mean ± SEM from five animal pairs. VP‐ and ATP‐induced PLC activity are significantly higher in hepatocytes from alcohol‐fed rats vs. controls; paired Student's t test ★★ P ≤ 0.001, ★ P ≤ 0.05. E, isolated hepatocytes from control and alcohol‐fed rats were transfected with cDNAs encoding CFP‐ and YFP‐tagged PH domains of PLCδ4 to enable real time measurements of PLC activity (Bartlett et al. 2015). Representative traces showing the mean vasopressin‐ (3 nm, VP) and ATP‐ (100 μm) induced increases in the normalized FRET ratio in control (blue) or alcohol‐fed (red) hepatocytes. Data are representative of three independent experiments, n = 5–25 cells per experiment. Concentration‐dependence of VP‐induced PLC activity in hepatocytes after 60 (D) or 120 days (F) of alcohol feeding compared to their corresponding pair‐fed controls.
IP3R location, density and function are unaffected by chronic alcohol feeding
In polarized cells such as hepatocytes, the subcellular distribution of IP3Rs is known to regulate the initiation site of the Ca2+ response and propagation of intracellular Ca2+ waves (Hirata et al. 2002; Hernandez et al. 2007). There are two major IP3R subtypes in hepatocytes: type I and type II. IP3R type II localizes to the apical pole whilst IP3R type I is uniformly distributed throughout the cytoplasm. In the intact liver, reduction of both IP3R type I and II with siRNA decreases the sensitivity of hepatocytes to hormone challenge, and reduction of IP3R type II also delays Ca2+ wave initiation and propagation speed (Hernandez et al. 2007). Thus, we tested the hypothesis that alterations in IP3R distribution or sensitivity to ligand may account for the hyper‐sensitivity of hepatocytes to hormone challenge induced by alcohol feeding. Consistent with previous reports (Hirata et al. 2002; Hernandez et al. 2007), immunostaining of liver cryosections revealed typical subcellular distribution of IP3Rs type I (uniform) and type II (apical) in livers of alcohol‐fed rats (Fig. 7 A) with no difference in the immunostaining pattern compared to controls. IP3R type II co‐localized with the tight junction maker ZO‐1 (consistent with apical pole distribution) in both control and alcohol‐fed livers. Co‐staining liver slices with E‐cadherin (a cell junction marker) revealed no gross effect of alcohol feeding on liver architecture or hepatocyte polarity. Furthermore, no effect on IP3R type II protein expression was observed between hepatocyte membrane preparations from control and alcohol‐fed rats (Fig. 7 B and C).
Figure 7. The subcellular distribution and density of IP3 receptors is unaffected by chronic alcohol feeding.

A, liver cryosections from control (i, iii, v, vii) or alcohol‐fed (ii, iv, vi, viii) animals were immunostained for IP3Rs or ZO‐1. Images show the lobular distribution pattern of IP3R type I (i, ii), IP3R type II (iii, iv), the co‐location pattern of ZO‐1 (red) and IP3R type II (green) in a merged image (v, vi) or the co‐location pattern of E‐cadherin and (red) and IP3R type II (green) in a merged image (vii, viii). B, IP3R type II protein levels were determined in membrane fractions prepared from cultured hepatocytes from control (c) or alcohol‐fed (a) rats. Summary data are shown in C normalized to SERCA, n = 4 pairs.
IP3R open probability is regulated by many factors, notably phosphorylation by protein kinase A (PKA) and PKC, which increase the sensitivity of IP3Rs to ligand (Foskett et al. 2007). Alcohol exposure has been shown to affect PKA via an increase in Gαs levels and inhibition of Gαi activity (Nagy & DeSilva, 1992; Iles & Nagy, 1995), whilst a number of reports indicate an increase in expression or activity of PKC enzymes (DePetrillo & Liou, 1993; Coe et al. 1996; Newton & Messing, 2006). To determine whether chronic alcohol exposure affects the sensitivity of the total IP3R population, we compared Ca2+ responses induced by photorelease of caged IP3 in cultured hepatocytes from control and alcohol‐fed rats. Representative traces of [Ca2+]i transients elicited by photorelease of caged IP3 are shown in Fig. 8 A. Increasing the number of UV flashes increased the number of cells in which an increase in [Ca2+]i was observed in cells from both control and alcohol‐fed animals. Comparing the percentage of cells responding to one, two, three or four flashes of UV light revealed no shift in sensitivity of IP3 receptor activity in the absence of hormone challenge (Fig. 8 B). Moreover, comparison of the type of Ca2+ response, a more qualitative measure of IP3R activity, revealed no shift in the number of cells eliciting single Ca2+ transients, oscillatory responses or sustained increases in Ca2+ (Fig. 8 C–F). These data indicate the shift in hormone sensitivity induced by chronic alcohol feeding does not result from adaptive changes at the level of the IP3R Ca2+ release channels.
Figure 8. The sensitivity of IP3 receptors is unaffected by chronic alcohol feeding.

A, representative traces showing [Ca2+]i responses elicited by photorelease of caged IP3 in individual hepatocytes isolated from control (blue) and alcohol‐fed (red) rats. Arrows denote the time point and number of UV flash events. B, summary data showing the percentage of cells responding to the indicated number of UV pulses. Comparison of type of Ca2+ responses observed in hepatocytes from control and alcohol‐fed animals in response to uncaging of IP3 show no difference in the percentage of cells displaying with no response (C), single Ca2+ spikes (D), Ca2+ oscillations (E) or sustained Ca2+ increases (F). Data are mean ± SEM from ≤60 cells from three pairs of control and alcohol‐fed rats.
PLC activity is potentiated by chronic alcohol‐feeding
We next assessed whether changes in IP3 generation are responsible for the observed shift in hormone sensitivity after chronic alcohol feeding. VP‐dependent changes in IP3 mass were measured in overnight cultured hepatocytes from pair‐fed animals (Fig. 9 A and B). Maximal VP stimulation induced typical biphasic increases in IP3 mass in cultures from both control and alcohol‐fed rats (Fig. 9 A). Both the initial IP3 peak (30–60 s) and the IP3 levels during the sustained phase (5–10 min) were significantly potentiated in hepatocytes from alcohol‐fed rats (Fig. 9 B).
We also assessed the effect of chronic alcohol feeding on PLC activity by monitoring hormone‐dependent inositol phosphate generation. This assay was performed in the presence of lithium chloride to inhibit inositol monophosphate activity and amplify the accumulation of total inositol phosphates (IPx), which provides a relative readout of PLC activity. Both VP and ATP stimulation generated 2‐fold greater accumulation of total inositol phosphates in hepatocyte cultures from alcohol‐fed animals compared to controls (Fig. 9 C and D) and this effect was still evident after 120 days of alcohol feeding (Fig. 9 F). Dose dependency of the VP‐generated response revealed alcohol feeding dramatically increases the maximal response with a modest but statistically significant effect on EC50 concentration (Table 2). Hepatocyte cultures were also co‐transfected with yellow fluorescent protein (YFP)‐tagged and cyan fluorescent protein (CFP)‐tagged PLCδ4‐PH constructs to monitor PLC activity in real time (Bartlett et al. 2015). Data show that both submaximal VP and maximal ATP treatments stimulate larger increases in PLC activity in hepatocytes from alcohol‐fed rats compared to controls (Fig. 9 E).
We then considered the possibility that PLCδ enzymes, reportedly activated by Ca2+ (Allen et al. 1997), may be elevated or differentially recruited in hepatocytes from alcohol‐fed rats, providing a mechanism to selectively increase total PLC activity. Ca2+‐dependent PLC activity may arise as a consequence of Ca2+ release from the ER or may require large, local elevations in Ca2+ such as those generated by store‐operated Ca2+ influx. Removal of extracellular Ca2+ prior to hormone challenge or buffering intracellular Ca2+ levels (BAPTA‐AM; 30 min of pre‐incubation) resulted in a partial inhibition of total IPX accumulation in both control and alcohol‐fed preparations (Fig. 10 A). This is not an unexpected outcome as store‐operated Ca2+ influx is a fundamental process to maintain ER stores and Ca2+ positively regulates PLCβ activity. Ca2+ is therefore required to maintain hormone‐dependent IP3 generation. Importantly, however, despite the overall decrease in the IPx response, IPx levels in hepatocytes from alcohol‐fed rats remained 2‐fold elevated above control under all experimental conditions (Fig. 10 B). These data provide clear evidence that chronic alcohol feeding potentiates hormone‐dependent Ca2+ signalling at the level of receptor‐coupled PLC activity.
Figure 10. The effects of chronic alcohol feeding on PLC activity are not abolished by chelation of extra‐ and intracellular Ca2+ .

The Ca2+ sensitivity of PLC activity was assessed by comparing VP‐induced (100 nm) formation of inositol polyphosphates (IPx) in the absence of extracellular Ca2+ (nominal Ca2+) or in the presence of the intracellular Ca2+ chelator BAPTA‐AM (100 μm; 30 min pre‐incubation). A, analysis of hepatocytes isolated from control and alcohol‐fed rats revealed removal of extracellular Ca2+ and intracellular Ca2+ chelation attenuates PLC activity in both groups; however, VP‐induced IPx production remained significantly elevated in alcohol‐fed cells, paired Student's t test ★★ P ≤ 0.001, ★ P ≤ 0.05. Data are mean ± SEM from three pairs. B, comparison of the ratio between VP‐induced responses from control (Ct) and alcohol‐fed (Af) cells shows that Ca2+ chelation does not abolish the effects of chronic alcohol feeding on PLC activity.
Discussion
Chronic alcohol consumption is one of the leading causes of end‐stage liver disease. The acute toxic effects of alcohol and its metabolites on liver function are well established, whilst the long‐term adaptive changes which occur after chronic alcohol exposure and result in organ damage are not well defined. The current dogma in liver disease research, including ALD, proposes that multiple ‘hits’ or cellular stresses culminate to promote the progression of tissue injury from reversible hepatic steatosis to irreversible fibrosis, cirrhosis and in certain cases hepatocellular carcinoma (Ishak et al. 1991; Albano, 2008b; Gao & Bataller, 2011). Alcohol metabolism to its toxic metabolite acetaldehyde represents the initial hit directly decreasing the glutathione pool and increasing ROS formation; then other factors such as increases in proinflammatory cytokines and endotoxins have been implicated to induce secondary stresses (Hoek & Pastorino, 2004; Gao & Bataller, 2011). We postulate that the adaptive changes in Ca2+ signalling reported herein, which presumably arise to compensate for the acute inhibitory effect of alcohol exposure on PI‐PLC signalling, may produce additional cellular stresses in the form of prolonged mitochondrial Ca2+ increases and ROS production contributing to liver injury. Ca2+ responses generated by PI‐PLC‐linked hormones also fine‐tune gene transcription in hepatocytes to control processes such as gluconeogenesis, lipogenesis, cell proliferation and regeneration (Amaya & Nathanson, 2013; Bartlett et al. 2014). The alcohol‐dependent adaptive changes in Ca2+ signalling may profoundly alter gene expression profiles and may underlie some reported defects in liver regeneration (Dippold et al. 2012; Nilakantan et al. 2015) and the incidence of hepatocellular carcinoma in alcoholics (Ishak et al. 1991; Altamirano & Bataller, 2011; Gao & Bataller, 2011). Further understanding of the molecular changes induced by chronic alcohol which lead to potentiation of the Ca2+ signalling pathway may lead to novel therapeutic approaches.
In this study, we demonstrate that chronic alcohol consumption potentiates hormone‐dependent PI‐PLC signalling in the intact liver and isolated hepatocytes from alcohol‐fed rats. Importantly, this effect is observed upon activation of three different PI‐PLC‐coupled GPCRs and after ≤16 h of hepatocyte culture, demonstrating chronic alcohol‐dependent adaptation of the intracellular signalling cascade to generate Ca2+ signals. Significantly, we demonstrate an increase in PLC activity capable of driving a dramatic log shift in the VP concentration required to switch hepatocytes from hallmark oscillatory Ca2+ responses, known to regulate metabolism in the liver (Hajnóczky et al. 1995; Robb‐Gaspers et al. 1998b; Gaspers & Thomas, 2008), to saturated or sustained Ca2+ signals associated with mitochondrial Ca2+ overload and cellular damage (Rizzuto et al. 2012). Moreover, mitochondrially targeted ROS biosensors have revealed increases in mitochondrial superoxide and hydrogen peroxide levels in primary hepatocytes only after sustained hormone‐induced elevations in [Ca2+]i (Gaspers et al. 2012). We have also reported that mitochondrial Ca2+ levels and mitochondrial ROS formation are elevated in hepatocytes from alcohol‐fed rats compared to control (Wang et al. 2016). Importantly, hormone challenge selectively increased mitochondrial ROS levels in the alcohol group, providing support for our hypothesis that the chronic alcohol‐dependent shift in Ca2+ responses may increase oxidative damage and cell injury.
There are a number of consequences of increased mitochondrial Ca2+. Firstly, matrix Ca2+ increases electron transport chain flux driving ROS production and resulting in lipid peroxidation, formation of protein and DNA adducts. Secondly, the accumulation of high levels of Ca2+ by liver mitochondria can potently inhibit the low K m mitochondrial aldehyde dehydrogenase (Cederbaum & Rubin, 1977; Cederbaum, 1978), which is expected to prolong the clearance time of acetaldehyde after alcohol consumption. Thirdly, prolonged increases in mitochondrial Ca2+ can cause PTP opening, release of cytochrome C and apoptosis. Therefore, the liver is expected to be sensitized to injury by other cellular stresses such as elevated cytokines and endotoxins which are known to be increased by alcohol consumption (Lieber, 2000; Albano, 2008a,b).
It should be mentioned that a previous study reported chronic‐alcohol exposure significantly decreased hormone‐dependent Ca2+ signals in alcohol‐fed rats (Zhang et al. 1996a). Their study employed the same Lieber and DeCarli feeding paradigm, but used 16 weeks as the end point. We therefore felt it important to include data demonstrating that ethanol‐dependent potentiation of both hormone‐dependent Ca2+ signalling and inositol phosphate accumulation were maintained at 16 weeks (120 days) in our study. Our studies indicate that the effects of alcohol consumption on PI‐PLC signalling manifested after 4–6 weeks of feeding (data not shown) and were maintained for at least 16 weeks (see Table 2). It is possible that the adaptive effect of chronic alcohol exposure on PI‐PLC signalling is impaired as liver disease progresses, and genetic factors may account for differences in time frame as different rat strains were used in the former study. Indeed, ER stress and activation of the unfolded protein response (UPR), consequences of persistent and elevated ROS formation, could eventually result in reduced ER Ca2+ load and signalling capacity. However, our data, generated in two independent laboratories, demonstrate the observed shift in hormone‐dependent PLC activation is a robust and significant outcome of chronic alcohol consumption and may be a major contributing factor to ALD progression.
We first considered that post‐translation modification or increased expression of the IP3R channels may account for the alcohol‐induced shift in sensitivity to hormone. These channels integrate multiple signals to fine‐tune hormone‐dependent Ca2+ signalling (Patel et al. 2002; Bartlett et al. 2014) and dysregulation has been observed in other disease states (Harzheim et al. 2009; Kopil et al. 2012). Furthermore, oxidative damage and redox changes can sensitize IP3Rs, increasing their open probability and [Ca2+]i flux (Joseph, 2010; Bánsághi et al. 2014). In this study, we report no chronic modulation of IP3R sensitivity to ligand by photolysis of caged IP3 in cultured hepatocytes from pair‐fed rats. Furthermore, our data demonstrating a dramatic increase in PLC activity indicate the effects we report are upstream of this channel. Whilst we report no change in IP3R sensitivity after hepatocyte culture, it is possible that redox changes associated with alcohol metabolism or enhanced sensitivity to Gαs/i‐coupled hormones via PKA activity may affect IP3R function in vivo (Betzenhauser et al. 2009; Bánsághi et al. 2014). Therefore, we cannot rule out the possibility that modulation of IP3Rs by PKA phosphorylation or redox changes due to alcohol metabolism may contribute to the observed cellular adaptation and prolonged [Ca2+]i increases.
The effects of chronic alcohol consumption on hepatic calcium signalling appear to be discrete from those of diet‐induced steatosis. Diet‐induced obesity decreases ER Ca2+ store load (Fu et al. 2011) and store operated Ca2+ entry (SOCE) (Wilson et al. 2015) effects which are not recapitulated by chronic alcohol feeding. Furthermore, changes in IP3R expression (Feriod et al. 2014) and sensitivity to ligand (Wang et al. 2012) have been reported after feeding high‐fat diets and in animal models of diabetes. Together these data suggest that steatosis alone is not the common denominator in deregulating calcium signalling in liver. Thus, the shift in hormone sensitivity reported in this study results from an adaptive change in phosphoinositide turnover that is specific to chronic alcohol exposure. It is currently unknown how diet‐induced steatosis and alcohol‐induced fatty liver can produce distinct and sometimes opposite effects on hormone‐evoked calcium signalling. One potential explanation are the levels of inflammatory stress. Alcohol feeding of rodents induces little to no inflammation whereas animal models of diet‐induced obesity and diabetes are associated with chronic systemic inflammation.
Our biochemical measurement of IP3 mass and inositol phosphate accumulation clearly demonstrate that elevated IP3 underlies the enhanced hormone‐dependent Ca2+ signals in alcohol‐fed rat hepatocytes. We have previously shown that PLC‐mediated fluctuations in IP3 drive Ca2+ spiking and [Ca2+]i off rates are proportional to cellular [IP3] (Gaspers et al. 2014). Cellular adaptations that increase IP3 generation and/or decrease IP3 metabolism may account for the alcohol‐dependent potentiation of IP3 and PLC activity reported here. We detected no change in Gαq/11 or PLCβ levels; however, the increases in receptor‐coupled PLC activity may be due to enhanced access to G‐proteins or substrate. Alcohol has been shown to increase membrane fluidity in vitro and adaptive changes in membrane composition have been reported after chronic alcohol consumption (Sun & Sun, 1985; Hoek et al. 1988). It is possible therefore that alcohol increases PLC activity via G protein availability, substrate supply or simply access to phosphoinositide 4,5 bisphosphate due to changes in fluidity and membrane compartmentalization. However, this hypothesis does not readily account for the differential acute and chronic effects of alcohol.
The PKC family has been implicated in alcohol‐dependent modulation of the PI‐PLC signalling cascade (Slater et al. 1993; Domenicotti et al. 1998). Furthermore, changes in PKC expression and subcellular distribution have been reported after chronic ethanol exposure in various tissues (Hoek & Rubin, 1990; Narita et al. 2001). PKC‐mediated feedback inhibition of PLC activity is implicated in the acute inhibitory effects of alcohol on PI‐PLC‐dependent signalling, whilst we demonstrate that a tolerance to this inhibition occurs after chronic alcohol feeding in the intact liver (Fig. 5). Ca2+ oscillations in hepatocytes are modified both positively and negatively by PKC, presumably by different PKC isoforms (Sanchez‐Bueno et al. 1990; Bartlett et al. 2015). Negative regulation of IP3 generation may occur via PKC‐dependent phosphorylation of GPCRs and PLC (Strassheim & Williams, 2000; Nash et al. 2001; Bartlett et al. 2015) whereas positive regulation can occur through inhibition of IP3 kinase (Woodring & Garrison, 1997). The isoform specificity of these effects has yet to be elucidated but the role of PKC in dynamically regulating Ca2+ signalling is well accepted. It is possible that chronic alcohol consumption may alter specific PKC expression, activity and/or subcellular targeting in hepatocytes to decrease negative regulation and/or increase positive regulation of IP3 and account for the observed effects on Ca2+ signals and spike kinetics (Table 3). Hepatocytes display agonist‐specific shaped [Ca2+]i spikes due primarily to differences in the decay rates of the [Ca2+]i spike. The duration of the Ca2+ response is presumably integral to the molecular decoding by downstream Ca2+‐sensitive targets to differentially regulate metabolism and gene expression from multiple cellular inputs (Bartlett et al. 2014). Hence, our observation that chronic alcohol consumption increases PLC activity and prolongs the Ca2+ spike width has implications in terms of the downstream signalling cascades activated by individual hormones. Further work is required to determine the protein targets of specific PKC enzymes and the effect of chronic alcohol on these PKC expression levels and activity in the liver.
The hyper‐sensitivity of hepatocytes from alcohol‐fed rats to PI‐PLC‐linked GPCRs we report in this study clearly has wide reaching effects on organ function and dysfunction. In fact the increased efficacy in hormone‐generated [Ca2+]i is more significant when considering the enhanced level of circulating catecholamines induced by alcohol in human subjects and in alcoholic patients (Randin et al. 1995; Parlesak et al. 2004). We demonstrate increased IP3 levels underlie the elevated Ca2+ signals observed in alcohol‐fed hepatocytes and significantly cause a robust sensitivity shift leading to sustained Ca2+ elevations at physiological hormone levels that typically produce oscillatory [Ca2+]i patterns in control cells. Moreover, we have previously shown sustained [Ca2+]i increases are mediators of mitochondrial superoxide and hydrogen peroxide generation (Gaspers et al. 2012) and calcium‐induced ROS production is increased in alcohol‐fed rat hepatocytes (Wang et al. 2016). Additionally, the dysregulation of Ca2+ signalling is emerging as a underlying factor in tumorigenic progression and metastasis (Stewart et al. 2015), and may underlie the development of hepatocellular carcinoma in alcoholics. Importantly, this report identifies a novel adaptation of hormone‐dependent Ca2+ signalling induced by chronic alcohol consumption. Further understanding of the molecular changes in the Ca2+ signalling pathway induced by chronic alcohol may lead to insight into disease progression and the development of novel therapeutic approaches for treatment.
Additional information
Conflict of interest
The authors have declared that no conflict of interest exists.
Author contributions
LDG conceived and designed the study. LDG and PJB designed experiments. PJB, LDG, AA, AN, VLP, MH and LC performed experiments and analysed the data. PJB, AA and VLP performed experiments in the laboratory of LDG. AN performed experiments in the laboratory of JBH. MH performed experiments in the laboratory of LC. PJB wrote the manuscript. LDG, JBH and LC reviewed and edited the manuscript. All authors critically reviewed the results and approved the final version of the manuscript and agree to be accountable for all aspects of the work. All persons designated as authors qualify for authorship.
Funding
This work was supported by NIAAA grants AA017752 (LDG) and AA018873 (JBH).
Acknowledgements
We thank Dr T. Balla (NIH, USA) for PLCδ4PH constructs, Dr A. Palmer (University of Colorado, USA) for LynD3cpv cDNA, Dr J. Lytton (University of Calgary, Canada) for the SERCA antibody and Dr Stevenson (University of Alberta, Canada) for the ZO‐1 antibody. We thank Luke Fritzky (NJMS Rutgers, Histology Core Facility) for his assistance in carrying out the liver histology studies and Drs D. and J. Pain for their assistance in assessing mitochondrial aconitase activity.
Linked articles This article is highlighted by a Perspective by Iwakiri & Nathanson. To read this Perspective, visit http://doi.org/10.1113/JP274133.
References
- Abou Hashieh I, Mathieu S, Besson F & Gerolami A (1996). Inhibition of gap junction intercellular communications of cultured rat hepatocytes by ethanol: role of ethanol metabolism. J Hepatol 24, 360–367. [DOI] [PubMed] [Google Scholar]
- Albano E (2008a). New concepts in the pathogenesis of alcoholic liver disease. Expert Rev Gastroenterol Hepatol 2, 749–759. [DOI] [PubMed] [Google Scholar]
- Albano E (2008b). Oxidative mechanisms in the pathogenesis of alcoholic liver disease. Mol Aspects Med 29, 9–16. [DOI] [PubMed] [Google Scholar]
- Allen V, Swigart P, Cheung R, Cockcroft S & Katan M (1997). Regulation of inositol lipid‐specific phospholipase Cδ by changes in Ca2+ ion concentrations. Biochem J 327, 545–552. [DOI] [PMC free article] [PubMed] [Google Scholar]
- Altamirano J & Bataller R (2011). Alcoholic liver disease: pathogenesis and new targets for therapy. Nat Rev Gastroenterol Hepatol 8, 491–501. [DOI] [PubMed] [Google Scholar]
- Amaya MJ & Nathanson MH (2013). Calcium signaling in the liver In Comprehensive Physiology, pp. 515–539. John Wiley & Sons, Inc, New York. [DOI] [PMC free article] [PubMed] [Google Scholar]
- Bánsághi S, Golenár T, Madesh M, Csordás G, RamachandraRao S, Sharma K, Yule DI, Joseph SK & Hajnóczky G (2014). Isoform‐ and species‐specific control of inositol 1,4,5‐trisphosphate (IP3) receptors by reactive oxygen species. J Biol Chem 289, 8170–8181. [DOI] [PMC free article] [PubMed] [Google Scholar]
- Bartlett PJ, Gaspers LD, Pierobon N & Thomas AP (2014). Calcium‐dependent regulation of glucose homeostasis in the liver. Cell Calcium 55, 306–316. [DOI] [PubMed] [Google Scholar]
- Bartlett PJ, Metzger W, Gaspers LD & Thomas AP (2015). Differential regulation of multiple steps in inositol 1,4,5‐ trisphosphate signaling by protein kinase C shapes hormone‐stimulated Ca2+ oscillations. J Biol Chem 290, 18519–18533. [DOI] [PMC free article] [PubMed] [Google Scholar]
- Baumgartner HK, Gerasimenko JV, Thorne C, Ferdek P, Pozzan T, Tepikin AV, Petersen OH, Sutton R, Watson AJM & Gerasimenko OV (2009). Calcium elevation in mitochondria is the main Ca2+ requirement for mitochondrial permeability transition pore (mPTP) opening. J Biol Chem 284, 20796–20803. [DOI] [PMC free article] [PubMed] [Google Scholar]
- Berridge MJ, Downes CP & Hanley MR (1982). Lithium amplifies agonist‐dependent phosphatidylinositol responses in brain and salivary glands. Biochem J 206, 587–595. [DOI] [PMC free article] [PubMed] [Google Scholar]
- Betzenhauser MJ, Fike JL, Wagner LE & Yule DI (2009). Protein kinase A increases type‐2 inositol 1,4,5‐trisphosphate receptor activity by phosphorylation of serine 937. J Biol Chem 284, 25116–25125. [DOI] [PMC free article] [PubMed] [Google Scholar]
- Bredt DS, Mourey RJ & Snyder SH (1989). A simple, sensitive, and specific radioreceptor assay for inositol 1,4,5‐trisphosphate in biological tissues. Biochem Biophys Res Commun 159, 976–982. [DOI] [PubMed] [Google Scholar]
- Brookes PS, Yoon Y, Robotham JL, Anders MW & Sheu SS (2004). Calcium, ATP, and ROS: a mitochondrial love‐hate triangle. Am J Physiol Cell Physiol 287, C817–833. [DOI] [PubMed] [Google Scholar]
- Cederbaum AI (1978). The effect of calcium on the oxidation of acetaldehyde by rat liver mitochondria. Life Sci 22, 111–125. [DOI] [PubMed] [Google Scholar]
- Cederbaum AI & Rubin E (1977). The oxidation of acetaldehyde by isolated mitochondria from various organs of the rat and hepatocellular carcinoma. Arch Biochem Biophys 179, 46–66. [DOI] [PubMed] [Google Scholar]
- Coe IR, Yao L, Diamond I & Gordon AS (1996). The role of protein kinase C in cellular tolerance to ethanol. J Biol Chem 271, 29468–29472. [DOI] [PubMed] [Google Scholar]
- . de la M Hall P , Lieber CS, DeCarli LM, French SW, Lindros KO, Jarvelainen H, Bode C, Parlesak A & Bode JC (2001). Models of alcoholic liver disease in rodents: a critical evaluation. Alcohol Clin Exp Res 25, 254S–261S. [DOI] [PubMed] [Google Scholar]
- DePetrillo PB & Liou CS (1993). Ethanol exposure increases total protein kinase C activity in human lymphocytes. Alcohol Clin Exp Res 17, 351–354. [DOI] [PubMed] [Google Scholar]
- Dippold RP, Vadigepalli R, Gonye GE & Hoek JB (2012). Chronic ethanol feeding enhances miR‐21 induction during liver regeneration while inhibiting proliferation in rats. Am J Physiol Gastrointest Liver Physiol 303,G733–G743. [DOI] [PMC free article] [PubMed] [Google Scholar]
- Domenicotti C, Paola D, Vitali A, Nitti M, Cottalasso D, Melloni E, Poli G, Marinari UM & Pronzato MA (1998). Mechanisms of inactivation of hepatocyte protein kinase C isoforms following acute ethanol treatment. Free Radic Biol Med 25, 529–535. [DOI] [PubMed] [Google Scholar]
- Feriod CN, Nguyen L, Jurczak MJ, Kruglov EA, Nathanson MH, Shulman GI, Bennett AM & Ehrlich BE (2014). Inositol 1,4,5‐trisphosphate receptor type II (InsP3R‐II) is reduced in obese mice, but metabolic homeostasis is preserved in mice lacking InsP3R‐II. Am J Physiol Endocrinol Metab 307, E1057–E1064. [DOI] [PMC free article] [PubMed] [Google Scholar]
- Flint DH, Tuminello JF & Emptage MH (1993). The inactivation of Fe–S cluster containing hydro‐lyases by superoxide. J Biol Chem 268, 22369–22376. [PubMed] [Google Scholar]
- Foskett JK, White C, Cheung KH & Mak DO (2007). Inositol trisphosphate receptor Ca2+ release channels. Physiol Rev 87, 593–658. [DOI] [PMC free article] [PubMed] [Google Scholar]
- Fu S, Yang L, Li P, Hofmann O, Dicker L, Hide W, Lin X, Watkins SM, Ivanov AR & Hotamisligil GS (2011). Aberrant lipid metabolism disrupts calcium homeostasis causing liver endoplasmic reticulum stress in obesity. Nature 473, 528–531. [DOI] [PMC free article] [PubMed] [Google Scholar]
- Gao B & Bataller R (2011). Alcoholic liver disease: pathogenesis and new therapeutic targets. Gastroenterology 141, 1572–1585. [DOI] [PMC free article] [PubMed] [Google Scholar]
- Gaspers LD, Bartlett PJ, Politi A, Burnett P, Metzger W, Johnston J, Joseph SK, Hofer T & Thomas AP (2014). Hormone‐induced calcium oscillations depend on cross‐coupling with inositol 1,4,5‐trisphosphate oscillations. Cell Rep 9, 1209–1218. [DOI] [PMC free article] [PubMed] [Google Scholar]
- Gaspers LD, Memin E & Thomas AP (2012). Calcium‐dependent physiologic and pathologic stimulus‐metabolic response coupling in hepatocytes. Cell Calcium 52, 93–102. [DOI] [PMC free article] [PubMed] [Google Scholar]
- Gaspers LD & Thomas AP (2005). Calcium signaling in liver. Cell Calcium 38, 329–342. [DOI] [PubMed] [Google Scholar]
- Gaspers LD & Thomas AP (2008). Calcium‐dependent activation of mitochondrial metabolism in mammalian cells. Methods 46, 224–232. [DOI] [PMC free article] [PubMed] [Google Scholar]
- Grundy D (2015). Principles and standards for reporting animal experiments in The Journal of Physiology and Experimental Physiology . J Physiol 593, 2547–2549. [DOI] [PMC free article] [PubMed] [Google Scholar]
- Hajnóczky G, Robb‐Gaspers LD, Seitz MB & Thomas AP (1995). Decoding of cytosolic calcium oscillations in the mitochondria. Cell 82, 415–424. [DOI] [PubMed] [Google Scholar]
- Harzheim D, Movassagh M, Foo RS‐Y, Ritter O, Tashfeen A, Conway SJ, Bootman MD & Roderick HL (2009). Increased InsP3Rs in the junctional sarcoplasmic reticulum augment Ca2+ transients and arrhythmias associated with cardiac hypertrophy. Proc Natl Acad Sci USA 106, 11406–11411. [DOI] [PMC free article] [PubMed] [Google Scholar]
- Hernandez E, Leite MF, Guerra MT, Kruglov EA, Bruna‐Romero O, Rodrigues MA, Gomes DA, Giordano FJ, Dranoff JA & Nathanson MH (2007). The spatial distribution of inositol 1,4,5‐trisphosphate receptor isoforms shapes Ca2+ waves. J Biol Chem 282, 10057–10067. [DOI] [PMC free article] [PubMed] [Google Scholar]
- Higashi K & Hoek JB (1991). Ethanol causes desensitization of receptor‐mediated phospholipase C activation in isolated hepatocytes. J Biol Chem 266, 2178–2190. [PubMed] [Google Scholar]
- Hirata K, Pusl T, O'Neill AF, Dranoff JA & Nathanson MH (2002). The type II inositol 1,4,5‐trisphosphate receptor can trigger Ca2+ waves in rat hepatocytes. Gastroenterology 122, 1088–1100. [DOI] [PubMed] [Google Scholar]
- Hoek JB, Nomura T & Higashi K (1993). Ethanol and phospholipid dependent signal transduction: the view form the liver In Alcohol, Cell Membranes, and Signal Transduction in Brain, ed. Alling C, Diamond I, Leslie SW, Sun GY & Wood WG. pp. 219–233. Plenum Press, New York. [Google Scholar]
- Hoek JB & Pastorino JG (2004). Cellular signaling mechanisms in alcohol‐induced liver damage. Semin Liver Dis 24, 257–272. [DOI] [PubMed] [Google Scholar]
- Hoek JB & Rubin E (1990). Alcohol and membrane‐associated signal transduction. Alcohol Alcohol 25, 143–156. [DOI] [PubMed] [Google Scholar]
- Hoek JB, Taraschi TF, Higashi K, Rubin E & Thomas AP (1990). Phospholipase C activation by ethanol in rat hepatocytes is unaffected by chronic ethanol feeding. Biochem J 272, 59–64. [DOI] [PMC free article] [PubMed] [Google Scholar]
- Hoek JB, Taraschi TF & Rubin E (1988). Functional implications of the interaction of ethanol with biologic membranes: actions of ethanol on hormonal signal transduction systems. Semin Liver Dis 8, 36–46. [DOI] [PubMed] [Google Scholar]
- Hoek JB, Thomas AP, Rooney TA, Higashi K & Rubin E (1992). Ethanol and signal transduction in the liver. FASEB J 6, 2386–2396. [PubMed] [Google Scholar]
- Hoek JB, Thomas AP, Rubin R & Rubin E (1987). Ethanol‐induced mobilization of calcium by activation of phosphoinositide‐specific phospholipase C in intact hepatocytes. J Biol Chem 262, 682–691. [PubMed] [Google Scholar]
- Iles KE & Nagy LE (1995). Chronic ethanol feeding increases the quantity of Gαs‐protein in rat liver plasma membranes. Hepatology 21, 1154–1160. [PubMed] [Google Scholar]
- Ishak KG, Zimmerman HJ & Ray MB (1991). Alcoholic liver disease: pathologic, pathogenetic and clinical aspects. Alcohol Clin Exp Res 15, 45–66. [DOI] [PubMed] [Google Scholar]
- Joseph SK (2010). Role of Thiols in the structure and function of inositol trisphosphate receptors In Current Topics in Membranes, ed. Serysheva I, pp. 299–322. Elsevier Academic Press, New York. [DOI] [PubMed] [Google Scholar]
- Koop DR (2006). Alcohol metabolism's damaging effects on the cell: a focus on reactive oxygen generation by the enzyme cytochrome P450 2E1. Alcohol Res Health 29, 274–280. [PMC free article] [PubMed] [Google Scholar]
- Kopil CM, Siebert AP, Kevin Foskett J & Neumar RW (2012). Calpain‐cleaved type 1 inositol 1,4,5‐trisphosphate receptor impairs ER Ca2+ buffering and causes neurodegeneration in primary cortical neurons. J Neurochem 123, 147–158. [DOI] [PMC free article] [PubMed] [Google Scholar]
- Leo MA & Lieber CS (1983). Hepatic fibrosis after long‐term administration of ethanol and moderate vitamin A supplementation in the rat. Hepatology 3, 1–11. [DOI] [PubMed] [Google Scholar]
- Lieber CS (2000). Alcoholic liver disease: new insights in pathogenesis lead to new treatments. J Hepatol 32, 113–128. [DOI] [PubMed] [Google Scholar]
- Lieber CS & DeCarli LM (1989). Liquid diet technique of ethanol administration: 1989 update. Alcohol Alcohol 24, 197–211. [PubMed] [Google Scholar]
- Marcinkeviciute A, Mildaziene V, Crumm S, Demin O, Hoek JB & Kholodenko B (2000). Kinetics and control of oxidative phosphorylation in rat liver mitochondria after chronic ethanol feeding. Biochem J 349, 519–526. [DOI] [PMC free article] [PubMed] [Google Scholar]
- McCormack JG & Denton RM (1990). Intracellular calcium ions and intramitochondrial Ca2+ in the regulation of energy metabolism in mammalian tissues. Proc Nutr Soc 49, 57–75. [DOI] [PubMed] [Google Scholar]
- Murphy MP (2009). How mitochondria produce reactive oxygen species. Biochem J 417, 1–13. [DOI] [PMC free article] [PubMed] [Google Scholar]
- Nagy LE & DeSilva SE (1992). Ethanol increases receptor‐dependent cyclic AMP production in cultured hepatocytes by decreasing Gi‐mediated inhibition. Biochem J 286, 681–686. [DOI] [PMC free article] [PubMed] [Google Scholar]
- Narita M, Tamaki H, Kobayashi M, Soma M, Narita M & Suzuki T (2001). Changes in Ca2+‐dependent protein kinase C isoforms induced by chronic ethanol treatment in mice. Neurosci Lett 307, 85–88. [DOI] [PubMed] [Google Scholar]
- Nash MS, Young KW, Challiss RA & Nahorski SR (2001). Intracellular signalling. Receptor‐specific messenger oscillations. Nature 413, 381–382. [DOI] [PubMed] [Google Scholar]
- Newton PM & Messing RO (2006). Intracellular signaling pathways that regulate behavioral responses to ethanol. Pharmacol Ther 109, 227–237. [DOI] [PubMed] [Google Scholar]
- Nilakantan H, Kuttippurathu L, Parrish A, Hoek JB & Vadigepalli R (2015). In vivo zonal variation and liver cell‐type specific NF‐κB localization after chronic adaptation to ethanol and following partial hepatectomy. PLoS ONE 10, e0140236. [DOI] [PMC free article] [PubMed] [Google Scholar]
- Palmer AE, Giacomello M, Kortemme T, Hires SA, Lev‐Ram V, Baker D & Tsien RY (2006). Ca2+ indicators based on computationally redesigned calmodulin‐peptide pairs. Chem Biol 13, 521–530. [DOI] [PubMed] [Google Scholar]
- Parlesak A, Reisenauer C, Biermann J, Ratge D, Bode JC & Bode C (2004). Reversibility of increased formation of catecholamines in patients with alcoholic liver disease. Scand J Gastroenterol 39, 60–66. [DOI] [PubMed] [Google Scholar]
- Pastorino JG & Hoek JB (2000). Ethanol potentiates tumor necrosis factor‐α cytotoxicity in hepatoma cells and primary rat hepatocytes by promoting induction of the mitochondrial permeability transition. Hepatology 31, 1141–1152. [DOI] [PubMed] [Google Scholar]
- Patel S, Gaspers LD, Boucherie S, Memin E, Stellato KA, Guillon G, Combettes L & Thomas AP (2002). Inducible nitric‐oxide synthase attenuates vasopressin‐dependent Ca2+ signaling in rat hepatocytes. J Biol Chem 277, 33776–33782. [DOI] [PubMed] [Google Scholar]
- Patel S, Robb‐Gaspers LD, Stellato KA, Shon M & Thomas AP (1999). Coordination of calcium signalling by endothelial‐derived nitric oxide in the intact liver. Nat Cell Biol 1, 467–471. [DOI] [PubMed] [Google Scholar]
- Ramirez T, Tong M, Chen WC, Nguyen Q‐G, Wands JR & de la Monte SM (2013). Chronic alcohol‐induced hepatic insulin resistance and endoplasmic reticulum stress ameliorated by peroxisome‐proliferator activated receptor‐δ agonist treatment. Eur J Gastroenterol Hepatol 28, 179–187. [DOI] [PMC free article] [PubMed] [Google Scholar]
- Randin D, Vollenweider P, Tappy L, Jéquier E, Nicod P & Scherrer U (1995). Suppression of alcohol‐induced hypertension by dexamethasone. N Engl J Med 332, 1733–1738. [DOI] [PubMed] [Google Scholar]
- Rizzuto R, De Stefani D, Raffaello A & Mammucari C (2012). Mitochondria as sensors and regulators of calcium signalling. Nat Rev Mol Cell Biol 13, 566–578. [DOI] [PubMed] [Google Scholar]
- Robb‐Gaspers LD, Burnett P, Rutter GA, Denton RM, Rizzuto R & Thomas AP (1998a). Integrating cytosolic calcium signals into mitochondrial metabolic responses. EMBO J 17, 4987–5000. [DOI] [PMC free article] [PubMed] [Google Scholar]
- Robb‐Gaspers LD, Burnett P, Rutter GA, Denton RM, Rizzuto R & Thomas AP (1998b). Integrating cytosolic calcium signals into mitochondrial metabolic responses. EMBO J 17, 4987–5000. [DOI] [PMC free article] [PubMed] [Google Scholar]
- Robb‐Gaspers LD & Thomas AP (1995a). Coordination of Ca2+ signaling by intercellular propagation of Ca2+ waves in the intact liver. J Biol Chem 270, 8102–8107. [DOI] [PubMed] [Google Scholar]
- Robb‐Gaspers LD & Thomas AP (1995b). Coordination of Ca signaling by intercellular propagation of Ca waves in the intact liver. J Biol Chem 270, 8102–8107. [DOI] [PubMed] [Google Scholar]
- Rooney TA, Hager R, Rubin E & Thomas AP (1989a). Short chain alcohols activate guanine nucleotide‐dependent phosphoinositidase C in turkey erythrocyte membranes. J Biol Chem 264, 6817–6822. [PubMed] [Google Scholar]
- Rooney TA, Renard DC, Sass EJ & Thomas AP (1991). Oscillatory cytosolic calcium waves independent of stimulated inositol 1,4,5‐trisphosphate formation in hepatocytes. J Biol Chem 266, 12272–12282. [PubMed] [Google Scholar]
- Rooney TA, Sass EJ & Thomas AP (1989b). Characterization of cytosolic calcium oscillations induced by phenylephrine and vasopressin in single fura‐2‐loaded hepatocytes. J Biol Chem 264, 17131–17141. [PubMed] [Google Scholar]
- Salmon DM & Flatt JP (1985). Effect of dietary fat content on the incidence of obesity among ad libitum fed mice. Int J Obes 9, 443–449. [PubMed] [Google Scholar]
- Sanchez‐Bueno A, Dixon CJ, Woods NM, Cuthbertson KS & Cobbold PH (1990). Inhibitors of protein kinase C prolong the falling phase of each free‐calcium transient in a hormone‐stimulated hepatocyte. Biochem J 268, 627–632. [DOI] [PMC free article] [PubMed] [Google Scholar]
- Santulli G, Xie W, Reiken SR & Marks AR (2015). Mitochondrial calcium overload is a key determinant in heart failure. Proc Natl Acad Sci USA 112, 11389–11394. [DOI] [PMC free article] [PubMed] [Google Scholar]
- Slater SJ, Cox KJA, Lombardi JV, Ho C, Keily MB, Rubin E & Stubbs CD (1993). Inhibition of protein kinase C by alcohols and anaesthetics. Nature 364, 82–84. [DOI] [PubMed] [Google Scholar]
- Smith TL, Vickers AE, Brendel K & Yamamura HI (1983). Influence of chronic ethanol treatment on α1 adrenergic and vasopressin receptor‐stimulated phosphatidylinositol synthesis in isolated rat hepatocytes. Biochem Pharmacol 32, 3059–3062. [DOI] [PubMed] [Google Scholar]
- Stewart TA, Yapa KTDS & Monteith GR (2015). Altered calcium signaling in cancer cells. Biochim BiophysActa 1848, 2502–2511. [DOI] [PubMed] [Google Scholar]
- Strassheim D & Williams CL (2000). P2Y2 purinergic and M3 muscarinic acetylcholine receptors activate different phospholipase C‐β isoforms that are uniquely susceptible to protein kinase C‐dependent phosphorylation and inactivation. J Biol Chem 275, 39767–39772. [DOI] [PubMed] [Google Scholar]
- Sun GY & Sun AY (1985). Ethanol and membrane lipids. Alcohol Clin Exp Res 9, 164–180. [DOI] [PubMed] [Google Scholar]
- Thomas AP, Bird GS, Hajnoczky G, Robb‐Gaspers LD & Putney JW Jr (1996). Spatial and temporal aspects of cellular calcium signaling. FASEB J 10, 1505–1517. [PubMed] [Google Scholar]
- Tong W‐H & Rouault TA (2006). Functions of mitochondrial ISCU and cytosolic ISCU in mammalian iron‐sulfur cluster biogenesis and iron homeostasis. Cell Metab 3, 199–210. [DOI] [PubMed] [Google Scholar]
- Wang G, Memin E, Murali I & Gaspers LD (2016). The effect of chronic alcohol consumption on mitochondrial calcium handling in hepatocytes. Biochem J 473, 3903–3921. [DOI] [PMC free article] [PubMed] [Google Scholar]
- Wang Y, Li G, Goode J, Paz JC, Ouyang K, Screaton R, Fischer WH, Chen J, Tabas I & Montminy M (2012). Inositol‐1,4,5‐trisphosphate receptor regulates hepatic gluconeogenesis in fasting and diabetes. Nature 485, 128–132. [DOI] [PMC free article] [PubMed] [Google Scholar]
- Wilson Claire H, Ali Eunüs S, Scrimgeour N, Martin Alyce M, Hua J, Tallis George A, Rychkov Grigori Y & Barritt Greg J (2015). Steatosis inhibits liver cell store‐operated Ca2+ entry and reduces ER Ca2+ through a protein kinase C‐dependent mechanism. Biochem J 466, 379–390. [DOI] [PubMed] [Google Scholar]
- Woodring PJ & Garrison JC (1997). Expression, purification, and regulation of two isoforms of the inositol 1,4,5‐trisphosphate 3‐kinase. J Biol Chem 272, 30447–30454. [DOI] [PubMed] [Google Scholar]
- Zhang BH & Farrell GC (1997). Ethanol perturbs receptor‐operated cytosolic free calcium concentration signals in cultured rat hepatocytes. Gastroenterology 113, 641–648. [DOI] [PubMed] [Google Scholar]
- Zhang BH, Hornsfield BP & Farrell GC (1996a). Chronic ethanol administration to rats decreases receptor‐operated mobilization of intracellular ionic calcium in cultured hepatocytes and inhibits 1,4,5‐inositol trisphosphate production: relevance to impaired liver regeneration. J Clin Invest 98, 1237–1244. [DOI] [PMC free article] [PubMed] [Google Scholar]
- Zhang BH, Hornsfield BP & Farrell GC (1996b). Chronic ethanol administration to rats decreases receptor‐operated mobilization of intracellular ionic calcium in cultured hepatocytes and inhibits 1,4,5‐inositol trisphosphate production: relevance to impaired liver regeneration. J Clin Invest 98, 1237–1244. [DOI] [PMC free article] [PubMed] [Google Scholar]