Abstract
Human bone marrow-derived mesenchymal stem cells (hBM-MSCs) have been studied for their therapeutic potential. However, evaluating the quality of hBM-MSCs before transplantation remains a challenge. We addressed this issue in the present study by investigating deformation, the expression of genes related to reactive oxygen species (ROS) generation, changes in amino acid profiles, and membrane fluidity in hBM-MSCs. Deformability and cell size were decreased after storage for 6 and 12 h, respectively, in phosphate-buffered saline. Intracellular ROS levels also increased over time, which was associated with altered expression of genes related to ROS generation and amino acid metabolism. Membrane fluidity measurements revealed higher Laurdan generalized polarization values at 6 and 12 h; however, this effect was reversed by N-acetyl-l-cysteine-treatment. These findings indicate that the quality and freshness of hBM-MSCs is lost over time after dissociation from the culture dish for transplantation, highlighting the importance of using freshly trypsinized cells in clinical applications.
Introduction
Mesenchymal stem cells (MSCs) have potential applications in stem cell therapy for the treatment of myocardial infarction, spinal cord injury, ischemic diseases, and neurodegenerative disorders1, 2. In particular, bone marrow-derived (BM-)MSCs are readily obtained and have favorable characteristics such as a high degree of plasticity, immunosuppressive activity, and ease of handling in vitro 3. Human (h)BM-MSCs are considered a promising clinical tool for the treatment of myocardial infarction, ischemic stroke, multiple system atrophy, and alcoholic cirrhosis4–7.
About 100 million autologous hBM-MSCs cultured in dishes are required for transplantation4–6. It is imperative that the quality and freshness of the cells be preserved prior to transplantation by minimizing stress and damage8. However, after dissociation from the culture dish, hBM-MSCs are serum-starved before transplantation into patients8–10, which can cause stress to the cells. In our previous study, we found that gene expression levels were perturbed and the rate of cell death was increased in hBM-MSCs over time8.
Cell deformability is a label-free biomarker used to assess various cell conditions such as metastatic potential, cell cycle stage, degree of differentiation, and leukocyte activation; it reflects physical changes in cellular components including the membrane, cytoskeleton, and nucleus11. For instance, the deformability of red blood cells (RBCs) in patients suffering from sickle-cell disease, malaria, or diabetes differs from that of healthy cells12. Moreover, oxidative stress and lipid peroxidation reduce RBC deformability by disrupting the cell membrane13. Deformability, which can be measured using microfluidics approach, is used as a criterion for evaluating the quality of hBM-MSCs; indeed, it was found to be significantly reduced by storage for 24 h in phosphate-buffered saline (PBS)14. However, it is unknown how cellular damage alters cell deformability. We previously showed that at earlier time points—i.e., after 6 or 12 h in PBS—the viability and deformability of hBM-MSCs were reduced and cell morphology and gene expression were altered8.
Amino acid profiling can provide information on perturbations in cellular homeostasis, including activation of apoptosis and the immune response and generation of reactive oxygen species (ROS)15. Amino acids are converted to organic acid via glucogenic and ketogenic pathways and are closely linked to energy generation in mitochondria through the tricarboxylic acid cycle16. Amino acid profiling in hBM-MSCs can reveal cellular responses to malnutrition resulting from reduced proteasomal activity as well as the use of amino acids as an energy source15.
Polyunsaturated phospholipids, glycolipids, and cholesterol are targets of ROS in the peroxidation of plasma membrane lipids17. Oxidative cleavage of polyunsaturated phospholipids generates malondialdehyde, acrolein, and 4-hydroxynonenal as by-products18 and depletes unsaturated phospholipid and cholesterol in the membrane, leading to loss of membrane fluidity and permeability19 that can affect physiological functions20.
Loss of membrane fluidity is an indicator of membrane dysfunction. Several studies have reported that membrane fluidity is decreased by lipid peroxidation19, 21. Fluidity can be measured using Laurdan, a polarity-sensitive membrane probe that exhibits a 60-nm spectral shift from disordered to ordered bilayer phases22. However, the relationship between cell deformability and membrane fluidity remains poorly understood, despite the fact that these characteristics provide critical information on the quality of cells, including stem cells.
In this study, we investigated changes in hBM-MSC deformability by microfluidic-based measures of cell stretching. In addition, we examined alterations in gene expression and amino acid profiles, ROS generation, and changes in membrane fluidity in cells maintained in PBS for short periods. Our results suggest that the quality of hBM-MSCs decreases over time, which should be taken into consideration when these cells are used for therapeutic applications.
Results
hBM-MSCs deformability and cell size decrease over time
The change in the deformability of hBM-MSCs was measured hourly for 12 h by microfluidics. Deformability decreased over time, with a significant difference at 6 and 12 h relative to the 0 h time point (Fig. 1a,b and Supplementary Fig. 1). Cell size also decreased over time, with a significant difference observed at 12 h (Fig. 1a,c).
Figure 1.
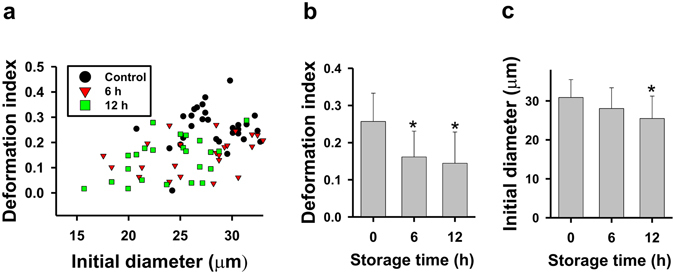
Changes in deformability and cell size of hBM-MSCs stored in PBS. (a,b) Cell deformability and (a,c) cell size were measured using a four-walled polydimethoxysilane microfluidic device at a flow rate of 160 μl/h. Data represent mean ± SD (N > 20). *P < 0.05 vs. 0 h (control).
Expression of ROS-related genes and ROS generation change over time in hBM-MSCs
The expression of 24 ROS-related genes in hBM-MSCs was altered after 6 and 12 h of culture in PBS (Supplementary Table 1). Ingenuity Pathway Analysis (IPA) was used to evaluate the relationships between genes based on microarray data. The levels of genes related to ROS generation were significantly altered (Fig. 2a): semi-quantitative reverse transcription (RT-)PCR (Fig. 2b and Supplementary Fig. 2) and quantitative real-time (q)PCR (Fig. 2c) analyses revealed that V-akt murine thymoma viral oncogene homolog 2 (AKT2), mitogen-activated protein kinase kinase kinase 2 (MAP3K2), and phosphoinositide-3-kinase regulatory subunit 1α (PIK3R1) were downregulated whereas Forkhead box O3 (FOXO3) and KH domain-containing, RNA-binding, signal transduction-associated 1 (KHDRBS1) were upregulated after 12 h. We also assessed intracellular ROS generation in hBM-MSCs over time by 2′,7′-dichlorodihydrofluorescin diacetate (DCFH-DA) staining. ROS levels increased after 6 and 12 h in PBS, an effect that was inhibited in the presence of the ROS scavenger N-acetyl-l-cysteine (NAC) (Fig. 2d).
Figure 2.
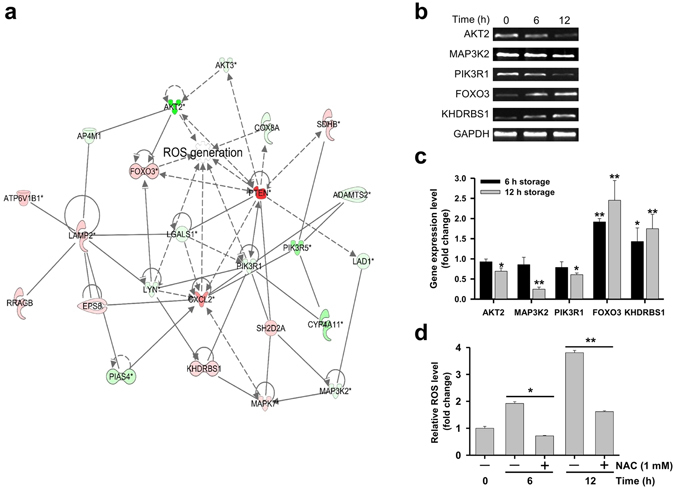
Changes in ROS-related gene expression and ROS generation in hBM-MSCs over time. (a) An ROS-related gene network was constructed algorithmically by IPA. Red and green areas indicate up- and downregulated genes, respectively. Differentially expressed genes were identified by microarray analysis without fold-change cut-off. (b) Semi-quantitative RT-PCR detection of ROS-related genes (AKT2, MAP3K2, PIK3R1, FOXO3, and KHDRBS1) in hBM-MSCs after 6 or 12 h of storage in PBS. Glyceraldehyde 3-phosphate dehydrogenase (GAPDH) served as an internal control. Bands were cropped from Supplementary Fig. 2. (c) ROS-related gene expression in hBM-MSCs stored in PBS for 6 or 12 h, as determined by qPCR. Relative gene expression levels were normalized to that of GAPDH and compared to the level at 0 h (control). (d) Evaluation of intracellular ROS generation after 6 or 12 h using DCFH-DA. The intensity of non-oxidized DCFH-DA was used as a blank. Data represent mean ± SD of three independent experiments. *P < 0.05, **P < 0.001 vs. 0 h (control).
Amino acid profiles change over time in hBM-MSCs
ROS generation is closely related to the amino acid content of cells, since their efflux and influx are controlled by mitochondria, which are a source of ROS23, 24. We carried out a microarray expression analysis using MultiExperiment Viewer (MeV) software to cluster 34 genes related to amino acid metabolism. In hBM-MSCs stored for 12 h in PBS, the expressions of amino acid metabolism-related genes were significantly changed as compared to the 0 h time point (Fig. 3a).
Figure 3.
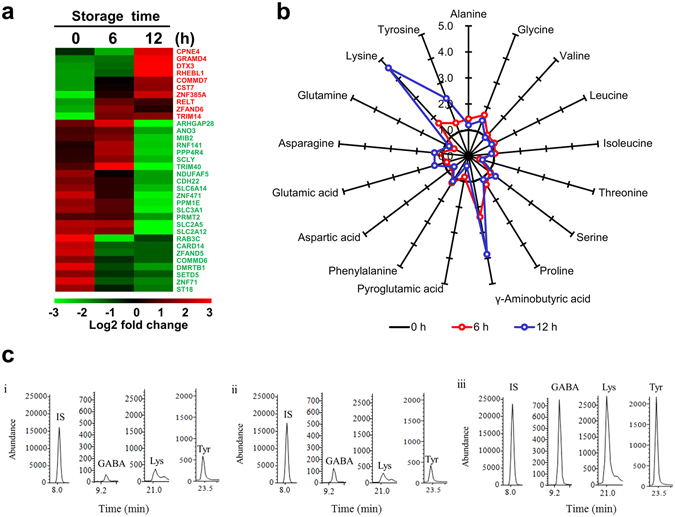
Changes in transcriptome and amino acid profiles in hBM-MSCs stored in PBS for 6 and 12 h. (a) Heat map of genes with altered expression; 34 genes related to amino acid metabolism were differentially expressed at 6 and 12 h according to a microarray analysis. Red and green areas indicate up- and downregulated genes, respectively. (b) Star plot showing altered levels of 17 amino acids after 6 and 12 h of incubation in hBM-MSCs. Data are based on percentage mean composition levels of 17 amino acids after normalization to the corresponding values in the control group. Three independent experiments were performed. Selected-ion monitoring (SIM) chromatograms of GABA, lysine, and tyrosine in (i) 0 h control (ii) 6 h group (iii) 12 h group. IS, Internal standard (norvaline).
The effect of storage time on cellular amino acid composition was investigated in hBM-MSCs stored for 6 and 12 h by gas chromatography–mass spectrometry (GC-MS), with values normalized to the mean levels in the control group (Supplementary Table 2). A plot of these values showed that the levels of lysine, tyrosine, and γ-aminobutyric acid (GABA) increased with storage time, with the highest levels observed at 12 h (Fig. 3b). The representative SIM chromatograms revealed that GABA, lysine, and tyrosine of 12 h group were considerably altered compared to 6 h group (Fig. 3c).
Gene co-expression network and amino acid profiles in hBM-MSCs
A gene co-expression network was constructed from microarray and amino acid profiling data by IPA. The data showed increased lipid peroxidation at 12 h (Fig. 4a, Supplementary Table 3) as compared to the 6 h time point (Supplementary Fig. 3). GABA, glutamate, lysine, serine, and glycine were directly related to lipid peroxidation along with 22 genes at 12 h. The expression of lipid peroxidation-related genes was quantified by qPCR (Fig. 4b), which showed that superoxide dismutase 2 (SOD2) and cytochrome P450, family 4 subfamily A polypeptide 11 (CYP4A11) were downregulated whereas tocopherol α transfer protein (TTPA), prostaglandin E receptor 4 (PTGER4), and protein kinase, AMP-activated, alpha 2 catalytic subunit (PRKAA2) were upregulated in the 12 h relative to the 0 h group.
Figure 4.
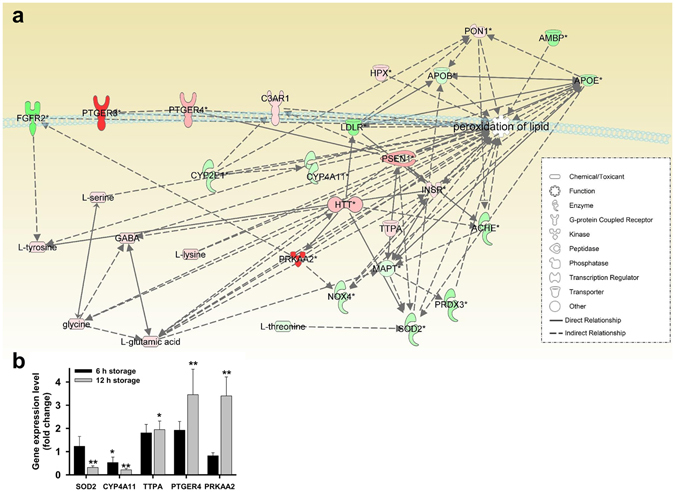
Bioinformatics analysis of microarray and amino acid profiles in hBM-MSCs stored in PBS for 12 h. (a) Lipid peroxidation-related genes and amino acid network were constructed algorithmically by IPA. Red and green areas indicate up- and downregulated genes, respectively. Differentially expressed genes obtained from microarray data (genes with >3-fold change) are shown. (b) qPCR analysis of lipid peroxidation-related gene expression in hBM-MSCs stored in PBS for 6 and 12 h. Data represent mean ± SD of three independent experiments. *P < 0.05, **P < 0.001 vs. 0 h (control).
Membrane fluidity decreases and lipid peroxidation increases over time in hBM-MSCs
hBM-MSCs membrane fluidity was determined based on Laurdan generalized polarization (GP) values and analyzed by total internal reflection fluorescence microscopy (TIRFM). The number of high-GP areas on the hBM-MSCs surface—corresponding to rigid domains—increased over time (Fig. 5a); increases in GP over time were suppressed in the presence of NAC, with a GP scale of −0.8 to 0.4. GP frequency distribution values were subtracted from corresponding values in control cells to obtain frequency difference curves (Fig. 5b) and total mean GP values (Fig. 5c). The difference values increased with storage time, an effect that was inhibited in the presence of NAC. A similar trend was observed in the relative levels of peroxidized lipid (Fig. 5d). These results indicate that rigid regions in hBM-MSC plasma membrane are increased over time via lipid peroxidation.
Figure 5.
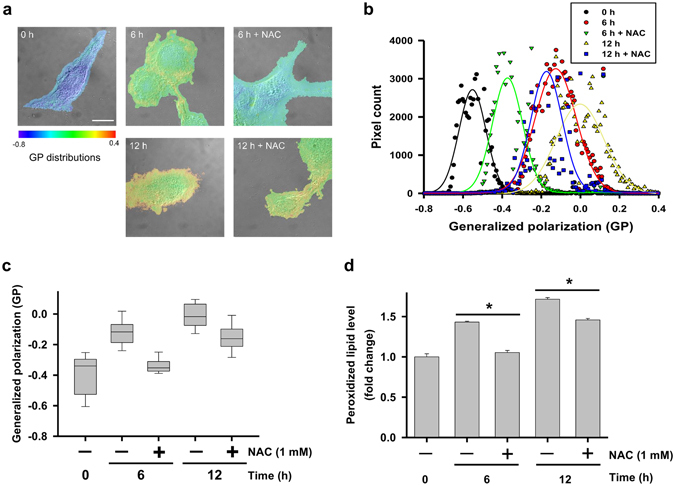
Laurdan GP images, GP frequency distributions, and evaluation of peroxidized lipids in hBM-MSCs stored in PBS for 6 and 12 h. (a) Merged DIC and TIRFM images of control hBM-MSCs. GP distributions were ranged from −0.8 to 0.4. Scale bar = 10 µm. (b) GP frequency distributions of hBM-MSCs. GP values of each pixel are represented as dots and were fitted to Gaussian distributions. (c) Total GP values. Data represent the mean ± SD of three independent experiments (n = 10). (d) Evaluation of peroxidized lipids using ferrous thiocyanate. The intensity of non-peroxidized lipid was used as a blank. Data represent mean ± SD of three independent experiments. *P < 0.05.
Discussion
The present study used a combination of microfluidics-based assessment of cell deformability, transcriptomics and metabolomics analyses, and differential interference contrast (DIC)-TIRFM measurement of membrane fluidity to evaluate the quality of hBM-MSCs stored in PBS over time. Our results indicate that minimizing storage time and blocking ROS generation are essential for preserving hBM-MSC quality for clinical applications.
The deformability of hBM-MSCs was dramatically altered after incubation in PBS for 24 h14. In this study, we observed a decrease in deformability at earlier time points (6 and 12 h). Moreover, cell size also decreased over time while morphology was altered. These results suggest that hBM-MSCs became stiff with increasing time in PBS. This is supported by the observed reduction in hBM-MSC viability reported in our previous study8 and the fact that erythrocytes with lipid abnormalities and low deformability are more vulnerable to osmotic stress and have reduced capacity for passing through vessel walls25.
A decrease in cell size, as observed here in hBM-MSCs stored in PBS, is associated with reductions in cell contents including DNA, proteins, and lipids26–28. Cell size is also related to autophagy and is regulated by mammalian target of rapamycin 1/2 activity, which is controlled by Ras-related C3 botulinum toxin substrate 1 (Rac1)29. We found that autophagy in hBM-MSCs increased with time, which was reversed by NAC treatment (Supplementary Fig. 4). We speculate that ROS are the main factors leading to autophagy in hBM-MSCs, although additional studies are needed to confirm this possibility.
Changes in amino acid profiles of cells reflect dysregulation of homeostasis30, which can perturb various cellular functions. Free amino acids such as tryptophan, tyrosine, histidine, and cysteine can be directly attacked by ROS31. We found that the levels of amino acids related to lipid peroxidation were altered in hBM-MSCs after 6 and 12 h of storage in PBS. GABA suppresses Ca2+ release, ROS production, and lipid peroxidation upon neuronal injury, both in vivo and in vitro 32. Glycine attenuates superoxide anion radical release in the presence of nicotinamide adenine dinucleotide phosphate and decreases protein carbonyl and lipid peroxidation by increasing the levels of glutathione synthetase and consequently, of glutathione33. ROS generation is increased by accumulation of basic amino acids such as arginine, ornithine, and lysine in the mitochondrial membrane, which induces mitochondria-dependent cell death via aberrant ubiquitination34. Thus, the response to ROS generation under serum starvation is closely related to changes in cellular amino acid composition.
Deficiency in SOD2—a major antioxidant enzyme—leads to lipid peroxidation via apolipoprotein B activation in a mouse model35. CYP4A proteins located in mitochondria also modulate the antioxidant pathway36. Genes encoding SOD2 and CYP4A were downregulated in our study. Altered expression of the α-tocopherol transporter protein TTPA and prostaglandin E2 receptor PTGER437 could affect the cellular response to lipid peroxidation and reduce membrane fluidity; our data suggest that such a reduction is responsible for the decrease in hBM-MSC deformability over time.
In the present study, we evaluated the effects of the common ROS scavenger NAC on hBM-MSCs over time. NAC is used as an inhibitor of ROS-induced apoptosis by oxidizing its own thiol group when used at a low concentration (<5 mM)38. However, NAC also induces apoptosis via inhibition of NF-κB when used at high concentrations (>20 mM)39. In this study, ROS generation and lipid peroxidation were reduced in presence of 1 mM NAC in hBM-MSCs overtime. In addition, NAC also restored cell deformability in hBM-MSCs over time, although this effect was not statistically significant (data not shown). Thus, inhibition of ROS and the addition of other additives for maintaining cell “freshness” with proper concentrations will be helpful for the establishment of effective BM-MSC therapies.
Differentiation capacity is the essential function of BM-MSC for therapies10. We analyzed osteogenic and adipogenic potentials with hBM-MSCs before and after exposure to PBS and NAC-treated hBM-MSCs. In osteogenic differentiation condition, there were no significant differences in differentiation capacities of hBM-MSCs. That is, mineral deposition and alkaline phosphatase activity of differentiated cells were not significantly different (Supplementary Fig. 5a,b). In addition, lipid deposition and mRNA expression levels of adipocyte specific marker genes, peroxisome proliferator-activated receptor (PPARγ) and complement factor D (Adipsin), were also not significantly different in adipogenic differentiation condition (Supplementary Figs 5c,d and 6). Thus, we suppose that the initial differences of PBS-stored hBM-MSCs and NAC-treated hBM-MSCs were faded out within the period for hBM-MSCs differentiation and shown no differences at the endpoint of differentiation.
In conclusion, hBM-MSCs used in clinical applications should be prepared as quickly as possible after disassociation from the culture dish and treated with an ROS blocker in order to preserve cell quality and ensure a successful outcome following transplantation.
Materials and Methods
Cell culture
hBM-MSCs were purchased from PromoCell (Heidelberg, Germany) from one donor (a 65-year-old Caucasian man) and were cultured as described in our previous study8. Briefly, the cells were rinsed with PBS and resuspended in low-glucose Dulbecco’s modified Eagle’s medium containing 10% fetal bovine serum and 1% penicillin/streptomycin (all from Gibco, Grand Island, NY, USA). Cells were harvested after six passages as we have previously reported8. Expression of hBM-MSC surface markers cluster of differentiation (CD)105 and CD73 was detected by flow cytometry4; cells were characterized as having high expression (~99%) of these positive markers and low expression (~1%) of the negative markers CD34 and CD45 (Supplementary Fig. 7). Approximately 106 cells from each fraction were centrifuged at 500 × g for 5 min, washed three times in PBS, and then incubated in PBS for 6 or 12 h.
Microfluidics measurement of cell deformation index
The deformability of hBM-MSCs was analyzed as previously described14. Briefly, a four-walled polydimethoxysilane microfluidic device fabricated using a standard photolithography method was used to measure deformation, with the longest and shortest length of the cell at the stagnation point of the cross-slot channel while monitoring stretch in the extensional flow. A 6.8 wt% polyvinylpyrrolidone (PVP) solution in PBS was used as the mobile fluid, with viscosity = 90 cP and relaxation time = 9.4 × 10⁻⁴ s.
qPCR
The expression of ROS- and lipid peroxidation-related genes was detected by qPCR using the RealMOD SYBR Green real-time PCR kit (Intron) with gene-specific primer pairs (Supplementary Tables 5 and 6) on a Rotor Gene-Q system (Qiagen, Valencia, CA, USA). Reaction conditions were as follow: 95 °C for 5 min, followed by 50 cycles of 95 °C for 5 s and 60 °C for 30 s. The threshold/quantification cycle (Ct/Cq) value was determined at the point where the detected fluorescence was statistically higher than the background level. PCR products were analyzed based on a melting curve constructed using Rotor-Gene 1.7 software (Qiagen). PCR reactions were prepared as independent triplicate samples. The relative quantification of target gene expression was calculated by the 2−ΔΔCt method.
GC–MS
Each of the amino acid content was analyzed by GC–MS as described in our previous report40. Briefly, GC–MS analyses in both scan and SIM modes were carried out on a model 6890 N gas chromatograph (Agilent Technologies, Santa Clara, CA, USA) interfaced with a model 5975B mass-selective detector (70 eV, electron impact ionization mode; Agilent Technologies).
Microarray and amino acid profiling
Changes in gene expression in hBM-MSCs were examined using the Affymetrix system (Istech, Ilsan, Korea) in conjunction with the Human U133 Plus 2.0 50 K microarray containing 54,675 probes. Differences in data distribution were analyzed with GenPlex 3.0 software as described in our previous report8. Biological pathways and functions were determined using the IPA web-based bioinformatics software (Qiagen). A 3-fold change in gene expression of 6 and 12 h stored hBM-MSCs was used as a cut-off value for genes with significant changes in expression in comparison with 0 h control.
Measurement of membrane fluidity
Changes in membrane fluidity were measured using Laurdan and a homemade DIC-TIRFM system, as described in our previous report41. The protocol has been described elsewhere42. Briefly, cells were seeded on cover slips (no. 1 thickness, 0.13–0.16 mm) and incubated in PBS for 6 or 12 h in the presence or absence of 1 mM NAC. For Laurdan staining, cells were incubated with medium containing 10 µM dye at 37 °C/5% CO2 for 2 h, then washed twice with PBS and fixed with Cytofix buffer (BD, San Jose, CA, USA). Cover slips with cells were mounted on glass slides with Prolong Gold Antifade mounting medium (Molecular Probes). Changes in Laurdan fluorescence were visualized with a 100× oil iris objective lens (NA = 0.6–1.3, UPLANFLN, Olympus Optical Co., Ltd., Tokyo, Japan) and images were captured with a electron-multiplying cooled charge-coupled device (EMCCD) camera (QuantEM 512SC; Photometrics, Tucson, AZ, USA). Excitation and emission wavelengths were 405 and 420 nm, respectively, with a 473 nm bandpass filter (resolution: ±5 nm). Membrane fluidity was determined with the formula generalized polarization (GP) = (Intensity420 nm − Intensity473 nm)/(Intensity420 nm + Intensity473 nm). Merged DIC/GP images were generated using ImageJ software. Gaussian distributions were generated using the nonlinear fitting algorithm in SigmaPlot v.10.0 software (Systat, San Jose, CA, USA).
Statistical analysis
The results were analyzed by one-way analysis of variance (ANOVA) using IBM-SPSS software (IBM Corp., USA). Differences with P values of less than 0.05 were considered significant.
Electronic supplementary material
Acknowledgements
The authors thank S.K. Cha for analyzing cell deformability. This work was supported by the Basic Science Research Program through the National Research Foundation (NRF) of Korea funded by the Ministry of Education, Science, and Technology (2015R1D1A1A09060192), (2015R1D1A3A01016103), Priority Research Centers Program through the National Research Foundation of Korea (NRF) funded by the Ministry of Education, Science and Technology (2009–0093826), and the Brain Research Program through the National Research Foundation of Korea(NRF) funded by the Ministry of Science, ICT & Future Planning (2016M3C7A1904392). In addition, this research was also supported by a grant of the Korea Health Technology R&D Project through the Korea Health Industry Development Institute (KHIDI), funded by the Ministry of Health & Welfare, Republic of Korea (HI15C0925).
Author Contributions
Conceived and designed the experiments: G.L., T.H.S., S.H.K. Performed the experiments: K.R.C., L.D.Y. Analyzed the data: C.S., M.J.P., S.K., M.S.J., S.L. Contributed reagents/materials/software tools: Y.M.K., S.H.K., T.H.Y. Wrote paper: T.H.S., G.L.
Competing Interests
The authors declare that they have no competing interests.
Footnotes
Tae Hwan Shin and Seungah Lee contributed equally to this work.
Electronic supplementary material
Supplementary information accompanies this paper at doi:10.1038/s41598-017-01315-0
Publisher's note: Springer Nature remains neutral with regard to jurisdictional claims in published maps and institutional affiliations.
Contributor Information
Seong Ho Kang, Email: shkang@khu.ac.kr.
Gwang Lee, Email: glee@ajou.ac.kr.
References
- 1.Lindvall O, Kokaia Z. Stem cells in human neurodegenerative disorders–time for clinical translation? J Clin Invest. 2010;120:29–40. doi: 10.1172/JCI40543. [DOI] [PMC free article] [PubMed] [Google Scholar]
- 2.Li S, et al. Advances in the Treatment of Ischemic Diseases by Mesenchymal Stem Cells. Stem Cells Int. 2016;2016:5896061. doi: 10.1155/2016/5896061. [DOI] [PMC free article] [PubMed] [Google Scholar]
- 3.Veronesi F, et al. Clinical use of bone marrow, bone marrow concentrate, and expanded bone marrow mesenchymal stem cells in cartilage disease. Stem Cells Dev. 2013;22:181–192. doi: 10.1089/scd.2012.0373. [DOI] [PubMed] [Google Scholar]
- 4.Bang OY, Lee JS, Lee PH, Lee G. Autologous mesenchymal stem cell transplantation in stroke patients. Ann Neurol. 2005;57:874–882. doi: 10.1002/ana.20501. [DOI] [PubMed] [Google Scholar]
- 5.Lee PH, et al. Autologous Mesenchymal Stem Cell Therapy Delays the Progression of Neurological Deficits in Patients With Multiple System Atrophy. Clin Pharmacol Ther. 2007;83:723–730. doi: 10.1038/sj.clpt.6100386. [DOI] [PubMed] [Google Scholar]
- 6.Suk KT, et al. Transplantation with Autologous Bone Marrow-Derived Mesenchymal Stem Cells for Alcoholic Cirrhosis: Phase 2 Trial. Hepatology. 2016;64:2185–2197. doi: 10.1002/hep.28693. [DOI] [PubMed] [Google Scholar]
- 7.Tse HF, et al. Angiogenesis in ischaemic myocardium by intramyocardial autologous bone marrow mononuclear cell implantation. Lancet. 2003;361:47–49. doi: 10.1016/S0140-6736(03)12111-3. [DOI] [PubMed] [Google Scholar]
- 8.Lee KA, et al. Analysis of changes in the viability and gene expression profiles of human mesenchymal stromal cells over time. Cytotherapy. 2009;11:688–697. doi: 10.3109/14653240902974032. [DOI] [PubMed] [Google Scholar]
- 9.Sohn HS, Heo JS, Kim HS, Choi Y, Kim HO. Duration of in vitro storage affects the key stem cell features of human bone marrow-derived mesenchymal stromal cells for clinical transplantation. Cytotherapy. 2013;15:460–466. doi: 10.1016/j.jcyt.2012.10.015. [DOI] [PubMed] [Google Scholar]
- 10.Muraki K, et al. Assessment of viability and osteogenic ability of human mesenchymal stem cells after being stored in suspension for clinical transplantation. Tissue Eng. 2006;12:1711–1719. doi: 10.1089/ten.2006.12.1711. [DOI] [PubMed] [Google Scholar]
- 11.Gossett DR, et al. Hydrodynamic stretching of single cells for large population mechanical phenotyping. Proc Natl Acad Sci USA. 2012;109:7630–7635. doi: 10.1073/pnas.1200107109. [DOI] [PMC free article] [PubMed] [Google Scholar]
- 12.Chien S. Red cell deformability and its relevance to blood flow. Annu Rev Physiol. 1987;49:177–192. doi: 10.1146/annurev.ph.49.030187.001141. [DOI] [PubMed] [Google Scholar]
- 13.Hierso R, et al. Effects of oxidative stress on red blood cell rheology in sickle cell patients. British journal of haematology. 2014;166:601–606. doi: 10.1111/bjh.12912. [DOI] [PubMed] [Google Scholar]
- 14.Cha S, et al. Cell stretching measurement utilizing viscoelastic particle focusing. Anal Chem. 2012;84:10471–10477. doi: 10.1021/ac302763n. [DOI] [PubMed] [Google Scholar]
- 15.Suraweera A, Munch C, Hanssum A, Bertolotti A. Failure of amino acid homeostasis causes cell death following proteasome inhibition. Mol Cell. 2012;48:242–253. doi: 10.1016/j.molcel.2012.08.003. [DOI] [PMC free article] [PubMed] [Google Scholar]
- 16.Woolfson AM. Amino acids–their role as an energy source. Proc Nutr Soc. 1983;42:489–495. doi: 10.1079/PNS19830055. [DOI] [PubMed] [Google Scholar]
- 17.Girotti AW. Lipid hydroperoxide generation, turnover, and effector action in biological systems. J Lipid Res. 1998;39:1529–1542. [PubMed] [Google Scholar]
- 18.Negre-Salvayre A, Coatrieux C, Ingueneau C, Salvayre R. Advanced lipid peroxidation end products in oxidative damage to proteins. Potential role in diseases and therapeutic prospects for the inhibitors. Br J Pharmacol. 2008;153:6–20. doi: 10.1038/sj.bjp.0707395. [DOI] [PMC free article] [PubMed] [Google Scholar]
- 19.de la Haba C, Palacio JR, Martinez P, Morros A. Effect of oxidative stress on plasma membrane fluidity of THP-1 induced macrophages. Biochim Biophys Acta. 2013;1828:357–364. doi: 10.1016/j.bbamem.2012.08.013. [DOI] [PubMed] [Google Scholar]
- 20.Blokhina O, Virolainen E, Fagerstedt KV. Antioxidants, oxidative damage and oxygen deprivation stress: a review. Ann Bot. 2003;91:179–194. doi: 10.1093/aob/mcf118. [DOI] [PMC free article] [PubMed] [Google Scholar]
- 21.Cazzola R, Rondanelli M, Russo-Volpe S, Ferrari E, Cestaro B. Decreased membrane fluidity and altered susceptibility to peroxidation and lipid composition in overweight and obese female erythrocytes. J Lipid Res. 2004;45:1846–1851. doi: 10.1194/jlr.M300509-JLR200. [DOI] [PubMed] [Google Scholar]
- 22.Parasassi T, Gratton E, Yu WM, Wilson P, Levi M. Two-photon fluorescence microscopy of laurdan generalized polarization domains in model and natural membranes. Biophys J. 1997;72:2413–2429. doi: 10.1016/S0006-3495(97)78887-8. [DOI] [PMC free article] [PubMed] [Google Scholar]
- 23.Stowe DF, Camara AK. Mitochondrial reactive oxygen species production in excitable cells: modulators of mitochondrial and cell function. Antioxidants & redox signaling. 2009;11:1373–1414. doi: 10.1089/ars.2008.2331. [DOI] [PMC free article] [PubMed] [Google Scholar]
- 24.Malinska D, Mirandola SR, Kunz WS. Mitochondrial potassium channels and reactive oxygen species. FEBS letters. 2010;584:2043–2048. doi: 10.1016/j.febslet.2010.01.013. [DOI] [PubMed] [Google Scholar]
- 25.Ghashghaeinia M, et al. The impact of erythrocyte age on eryptosis. Br J Haematol. 2012;157:606–614. doi: 10.1111/j.1365-2141.2012.09100.x. [DOI] [PubMed] [Google Scholar]
- 26.Saucedo LJ, Edgar BA. Why size matters: altering cell size. Curr Opin Genet Dev. 2002;12:565–571. doi: 10.1016/S0959-437X(02)00341-6. [DOI] [PubMed] [Google Scholar]
- 27.Stocker H, Hafen E. Genetic control of cell size. Curr Opin Genet Dev. 2000;10:529–535. doi: 10.1016/S0959-437X(00)00123-4. [DOI] [PubMed] [Google Scholar]
- 28.Jorgensen P, Tyers M. How cells coordinate growth and division. Curr Biol. 2004;14:R1014–1027. doi: 10.1016/j.cub.2004.11.027. [DOI] [PubMed] [Google Scholar]
- 29.Saci A, Cantley LC, Carpenter CL. Rac1 regulates the activity of mTORC1 and mTORC2 and controls cellular size. Mol Cell. 2011;42:50–61. doi: 10.1016/j.molcel.2011.03.017. [DOI] [PMC free article] [PubMed] [Google Scholar]
- 30.Chaveroux C, et al. Identification of a novel amino acid response pathway triggering ATF2 phosphorylation in mammals. Mol Cell Biol. 2009;29:6515–6526. doi: 10.1128/MCB.00489-09. [DOI] [PMC free article] [PubMed] [Google Scholar]
- 31.Droge W. Free radicals in the physiological control of cell function. Physiol Rev. 2002;82:47–95. doi: 10.1152/physrev.00018.2001. [DOI] [PubMed] [Google Scholar]
- 32.Hou CW. Pu-Erh tea and GABA attenuates oxidative stress in kainic acid-induced status epilepticus. J Biomed Sci. 2011;18:75. doi: 10.1186/1423-0127-18-75. [DOI] [PMC free article] [PubMed] [Google Scholar]
- 33.Ruiz-Ramirez A, Ortiz-Balderas E, Cardozo-Saldana G, Diaz-Diaz E, El-Hafidi M. Glycine restores glutathione and protects against oxidative stress in vascular tissue from sucrose-fed rats. Clin Sci (Lond) 2014;126:19–29. doi: 10.1042/CS20130164. [DOI] [PubMed] [Google Scholar]
- 34.Braun RJ, et al. Accumulation of Basic Amino Acids at Mitochondria Dictates the Cytotoxicity of Aberrant Ubiquitin. Cell Rep. 2015;10:1557–1571. doi: 10.1016/j.celrep.2015.02.009. [DOI] [PMC free article] [PubMed] [Google Scholar]
- 35.Uchiyama S, Shimizu T, Shirasawa T. CuZn-SOD deficiency causes ApoB degradation and induces hepatic lipid accumulation by impaired lipoprotein secretion in mice. J Biol Chem. 2006;281:31713–31719. doi: 10.1074/jbc.M603422200. [DOI] [PubMed] [Google Scholar]
- 36.Lukaszewicz KM, Lombard JH. Role of the CYP4A/20-HETE pathway in vascular dysfunction of the Dahl salt-sensitive rat. Clin Sci (Lond) 2013;124:695–700. doi: 10.1042/CS20120483. [DOI] [PMC free article] [PubMed] [Google Scholar]
- 37.Mal’tsev AN, Leve OI, Sadovnichii VV, Buko VU. [Antioxidant effect of prostaglandin E2 in the liver alcoholic steatosis] Eksp Klin Farmakol. 2001;64:61–63. [PubMed] [Google Scholar]
- 38.Sun L, et al. N-acetylcysteine protects against apoptosis through modulation of group I metabotropic glutamate receptor activity. PLoS One. 2012;7:e32503. doi: 10.1371/journal.pone.0032503. [DOI] [PMC free article] [PubMed] [Google Scholar]
- 39.Qanungo S, Wang M, Nieminen AL. N-Acetyl-L-cysteine enhances apoptosis through inhibition of nuclear factor-kappaB in hypoxic murine embryonic fibroblasts. J Biol Chem. 2004;279:50455–50464. doi: 10.1074/jbc.M406749200. [DOI] [PubMed] [Google Scholar]
- 40.Shim W, et al. Analysis of changes in gene expression and metabolic profiles induced by silica-coated magnetic nanoparticles. ACS Nano. 2012;6:7665–7680. doi: 10.1021/nn301113f. [DOI] [PubMed] [Google Scholar]
- 41.Lee S, Cho NP, Kim JD, Jung H, Kang SH. An ultra-sensitive nanoarray chip based on single-molecule sandwich immunoassay and TIRFM for protein detection in biologic fluids. Analyst. 2009;134:933–938. doi: 10.1039/b822094h. [DOI] [PubMed] [Google Scholar]
- 42.Schneckenburger H, Stock K, Strauss WS, Eickholz J. & Sailer, R. Time-gated total internal reflection fluorescence spectroscopy (TG-TIRFS): application to the membrane marker laurdan. J Microsc. 2003;211:30–36. doi: 10.1046/j.1365-2818.2003.01201.x. [DOI] [PubMed] [Google Scholar]
Associated Data
This section collects any data citations, data availability statements, or supplementary materials included in this article.


