

Abstract
We examined potential risk factors for changes in objectively assessed sleep duration within a large sample of community-dwelling older men. Participants (n = 1,055; mean baseline age = 74.6 (standard deviation (SD), 4.7) years) had repeated ActiGraph assessments (ActiGraph LLC, Pensacola, Florida) taken at the baseline (2003–2005) and follow-up (2009–2012) waves of the Outcomes of Sleep Disorders in Older Men Study (an ancillary study to the Osteoporotic Fractures in Men (MrOS) Study conducted in 6 US communities). Among men with a baseline nighttime sleep duration of 5–8 hours, we assessed the odds of becoming a short-duration (<5 hours) or long-duration (>8 hours) sleeper at follow-up. The odds of becoming a short-duration sleeper were higher among men with peripheral vascular disease (adjusted odds ratio (aOR) = 6.54, 95% confidence interval (CI): 2.30, 18.55) and ≥1 impairment in Instrumental Activities of Daily Living (IADL) (aOR = 2.57, 95% CI: 0.97, 6.78). The odds of becoming a long-duration sleeper were higher among those with greater baseline age (per SD increment, aOR = 1.49, 95% CI: 1.12, 2.00), depression symptoms (aOR = 3.13, 95% CI: 1.05, 9.36), and worse global cognitive performance (per SD increment of Modified Mini-Mental State Examination score, aOR = 0.74, 95% CI: 0.58, 0.94). Peripheral vascular disease and IADL impairment, but not chronological age, may be involved in the etiology of short sleep duration in older men. The risk factors for long-duration sleep suggest that deteriorating brain health predicts elongated sleep duration in older men.
Keywords: actigraphy, aging, chronic disease, longitudinal studies, sleep, sleep duration, sleep measures
Changes in sleep duration may be both a cause and a consequence of specific chronic diseases among older adults. Evidence regarding the consequences of short and long sleep duration on cardiovascular disease, diabetes, and mortality has risen to the level of several meta-analyses (1–5). To date, however, very few epidemiologic studies have examined the specific determinants of changes in sleep duration among older adults (6–8).
Current literature (9, 10), including a systematic review of available longitudinal evidence (11), suggests that specific disease processes, rather than chronological aging itself, predict changes in sleep with aging. Establishing the determinants of objectively measured changes in sleep duration is particularly important for informing evidence-based recommendations regarding the amount of sleep needed across the life span, specifically by understanding what sleep-duration changes experienced by older adults could be signaling (i.e., a normative aging process vs. a pathogenic process). However, prior epidemiologic investigations of change in sleep duration among older adults have been limited by reliance on subjective (i.e., self-reported) measures (6–8), which may inaccurately reflect sleep duration due to systematic bias (12). Therefore, while changes in sleep duration may reflect or occur due to particular preexisting disease processes, longitudinal research utilizing objective measures of sleep duration are needed to establish the specific health factors which predict changes in sleep duration with aging.
We performed a longitudinal study evaluating changes in objectively measured sleep duration over a period of 6 years in a large sample of community-dwelling men. Further, we tested whether the changes observed were predictable based on chronological age or antecedent heath factors. We selected a comprehensive set of physical (7, 13–20) and mental health (7, 13–16, 18–22) factors previously associated with sleep in aging. Sleep changes predict (23) and co-occur with (24) cognitive impairment among older adults; therefore, we also tested whether baseline cognitive function predicts sleep duration changes. Finally, prior literature has demonstrated that high levels of proinflammatory markers like interleukin-6 are associated with future self-reported long sleep duration (6) and that other cytokines, such as tumor necrosis factor α (TNF-α), have known roles in sleep regulation (25–27); we therefore also examined whether a panel of these and other cytokines were associated with changes in sleep duration.
METHODS
Participants
The Outcomes of Sleep Disorders in Older Men Study (the MrOS Sleep Study) was conducted at 6 US sites (Birmingham, Alabama; Minneapolis, Minnesota; Palo Alto, California; the Monongahela Valley, near Pittsburgh, Pennsylvania; Portland, Oregon; and San Diego, California) in 2003–2005 as an ancillary study to the Osteoporotic Fractures in Men (MrOS) Study. The baseline study visit (sleep visit 1; n = 3,135) took place at that time. More information on the MrOS parent study (28, 29) and details of the inclusion/exclusion criteria for sleep visit 1 (30) have been published previously. From 2009 to 2012, participants were recontacted and invited to participate in sleep visit 2 (target n = 1,000), and a total of 1,055 participants returned for this second sleep visit (Figure 1). Of sleep visit 2 participants, usable actigraphy data were collected from 1,044. Of the men with ActiGraph (ActiGraph LLC, Pensacola, Florida) measurements at both sleep visits, 935 had fasting serum collected as part of the ancillary cytokine study conducted at sleep visit 1. The study protocol was approved by the institutional review boards at each site, and written informed consent was obtained from all participants.
Figure 1.
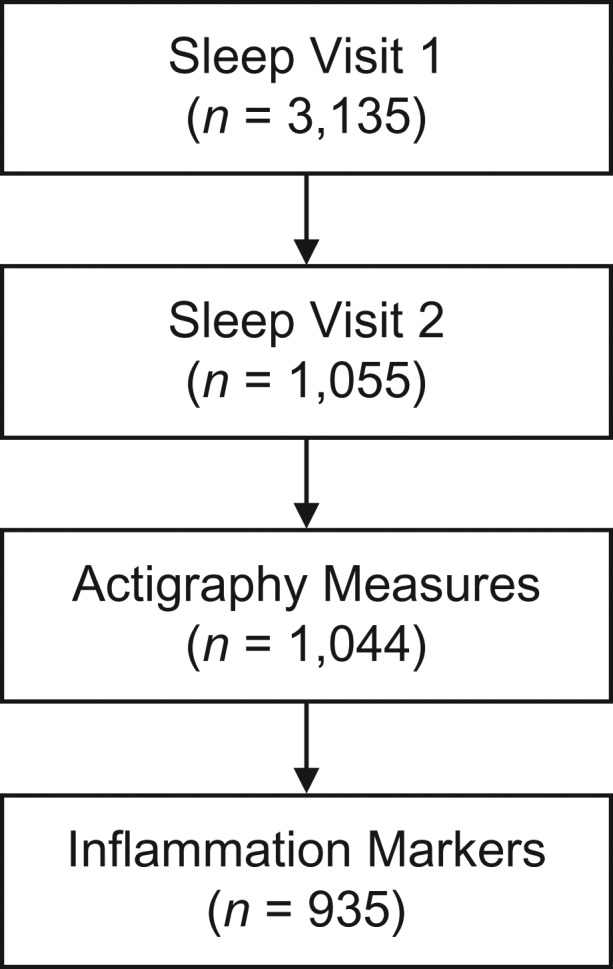
Selection of the analytical sample from the Outcomes of Sleep Disorders in Older Men Study, an ancillary study of the Osteoporotic Fractures in Men (MrOS) Study. The sleep study was conducted in 6 US communities between 2003 and 2012. Sleep visit 1 took place in 2003–2005, and sleep visit 2 took place in 2009–2012.
Sleep assessments
At sleep visit 1, participants were asked to wear the ActiGraph Octagonal Sleep Watch (SleepWatch-O; Ambulatory Monitoring, Inc., Ardsley, New York) on the nondominant wrist for a minimum of 5 consecutive 24-hour periods, except when bathing or engaging in water sports. However, this model of the device was unavailable when sleep visit 2 was initiated; therefore, the Actiwatch 2 (Respironics, Inc., Bend, Oregon) was utilized. A comparability study determined that, when similar option settings were used to define sleep latency and sleep offset (sleep visit 1: proportional integration mode data from SleepWatch-O; sleep visit 2: data from the low sensitivity threshold of Actiwatch 2), data from the two models of ActiGraphs used at sleep visit 1 and sleep visit 2 were comparable for measurement of total sleep time (31).
Participants were asked to keep a sleep log, including times of sleep onset and offset, which was used to edit ActiGraph data. Sleep onset was defined as the point at which the participant achieved sleep for 20 continuous minutes after getting into bed, and total sleep duration was calculated using an automated algorithm as described previously (32). Nighttime sleep duration at baseline was defined as number of hours per night spent sleeping in bed after “lights off” and was categorized as <5 hours (short), 5–8 hours (typical), or >8 hours (long). To examine incident cases of short (<5 hours) and long (>8 hours) sleep duration, analyses of change in sleep duration were conducted only among participants who had 5–8 hours’ sleep per night at baseline. These cutpoints were selected to enable analysis of changes from normative sleep to both shortened and prolonged sleep while capturing clinically significant changes in sleep duration.
Predictors of change in sleep duration
Demographic and lifestyle factors
Participants completed questionnaires that included collection of information on demographic factors, education, alcohol use (number of drinks consumed per week), smoking history, and physical activity (the Physical Activity Scale for the Elderly (PASE) (33)).
Mental and physical health
Geriatric Depression Scale-15, a validated short form of the Geriatric Depression Scale (34–36) for screening for major depressive disorder among older persons (37), was administered, and a standard cutpoint of ≥6 was used to define clinically significant depression symptoms; this cutoff yields a sensitivity of 90.9% and a specificity of 64.5% in comparison with a Diagnostic and Statistical Manual of Mental Disorders, Fourth Edition, diagnosis of major depression (36). The Goldberg Anxiety Scale with a cutoff of ≥5 was used to determine the presence of clinically significant anxiety symptoms. This was originally validated with a sensitivity and specificity of 86% and 91%, respectively (38). Cognitive function was measured using a global test of cognitive function (Teng and Chui's (39) Modified Mini-Mental State Examination), as well as the Digit Vigilance Test (40) and Trail Making Test Part B (41).
Information on self-reported health status (excellent/good vs. fair/poor/very poor) was obtained. Usual gait speed was assessed using a 6-m walk. The presence of impairment in Instrumental Activities of Daily Living (IADL) was determined by asking participants whether they had difficulty with the following activities: heavy housework, preparing one's own meals, shopping for groceries or clothing, walking 2–3 blocks, and climbing 10 stairs (42, 43). Self-reported history of the following medical diagnoses was also obtained: rheumatoid arthritis, osteoarthritis, cataracts, stroke, Parkinson disease, diabetes mellitus, chronic obstructive pulmonary disease, hypertension, peripheral vascular disease, angina, and myocardial infarction. Participants were asked to bring all current medications used within the last 30 days with them to sleep visit 1; ingredients were coded to active ingredients using a coding dictionary (44). Medications considered in the analyses included antidepressants, benzodiazepines, and other (nonbenzodiazepine) sedatives/hypnotics.
Inflammatory markers
Serum was collected during morning clinic visits after an overnight fast. A natural log transformation was applied to normalize their data distributions, which were initially skewed. C-reactive protein was measured using the enzyme-linked immunosorbent assay kit from American Laboratory Products Company (Salem, New Hampshire). Interleukin-6, TNF-α, and interferon-γ were assayed using the Human ProInflammatory I 4-Plex Ultra-Sensitive Kit by Meso Scale Discovery (catalog no. K15009C-4; Meso Scale Diagnostics LLC, Rockville, Maryland). TNF-α soluble receptor II was measured with an enzyme-linked immunosorbent assay from R&D Systems (catalog no. DRT200; R&D Systems, Inc., Minneapolis, Minnesota). Interassay coefficients of variation for these markers have been published previously (45).
Statistical analysis
All continuous predictor variables were standardized except those categorized to represent clinically significant categories as above. Multinominal logistic regression models were used to examine associations between all baseline predictors and short (<5 hours) and long (>8 hours) sleep duration at follow-up (compared with participants remaining in the 5- to 8-hour sleep duration range). To further ensure that any associations detected were independent of baseline variability in sleep duration, we adjusted all model results for baseline sleep duration expressed continuously. We first examined age- and site-adjusted associations between all predictors and the odds of change in sleep duration using separate multinominal logistic regression models. We then created a multivariable-adjusted model by entering only predictor variables that met the standard of crude significance at P < 0.10 with a Benjamin-Hochberg (46) false-discovery rate of q < 0.10 (to protect against false-positive findings due to the large number of predictor variables examined). To examine whether other variables that did not meet this stringent criterion represented potential independent contributors to variability in sleep-duration changes, we performed a sensitivity analysis adding all bivariate associations meeting the P < 0.10 standard to the multivariable model described above.
RESULTS
Baseline demographic and health characteristics by baseline sleep duration are presented in Web Table 1 (available at http://aje.oxfordjournals.org/) for descriptive purposes. The average time from sleep visit 1 to sleep visit 2 (among all 1,044 men) was 6.5 years. Among men with a baseline sleep duration of 5–8 hours (n = 865), 89% remained 5- to 8-hour sleepers at follow-up, 3.6% (n = 31) became short (<5 hours) sleepers, and 7.4% (n = 64) became long (>8 hours) sleepers. The mean and median changes in sleep duration among those becoming short sleepers (mean = −82.7 (standard deviation (SD), 36.3) minutes; median, −76 minutes) and long sleepers (mean = 78.8 (SD, 42.3) minutes; median, 69 minutes) represented substantial/clinically significant changes, while the vast majority of men remained 5- to 8-hour sleepers and had an average change in sleep duration of 1.98 (SD, 46.0) minutes at follow-up (median, 1 minute).
Demographic/lifestyle predictors of change in sleep duration
In base models, age was associated with higher odds of becoming a long-duration sleeper but not a short-duration sleeper (odds ratios are shown in Table 1). No other demographic/lifestyle factor met the criteria for being a significant predictor of change in sleep duration, although greater physical activity (measured with the PASE) was associated with reduced odds of becoming a short sleeper.
Table 1.
Demographic and Lifestyle Predictors of Change in Sleep Duration Among Oldera Men (n = 1,055) in the Outcomes of Sleep Disorders in Older Men Study (Sleep Visit 1; 2003–2005)b
| Characteristic | Total Sleep Time | |||||||
|---|---|---|---|---|---|---|---|---|
| Short (<5 Hours) (n = 31) | Long (>8 Hours) (n = 64) | |||||||
| OR | 95% CI | P Value | q Value | OR | 95% CI | P Value | q Value | |
| Age, years (per SD increment) | 0.93 | 0.63, 1.38 | 0.7187 | 0.875 | 1.63 | 1.25, 1.13 | 0.0003 | 0.0102 |
| White race/ethnicity | 1.40 | 0.43, 4.53 | 0.5791 | 0.875 | 0.50 | 0.22, 1.13 | 0.097 | 0.2888 |
| College/graduate education (per SD increment) | 0.92 | 0.31, 2.70 | 0.8796 | 0.9475 | 0.52 | 0.25, 1.07 | 0.0746 | 0.2818 |
| Alcohol intake, drinks/week | ||||||||
| 0 | 1 | Referent | 1 | Referent | ||||
| 1–13 | 0.68 | 0.17, 2.80 | 0.5969 | 0.875 | 1.17 | 0.36, 3.80 | 0.7896 | 0.839 |
| ≥14 | 0.40 | 0.10, 1.54 | 0.1816 | 0.5287 | 0.70 | 0.23, 2.14 | 0.5332 | 0.6666 |
| Smoking status (past/current vs. never) | 1.35 | 0.63, 2.89 | 0.4463 | 0.875 | 1.58 | 0.89, 2.81 | 0.1189 | 0.2888 |
| PASE score (per SD increment) | 0.63 | 0.43, 0.94 | 0.0244 | 0.2237 | 0.91 | 0.67, 1.24 | 0.5478 | 0.6666 |
Abbreviations: CI, confidence interval; OR, odds ratio; PASE, Physical Activity Scale for the Elderly; SD, standard deviation.
a Mean age at baseline = 74.6 (standard deviation, 4.7) years.
b Results from crude models are shown (adjusted for age, site, and baseline sleep duration in minutes). The reference category was maintaining a sleep duration of 5–8 hours per night at sleep visit 2 (2009–2012).
Physical and mental health predictors of change in sleep duration
Men with clinically significant depressive symptoms (measured with Geriatric Depression Scale-15) at baseline had higher crude odds of becoming a long sleeper, while better global cognitive performance (higher scores on the Modified Mini-Mental State Examination) and faster gait speed were associated with lower odds of becoming a long sleeper (Table 2). In these base models, the presence of any IADL impairment and peripheral vascular disease were associated with higher odds of becoming a short sleeper. Several other associations met the traditional standard of significance but not the multiple-comparison-corrected significance level: Faster gait speed was associated with lower odds of becoming a short sleeper, having “good/fair” perceived health was associated with lower odds of becoming a long sleeper, and both stroke and Parkinson disease were associated with greater odds of becoming a long sleeper. No other mental or physical health variables were significantly associated with change in sleep duration.
Table 2.
Physical and Mental Health Predictors of Change in Sleep Duration Between Sleep Visit 1 (2003–2005) and Sleep Visit 2 (2009–2012), Outcomes of Sleep Disorders in Older Men Studya
| Characteristic | Total Sleep Time | |||||||
|---|---|---|---|---|---|---|---|---|
| Short (<5 Hours) (n = 31) | Long (>8 Hours) (n = 64) | |||||||
| OR | 95% CI | P Value | q Value | OR | 95% CI | P Value | q Value | |
| Geriatric Depression Scale score ≥6 | 2.53 | 0.67, 9.55 | 0.1698 | 0.5287 | 4.10 | 1.52, 11.02 | 0.0052 | 0.0536 |
| Self-perceived good/excellent health | 0.41 | 0.16, 1.04 | 0.0616 | 0.3491 | 0.41 | 0.18, 0.93 | 0.0324 | 0.1836 |
| Goldberg Anxiety Scale score ≥5 | 2.22 | 0.77, 6.42 | 0.1400 | 0.5287 | 2.13 | 0.85, 5.35 | 0.1088 | 0.2888 |
| Use of antidepressant medication | 2.35 | 0.73, 7.54 | 0.1498 | 0.5287 | 1.68 | 0.63, 4.46 | 0.2983 | 0.5338 |
| 3MS score (per SD increment) | 1.09 | 0.71, 1.67 | 0.6868 | 0.875 | 0.69 | 0.55, 0.86 | 0.001 | 0.0170 |
| ≥1 IADL impairments | 3.78 | 1.59, 9.00 | 0.0026 | 0.0442 | 1.81 | 0.86, 3.78 | 0.1169 | 0.2888 |
| Leg pain | 1.75 | 0.78, 3.91 | 0.1765 | 0.5287 | 1.49 | 0.78, 2.84 | 0.2313 | 0.4626 |
| Rheumatoid arthritis | 1.32 | 0.30, 5.94 | 0.7148 | 0.875 | 1.34 | 0.51, 3.53 | 0.549 | 0.6666 |
| Osteoarthritis | 0.97 | 0.40, 2.35 | 0.9485 | 0.9485 | 1.37 | 0.72, 2.60 | 0.3361 | 0.5442 |
| Cataracts | 1.20 | 0.55, 2.62 | 0.6471 | 0.875 | 0.72 | 0.40, 1.30 | 0.2776 | 0.5244 |
| Stroke | 2.14 | 0.25, 18.3 | 0.4866 | 0.875 | 3.78 | 1.22, 11.7 | 0.0216 | 0.1469 |
| Parkinson disease | 6.20 | 0.34, 112.8 | 0.2177 | 0.5287 | 10.7 | 1.12, 99.9 | 0.0397 | 0.1928 |
| Diabetes | 1.23 | 0.40, 3.73 | 0.7206 | 0.875 | 1.91 | 0.88, 4.13 | 0.1013 | 0.2888 |
| Chronic obstructive pulmonary disease | 1.11 | 0.14, 9.01 | 0.9196 | 0.9475 | 1.71 | 0.46, 6.35 | 0.4196 | 0.5944 |
| Hypertension | 1.62 | 0.77, 3.42 | 0.2041 | 0.5287 | 1.15 | 0.66, 2.00 | 0.6149 | 0.6969 |
| Peripheral vascular disease | 7.22 | 2.59, 20.1 | 0.0002 | 0.0068 | 1.81 | 0.74, 4.40 | 0.192 | 0.408 |
| Angina | 1.33 | 0.44, 4.01 | 0.6172 | 0.8750 | 1.25 | 0.56, 2.76 | 0.5883 | 0.6897 |
| Myocardial infarction | 1.38 | 0.49, 3.84 | 0.5413 | 0.8750 | 1.13 | 0.54, 2.39 | 0.7447 | 0.8168 |
| Use of benzodiazepine | 0.88 | 0.11, 6.99 | 0.9020 | 0.9475 | 0.34 | 0.04, 2.81 | 0.317 | 0.5389 |
| Digital Vigilance Test score (per SD increment) | 1.13 | 0.78, 1.64 | 0.5068 | 0.8750 | 1.12 | 0.86, 1.47 | 0.3917 | 0.5821 |
| Trail Making Test Part B score (per SD increment) | 1.24 | 0.89, 1.74 | 0.2016 | 0.5287 | 1.12 | 0.86, 1.46 | 0.3938 | 0.5821 |
| Gait speed (per SD increment) | 0.64 | 0.43, 0.96 | 0.0329 | 0.2237 | 0.63 | 0.46, 0.88 | 0.0063 | 0.0536 |
Abbreviations: CI, confidence interval; IADL, Instrumental Activities of Daily Living; 3MS, Modified Mini-Mental State Examination; OR, odds ratio; SD, standard deviation.
a Results from crude models are shown (adjusted for age, site, and baseline sleep duration in minutes). The reference category was maintaining a sleep duration of 5–8 hours per night at sleep visit 2.
Inflammatory marker predictors of change in sleep duration
None of the inflammatory markers examined were significantly associated with change in sleep duration by multiple-comparison-corrected criteria (Table 3). In the base models, however, higher levels of interleukin-6 were associated with greater odds of becoming a short sleeper, and higher levels of TNF-α were associated with greater odds of becoming a long sleeper (P = 0.06).
Table 3.
Inflammatory Marker Predictors of Change in Sleep Duration Between Sleep Visit 1 (2003–2005) and Sleep Visit 2 (2009–2012), Outcomes of Sleep Disorders in Older Men Studya
| Characteristic | Total Sleep Time | |||||||
|---|---|---|---|---|---|---|---|---|
| Short (<5 Hours) (n = 27) | Long (>8 Hours) (n = 58) | |||||||
| OR | 95% CI | P Value | q Value | OR | 95% CI | P Value | q Value | |
| TNF-α, pg/mLb | 1.06 | 0.73, 1.54 | 0.7524 | 0.8821 | 1.35 | 0.99, 1.85 | 0.0621 | 0.2639 |
| IL-6, pg/mLb | 1.43 | 1.04, 1.99 | 0.0301 | 0.2237 | 1.22 | 0.91, 1.63 | 0.1903 | 0.4080 |
| CRP, μg/mLb | 0.81 | 0.55, 1.21 | 0.3028 | 0.6863 | 0.90 | 0.66, 1.23 | 0.5028 | 0.6666 |
| IFN-γ, pg/mLb | 0.97 | 0.63, 1.48 | 0.8788 | 0.9475 | 0.99 | 0.74, 1.34 | 0.9810 | 0.9810 |
| TNF-α-sRII, pg/mL | 1.19 | 0.83, 1.70 | 0.3419 | 0.7265 | 1.01 | 0.75, 1.36 | 0.9493 | 0.9781 |
Abbreviations: CI, confidence interval; CRP, C-reactive protein; IFN-γ, interferon γ; IL-6, interleukin-6; OR, odds ratio; TNF-α, tumor necrosis factor α; TNF-α-sRII, tumor necrosis factor α soluble receptor 2.
a Results from crude models are shown (adjusted for age, site, and baseline sleep duration in minutes). All ORs show the odds of a change in sleep duration per standard-deviation increment in the cytokine levels. The reference category was maintaining a sleep duration of 5–8 hours per night at sleep visit 2.
b Log-transformed.
Multivariable model
The base associations described above meeting criteria for multiple-comparison-adjusted statistical significance were entered into a multivariable model. The magnitude and significance of these associations were not substantively altered, except for the association of walking speed with future long sleep duration, which was completely attenuated by multivariable adjustments (Table 4).
Table 4.
Results From the Final Multivariable-Adjusted Model of Change in Sleep Duration Between Sleep Visit 1 (2003–2005) and Sleep Visit 2 (2009–2012), Outcomes of Sleep Disorders in Older Men Studya
| Characteristic | Total Sleep Time | |||||
|---|---|---|---|---|---|---|
| Short (<5 Hours) (n = 31) | Long (>8 Hours) (n = 62) | |||||
| OR | 95% CI | P Value | OR | 95% CI | P Value | |
| Age, years (per SD increment) | 0.80 | 0.53, 1.22 | 0.3019 | 1.49 | 1.12, 2.00 | 0.0071 |
| Geriatric Depression Scale score ≥6 | 1.62 | 0.38, 6.86 | 0.5123 | 3.13 | 1.05, 9.36 | 0.0411 |
| 3MS score (per SD increment) | 1.29 | 0.80, 2.08 | 0.2973 | 0.74 | 0.58, 0.94 | 0.0135 |
| ≥1 IADL impairments | 2.57 | 0.97, 6.78 | 0.0577 | 1.24 | 0.54, 2.83 | 0.6090 |
| Peripheral vascular disease | 6.54 | 2.30, 18.6 | 0.0004 | 1.57 | 0.64, 3.86 | 0.3220 |
| Gait speed (per SD increment) | 0.68 | 0.43, 1.07 | 0.0956 | 0.85 | 0.60, 1.21 | 0.3641 |
Abbreviations: CI, confidence interval; IADL, Instrumental Activities of Daily Living; 3MS, Modified Mini-Mental State Examination; OR, odds ratio; SD, standard deviation.
a Results were also adjusted for site and baseline sleep duration in minutes. The reference category was maintaining a sleep duration of 5–8 hours per night at sleep visit 2.
Adding to the multivariable model other associations that achieved bivariate P < 0.10 (no false discovery rate criteria) altered some but not all of these associations. The associations of age and global cognitive function with increased odds of becoming a longer sleeper were not substantively altered (Web Table 2). However, in this model, the association of depression with future long sleep was attenuated and failed to retain statistical significance (adjusted odds ratio = 1.97, 95% confidence interval: 0.57, 6.82). None of the additional covariates were significantly associated with becoming a long sleeper. The associations of IADL impairment and peripheral vascular disease with becoming a short sleeper were not substantively altered in the expanded final model, and the only additional factor to achieve a statistically significant association with becoming a short sleeper was physical activity level (higher PASE scores were associated with a lower likelihood of becoming a short sleeper; adjusted odds ratio = 0.54, 95% confidence interval: 0.33, 0.89).
DISCUSSION
Over more than 6 years of follow-up, among men with 5–8 hours’ sleep per night at baseline, we found, using objective measures of sleep duration, that 3.6% of the participants developed short sleep duration and 7.4% developed long sleep duration. The mean continuous level of change among men with incident changes in sleep duration indicates that, on average, becoming a short sleeper and becoming a long sleeper alike represented substantial change.
To our knowledge, our study is the first to identify potential risk factors for the development of objectively assessed changes in sleep duration in a community-based sample of older adults. Our findings suggest that aging itself does not cause reductions in the duration of nighttime sleep and that peripheral vascular disease, IADL impairment, reduced physical activity, and inflammation may contribute to the etiology of short sleep in older men. Peripheral vascular disease was the strongest predictor of the likelihood of becoming a short sleeper, although age itself was not; in base models, the presence of IADL impairment, lower levels of physical activity, and greater levels of interleukin-6 also significantly predicted a greater likelihood of becoming a short sleeper. Future research should target these factors to further elucidate the specific mechanism(s) underlying the risk of shortening sleep in this population. The association of peripheral vascular disease with future short sleep was particularly strong (i.e., in terms of effect size); therefore, this predictor may be of clinical use for the early identification of men at risk of short sleep duration and related consequences (e.g., effects on metabolic/cardiovascular health).
Age and worse cognitive performance were both independently associated with becoming a long-duration sleeper. These findings are consistent with chronological aging's being related to elongation of nighttime sleep; alternatively, however, unmeasured disease/biological process may account for the detected association between age and long sleep duration. Interestingly, all 3 of the predictors we observed (age, depression, and cognition) to increase the likelihood of becoming a long sleeper have been previously associated with worse brain structural health (47–51). Therefore, these predictors of future long sleep may be markers of worse brain structural health, although future research is needed to establish whether and what type of brain structural pathology might cause older persons’ sleep to become prolonged.
We also found that although gait speed predicted future long sleep duration in the bivariate model, this association was completely attenuated by adjustments in the first multivariable model. This suggests that the association between gait speed and the development of long sleep duration can be explained by age, depression, or cognitive performance (i.e., factors included in the multivariable model in Table 4 that are markers of brain health). Consistent with this interpretation, a previous study found that overt cerebrovascular disease (i.e., stroke) was related to the future development of long sleep duration (8), and our crude analysis replicated this association. In addition, the association between clinically significant depression symptoms with future long sleep duration was attenuated to nonsignificance in the final, inclusive multivariable model. This suggests that depression may mark an increased likelihood of becoming a future long sleeper, and that the underlying pathogenic processes by which depression and the other physical health factors considered (e.g., stroke or specific cytokine levels) affect sleep duration may overlap. Finally, in base models, we found that TNF-α levels predicted higher odds of becoming a long-duration sleeper, potentially by directly increasing sleep propensity (25), by altering sleep architecture towards deeper sleep (26), or via an association with brain structural damage (52). Future research is needed to establish whether these risk markers cause prolonged sleep—for example, due to a decreased ability of the brain to efficiently produce restorative sleep or to dissipate enhanced homeostatic drive. Future research is also needed to establish whether, in this context, prolonged sleep duration serves a therapeutic or toxic process.
What we did not observe is also worth noting. Diabetes and cardiovascular disease, which have been recognized as potential consequences of both short and long sleep duration (1, 4, 5), were not related to changes in sleep duration. These observations may help to exclude the potential role of reverse causality by preexisting metabolic/cardiovascular factors’ causing changes in sleep duration. However, this conclusion must be tempered by the fact that we did not include a comprehensive assessment of subclinical measures of metabolic/cardiovascular disease that may contribute to changes in sleep duration.
Several additional limitations should be noted. We corrected for multiple comparisons to minimize false-positive findings, but there may be a risk for false-negative findings, given that our sample and number of events were relatively small. Our analysis did not include some potentially important determinants of future sleep, potentially including other biological (e.g., cerebrovascular disease) or psychosocial (e.g., sleeping environment) factors; furthermore, we focused on baseline predictors of change in sleep, although changes occurring between the study visits (e.g., changes in medication use) may also explain changes in sleep duration. In addition, sleep health is multidimensional (53), and future research is needed to address the determinants of changes in other aspects of sleep (e.g., sleep fragmentation or napping) and how changes in different aspects of sleep interrelate (e.g., how sleep electrophysiology or quality changes among men who became long sleepers). Finally, our sample was restricted to older men who were mostly white and who survived through and were willing to partake in multiple objective sleep assessments; therefore, these participants may have been healthier than the general population, and our findings may have underestimated the true rates of changes in sleep duration among older adults.
Despite these limitations, and acknowledging that these findings need to be replicated other samples, our study had several strengths surpassing the available literature. Using repeated sleep measures enabled us to stratify analyses to participants without a short or long sleep duration at baseline and to adjust for levels of baseline sleep parameters; these methodological advantages over past studies (e.g., the work of Dowd et al. (6)) ensured that the associations between baseline predictors and sleep-duration changes were independent of initial sleep duration. Importantly, we also used objective measures of sleep, which adds greater assessment reliability to current epidemiologic literature on sleep changes in aging, which had previously been limited to self-reported sleep duration. Finally, we performed a comprehensive assessment of lifestyle/clinical factors and adjusted for multiple comparisons to reduce the chances of false-positive findings.
In conclusion, rather than chronological aging itself affecting sleep, aging-related increases in the prevalence of identified diseases that predict changes in sleep duration may explain why sleep duration changes during aging. We found that the predictors of shortening and elongating sleep in aging men differed markedly, and our observations suggest potential mechanisms by which sleep duration changes in these directions. In future research, investigators should target the identified factors to further elucidate the pathophysiology and pathogenesis of changes in sleep duration. Peripheral vascular disease may be the most robust risk factors for future short sleep duration. Long sleep duration may result from aging-related disease processes affecting central nervous system integrity. Future intervention studies are needed to test whether modifying these risk factors reduces changes in sleep duration (and related consequences), and in trials targeting these risk factors for other purposes, researchers should consider monitoring sleep as a secondary outcome.
Supplementary Material
ACKNOWLEDGMENTS
Author affiliations: Department of Psychiatry, Western Psychiatric Institute and Clinic, University of Pittsburgh Medical Center, Pittsburgh, Pennsylvania (Stephen F. Smagula); Research Institute, California Pacific Medical Center, San Francisco, California (Stephanie Harrison, Peggy M. Cawthon, Steve Cummings, Katie L. Stone); Department of Epidemiology, Graduate School of Public Health, University of Pittsburgh, Pittsburgh, Pennsylvania (Jane A. Cauley); and Departments of Psychiatry and Medicine, School of Medicine, University of California, San Diego, San Diego, California (Sonia Ancoli-Israel).
This work was supported by the National Institutes of Health (NIH). The following entities provide support for the Osteoporotic Fractures in Men (MrOS) Study: the National Institute on Aging, the National Institute of Arthritis and Musculoskeletal and Skin Diseases, the National Center for Advancing Translational Sciences, and the NIH Roadmap for Medical Research, under the following grants: U01 AG027810, U01 AG042124, U01 AG042139, U01 AG042140, U01 AG042143, U01 AG042145, U01 AG042168, U01 AR066160, and UL1 TR000128. The National Heart, Lung, and Blood Institute provides funding for the MrOS ancillary sleep study, the Outcomes of Sleep Disorders in Older Men Study, under the following grants: R01 HL071194, R01 HL070848, R01 HL070847, R01 HL070842, R01 HL070841, R01 HL070837, R01 HL070838, and R01 HL070839. S.F.S. is supported by grant T32 MH019986 from the National Institute of Mental Health.
Conflict of interest: none declared.
REFERENCES
- 1. Cappuccio FP, Cooper D, D'Elia L, et al. Sleep duration predicts cardiovascular outcomes: a systematic review and meta-analysis of prospective studies. Eur Heart J. 2011;32(12):1484–1492. [DOI] [PubMed] [Google Scholar]
- 2. Cappuccio FP, D'Elia L, Strazzullo P, et al. Sleep duration and all-cause mortality: a systematic review and meta-analysis of prospective studies. Sleep. 2010;33(5):585–592. [DOI] [PMC free article] [PubMed] [Google Scholar]
- 3. Gallicchio L, Kalesan B. Sleep duration and mortality: a systematic review and meta-analysis. J Sleep Res. 2009;18(2):148–158. [DOI] [PubMed] [Google Scholar]
- 4. Ju SY, Choi WS. Sleep duration and metabolic syndrome in adult populations: a meta-analysis of observational studies. Nutr Diabetes. 2013;3:e65. [DOI] [PMC free article] [PubMed] [Google Scholar]
- 5. Shan Z, Ma H, Xie M, et al. Sleep duration and risk of type 2 diabetes: a meta-analysis of prospective studies. Diabetes Care. 2015;38(3):529–537. [DOI] [PubMed] [Google Scholar]
- 6. Dowd JB, Goldman N, Weinstein M. Sleep duration, sleep quality, and biomarkers of inflammation in a Taiwanese population. Ann Epidemiol. 2011;21(11):799–806. [DOI] [PMC free article] [PubMed] [Google Scholar]
- 7. Roberts RE, Shema SJ, Kaplan GA. Prospective data on sleep complaints and associated risk factors in an older cohort. Psychosom Med. 1999;61(2):188–196. [DOI] [PubMed] [Google Scholar]
- 8. Smagula SF, Koh WP, Wang R, et al. Chronic disease and lifestyle factors associated with change in sleep duration among older adults in the Singapore Chinese Health Study. J Sleep Res. 2015;25(1):57–61. [DOI] [PMC free article] [PubMed] [Google Scholar]
- 9. Ancoli-Israel S. Sleep and its disorders in aging populations. Sleep Med. 2009;10(suppl 1):S7–S11. [DOI] [PubMed] [Google Scholar]
- 10. Vitiello MV, Moe KE, Prinz PN. Sleep complaints cosegregate with illness in older adults: clinical research informed by and informing epidemiological studies of sleep. J Psychosom Res. 2002;53(1):555–559. [DOI] [PubMed] [Google Scholar]
- 11. Smagula SF, Stone KL, Fabio A, et al. Risk factors for sleep disturbances in older adults: evidence from prospective studies. Sleep Med Rev. 2016;25:21–30. [DOI] [PMC free article] [PubMed] [Google Scholar]
- 12. Lauderdale DS, Knutson KL, Yan LL, et al. Self-reported and measured sleep duration: how similar are they. Epidemiology. 2008;19(6):838–845. [DOI] [PMC free article] [PubMed] [Google Scholar]
- 13. Pedraza S, Al Snih S, Ottenbacher KJ, et al. Sleep quality and sleep problems in Mexican Americans aged 75 and older. Aging Clin Exp Res. 2012;24(4):391–397. [DOI] [PMC free article] [PubMed] [Google Scholar]
- 14. Quan SF, Katz R, Olson J, et al. Factors associated with incidence and persistence of symptoms of disturbed sleep in an elderly cohort: the Cardiovascular Health Study. Am J Med Sci. 2005;329(4):163–172. [DOI] [PubMed] [Google Scholar]
- 15. Foley DJ, Monjan A, Simonsick EM, et al. Incidence and remission of insomnia among elderly adults: an epidemiologic study of 6,800 persons over three years. Sleep. 1999; 22(suppl 2):S366–S372. [PubMed] [Google Scholar]
- 16. Kim JM, Stewart R, Kim SW, et al. Insomnia, depression, and physical disorders in late life: a 2-year longitudinal community study in Koreans. Sleep. 2009;32(9):1221–1228. [DOI] [PMC free article] [PubMed] [Google Scholar]
- 17. Gureje O, Oladeji BD, Abiona T, et al. The natural history of insomnia in the Ibadan study of ageing. Sleep. 2011;34(7):965–973. [DOI] [PMC free article] [PubMed] [Google Scholar]
- 18. Morgan K, Clarke D. Risk factors for late-life insomnia in a representative general practice sample. Br J Gen Pract. 1997;47(416):166–169. [PMC free article] [PubMed] [Google Scholar]
- 19. Yang HC, Suh S, Kim H, et al. Testing bidirectional relationships between marital quality and sleep disturbances: a 4-year follow-up study in a Korean cohort. J Psychosom Res. 2013;74(5):401–406. [DOI] [PubMed] [Google Scholar]
- 20. Phelan CH, Love GD, Ryff CD, et al. Psychosocial predictors of changing sleep patterns in aging women: a multiple pathway approach. Psychol Aging. 2010;25(4):858–866. [DOI] [PMC free article] [PubMed] [Google Scholar]
- 21. Fok M, Stewart R, Besset A, et al. Incidence and persistence of sleep complaints in a community older population. Int J Geriatr Psychiatry. 2010;25(1):37–45. [DOI] [PubMed] [Google Scholar]
- 22. Foley DJ, Monjan AA, Izmirlian G, et al. Incidence and remission of insomnia among elderly adults in a biracial cohort. Sleep. 1999;22(suppl 2):S373–S378. [PubMed] [Google Scholar]
- 23. Spira AP, Chen-Edinboro LP, Wu MN, et al. Impact of sleep on the risk of cognitive decline and dementia. Curr Opin Psychiatry. 2014;27(6):478–483. [DOI] [PMC free article] [PubMed] [Google Scholar]
- 24. Lim MM, Gerstner JR, Holtzman DM. The sleep-wake cycle and Alzheimer's disease: what do we know. Neurodegener Dis Manag. 2014;4(5):351–362. [DOI] [PMC free article] [PubMed] [Google Scholar]
- 25. Krueger JM, Obál FJ, Fang J, et al. The role of cytokines in physiological sleep regulation. Ann NY Acad Sci. 2001;933:211–221. [DOI] [PubMed] [Google Scholar]
- 26. Kaushal N, Ramesh V, Gozal D. TNF-α and temporal changes in sleep architecture in mice exposed to sleep fragmentation. PLoS One. 2012;7(9):e45610. [DOI] [PMC free article] [PubMed] [Google Scholar]
- 27. Krueger JM. The role of cytokines in sleep regulation. Curr Pharm Des. 2008;14(32):3408–3416. [DOI] [PMC free article] [PubMed] [Google Scholar]
- 28. Orwoll E, Blank JB, Barrett-Connor E, et al. Design and baseline characteristics of the Osteoporotic Fractures in Men (MrOS) Study—a large observational study of the determinants of fracture in older men. Contemp Clin Trials. 2005;26(5):569–585. [DOI] [PubMed] [Google Scholar]
- 29. Blank JB, Cawthon PM, Carrion-Petersen ML, et al. Overview of recruitment for the Osteoporotic Fractures in Men Study (MrOS). Contemp Clin Trials. 2005;26(5):557–568. [DOI] [PubMed] [Google Scholar]
- 30. Blackwell T, Yaffe K, Ancoli-Israel S, et al. Association of sleep characteristics and cognition in older community-dwelling men: the MrOS Sleep Study. Sleep. 2011;34(10):1347–1356. [DOI] [PMC free article] [PubMed] [Google Scholar]
- 31. Blackwell T, Ancoli-Israel S, Redline S, et al. Direct comparison of two models of ActiGraphs. The MrOS Sleep Study [abstract]. Sleep. 2013;36(suppl):A411–A412. [Google Scholar]
- 32. Blackwell T, Ancoli-Israel S, Gehrman PR, et al. Actigraphy scoring reliability in the study of osteoporotic fractures. Sleep. 2005;28(12):1599–1605. [DOI] [PubMed] [Google Scholar]
- 33. Washburn RA, Smith KW, Jette AM, et al. The Physical Activity Scale for the Elderly (PASE): development and evaluation. J Clin Epidemiol. 1993;46(2):153–162. [DOI] [PubMed] [Google Scholar]
- 34. Yesavage JA, Sheikh JI. Geriatric Depression Scale (GDS): recent evidence and development of a shorter version. Clin Gerontol. 1986;5(1-2):165–173. [Google Scholar]
- 35. Aikman GG, Oehlert ME. Geriatric Depression Scale. Clin Gerontol. 2001;22(3-4):63–70. [Google Scholar]
- 36. Almeida OP, Almeida SA. Short versions of the geriatric depression scale: a study of their validity for the diagnosis of a major depressive episode according to ICD-10 and DSM-IV. Int J Geriatr Psychiatry. 1999;14(10):858–865. [DOI] [PubMed] [Google Scholar]
- 37. Yesavage JA, Brink TL, Rose TL, et al. Development and validation of a geriatric depression screening scale: a preliminary report. J Psychiatr Res. 1982-1983;17(1):37–49. [DOI] [PubMed] [Google Scholar]
- 38. Goldberg D, Bridges K, Duncan-Jones P, et al. Detecting anxiety and depression in general medical settings. BMJ. 1988;297(6653):897–899. [DOI] [PMC free article] [PubMed] [Google Scholar]
- 39. Teng EL, Chui HC. The Modified Mini-Mental State (3MS) Examination. J Clin Psychiatry. 1987;48(8):314–318. [PubMed] [Google Scholar]
- 40. Lewis RF, Rennick P. Manual for the Repeatable Cognitive-Perceptual-Motor Battery. Grosse Point Park, MI: Axon Publishing; 1979. [Google Scholar]
- 41. Reitan RM. Validity of the Trail Making Test as an indicator of organic brain damage. Percept Mot Skills. 1958;8(3):271–276. [Google Scholar]
- 42. Fitti JE, Kovar MG. The supplement on aging to the 1984 National Health Interview Survey. Vital Health Stat 1. 1987;(21):1–115. [PubMed] [Google Scholar]
- 43. Pincus T, Summey JA, Soraci SA Jr, et al. Assessment of patient satisfaction in activities of daily living using a modified Stanford Health Assessment Questionnaire. Arthritis Rheum. 1983;26(11):1346–1353. [DOI] [PubMed] [Google Scholar]
- 44. Pahor M, Chrischilles EA, Guralnik JM, et al. Drug data coding and analysis in epidemiologic studies. Eur J Epidemiol. 1994;10(4):405–411. [DOI] [PubMed] [Google Scholar]
- 45. Smagula SF, Ancoli-Israel S, Barrett-Connor E, et al. Inflammation, sleep disturbances, and depressed mood among community-dwelling older men. J Psychosom Res. 2014;76(5):368–373. [DOI] [PMC free article] [PubMed] [Google Scholar]
- 46. Benjamini Y, Hochberg Y. Controlling the false discovery rate: a practical and powerful approach to multiple testing. J R Stat Soc Series B Stat Methodol. 1995;57(1):289–300. [Google Scholar]
- 47. Rosano C, Aizenstein HJ, Newman AB, et al. Neuroimaging differences between older adults with maintained versus declining cognition over a 10-year period. NeuroImage. 2012;62(1):307–313. [DOI] [PMC free article] [PubMed] [Google Scholar]
- 48. Ge Y, Grossman RI, Babb JS, et al. Age-related total gray matter and white matter changes in normal adult brain. Part I: volumetric MR imaging analysis. AJNR Am J Neuroradiol. 2002;23(8):1327–1333. [PMC free article] [PubMed] [Google Scholar]
- 49. Awad IA, Spetzler RF, Hodak JA, et al. Incidental subcortical lesions identified on magnetic resonance imaging in the elderly. I. Correlation with age and cerebrovascular risk factors. Stroke. 1986;17(6):1084–1089. [DOI] [PubMed] [Google Scholar]
- 50. Taki Y, Thyreau B, Kinomura S, et al. Correlations among brain gray matter volumes, age, gender, and hemisphere in healthy individuals. PLoS One. 2011;6(7):e22734. [DOI] [PMC free article] [PubMed] [Google Scholar]
- 51. Herrmann LL, Le Masurier M, Ebmeier KP. White matter hyperintensities in late life depression: a systematic review. J Neurol Neurosurg Psychiatry. 2008;79(6):619–624. [DOI] [PubMed] [Google Scholar]
- 52. Selmaj KW, Raine CS. Tumor necrosis factor mediates myelin and oligodendrocyte damage in vitro. Ann Neurol. 1988;23(4):339–346. [DOI] [PubMed] [Google Scholar]
- 53. Buysse DJ. Sleep health: can we define it? Does it matter. Sleep. 2014;37(1):9–17. [DOI] [PMC free article] [PubMed] [Google Scholar]
Associated Data
This section collects any data citations, data availability statements, or supplementary materials included in this article.