

Abstract
Increased filaggrin expression was found to be correlated with severity scores in chronic spontaneous urticaria (CSU); however, the role of filaggrin breakdown products (FBPs) in CSU has not been studied. We collected stratum corneum (SC) specimens from the volar forearms of 10 CSU patients, 10 AD patients, and 10 healthy normal controls (NCs) and measured contents of FBPs (pyrrolidone carboxylic acid [PCA] and urocanic acid [UCA]) using UPLC-MS/MS, transepidermal water loss (TEWL) and epidermal pH. Compared to NCs, cis-UCA level was increased in CSU lesions (P < 0.05) and decreased in AD lesions (P < 0.01). The cis-to-trans-UCA ratio in SC specimens from CSU patients was significantly greater than those from AD and NC subjects. AD lesions had lower FBP and PCA contents compared to NC skin (both P < 0.001), and higher TEWL and pH compared to CSU lesions. Moreover, cis-UCA, but not trans-UCA, enhanced the IgE-mediated basophil activation, as well as IgE- and calcium-mediated degranulation of LAD-2 cells, in a dose-dependent manner. These findings suggest that increased cis-to-trans UCA ratio in the epidermis is a distinct feature of CSU, which could enhance mast cell degranulation. Modulation of cis-UCA may be a potential target for skin diseases associated with IgE-mediated mast cell degranulation.
Introduction
Chronic spontaneous urticaria (CSU) is defined as the repeated occurrence of transient (less than 24 hours) wheals and/or angioedema for at least 6 weeks without an eliciting cause1. Recent guidelines recommend identification and avoidance of the underlying causes of chronic urticaria (CU) as the main goal of treatment1. However, in the majority of patients, finding and eliminating the causes of CSU are difficult. Although the pathogenic mechanism of CSU has yet to be completely elucidated, the main pathophysiology involves the activation of mast cells and basophils. The release of mast cell mediators induces inflammation and the activation of other inflammatory cells, such as eosinophils, neutrophils, and T cells2.
Chronic urticaria is a heterogeneous disease with various phenotypes. Each subset may be associated with various triggers and different pathways of immune activation. In addition to the 45% of patients with autoimmune features, 55% of CSU patients have unidentified specific inducers for mast cell degranulation and associated inflammation3. Accordingly, standard treatment with antihistamines is often ineffective, as around 40% of CU patients show poor response to antihistamines4–6. Moreover, therapeutic responses to anti-IgE antibody treatment also differ among patients7. Thus, the development of suitable biomarkers may help identify patients who would benefit from early application of precision medicine approaches.
Previously, we documented upregulated expression of filaggrin at both mRNA and protein levels in the skin of CSU patients, compared to skin from atopic dermatitis (AD) patients8. AD is associated with decreased filaggrin expression, resulting from abnormalities in the terminal differentiation of the epidermis and filaggrin gene mutation, leading to enhanced allergen penetration, systemic IgE sensitisation, and recurrent microbial infection9. Some clinical features (e.g., itching) and histological characteristics (e.g., infiltration of T lymphocytes, eosinophils, and mast cells into skin lesions) are shared between CSU and AD10, 11; however, eczema is the cutaneous manifestation of AD and transient wheals and/or angioedema are specific cutaneous manifestations in CSU.
In a previous study, we reported a significant association between epidermal filaggrin expression and urticaria severity. Additionally, the filaggrin breakdown product (FBP), cis-urocanic acid (UCA) was found to enhance mast cell degranulation in a mouse model12.
Therefore, in the present study, we sought to compare the levels of FBPs, including pyrrolidone carboxylic acid (PCA) and the two isomers of UCA (cis- and trans-UCA), in skin from patients with CSU and AD in comparison to healthy normal controls (NCs). Furthermore, we attempted to outline the biologic roles of FBPs in the pathogenesis of CSU.
Results
TEWL and epidermal pH differ between patients with CSU and AD
Table 1 lists the TEWL amounts and skin pHs of the study subjects. Both TEWL (12.9 ± 4.2) and pH (5.1 ± 0.4) were significantly lower in CSU lesional skin than in the lesional skin from AD patients (29.7 ± 16.3, P < 0.001 and 5.5 ± 0.3, P = 0.023; respectively).
Table 1.
Clinical characteristics of the study groups.
| NC (n = 10) | CSU (n = 10) | AD (n = 10) | P value | ||
|---|---|---|---|---|---|
| CSU vs. AD | CSU vs. NC | ||||
| Age (years) * | 39.5 ± 5.3 | 37.2 ± 10.1 | 25.3 ± 4.0 | 0.01 | 0.631 |
| Women | 6 (60%) | 3 (30%) | 3 (30%) | 1.00 | 0.370 |
| Atopy (%) | 0 | 9 (90%) | 9 (90%) | 1.00 | <0.001 |
| Total IgE (KU/L) ‡ | 0.014 (0.008, 0.042) | 0.22 (0.096, 0.362) | 2.37 (0.45, 5.00) | 0.015 | 0.028 |
| UAS-Ye (0–15) * | na | 10.8 ± 2.0 | na | na | na |
| SCORAD * | na | na | 25.8 ± 5.8 | na | na |
| TEWL (g/h/m 2 ) * | |||||
| Non-lesional | 10.9 ± 2.6 | 8.6 ± 2.8 | 11.7 ± 3.6 | 0.043 | 0.089 |
| Lesional | na | 12.9 ± 4.2 | 29.7 ± 16.3 | <0.001 | na |
| Histamine | 10.9 ± 1.8 | 13.6 ± 5.7 | na | na | 0.089 |
| Epidermal pH * | |||||
| Non-lesional | 5.5 ± 0.5 | 4.9 ± 0.4 | 5.4 ± 0.3 | 0.017 | 0.011 |
| Lesional | na | 5.1 ± 0.4 | 5.5 ± 0.3 | 0.023 | na |
| Histamine | 5.6 ± 0.3 | 5.2 ± 0.2 | na | na | 0.123 |
Histamine, histamine-induced wheals; NC, normal controls; AD, atopic dermatitis; CSU, chronic spontaneous urticaria; UAS, urticaria activity score; SCORAD, scoring atopic dermatitis; TEWL, transepidermal water loss; na, not available. *Values given are the mean ± S.D. ‡Values given are the median (25th percentile, 75th percentile). P values were obtained by the Mann-Whitney u test (continuous variables) and Fisher’s exact test (categorical variables).
Non-lesional skin from the CSU group had a lower TEWL and skin pH than non-lesional skin from the AD group (TEWL: 8.6 ± 2.8 vs. 11.7 ± 3.6, P = 0.043; pH: 4.9 ± 0.4 vs. 5.4 ± 0.3, P = 0.017; respectively), and had lower skin pH, compared to the NC skin (5.5 ± 0.5, P = 0.011). However, there was no difference in TEWL between non-lesional skin of CSU patients and NC skin.
Total FBPs in CSU skin are equal to those in NC skin, but higher than those in AD skin
We compared the quantities of FBPs in SC specimens, including PCA, cis-UCA, and trans-UCA, among the three study groups (Fig. 1). The total quantities of protein in lesional skins from the CSU and AD groups (0.54 ± 0.49 mg/mL and 0.29 ± 0.06 mg/mL) were not different from the NC group (0.26 ± 0.08 mg/mL) (Fig. 1a). The absolute concentrations of trans-UCA (Fig. S1, Supplementary document) in both lesional and non-lesional skin from CSU (P < 0.05) and AD subjects (P < 0.01) were significantly decreased compared to NC skin. The absolute concentrations of cis-UCA in CSU skin were significantly higher than those in AD (P < 0.001) and NC skin (P < 0.05).
Figure 1.
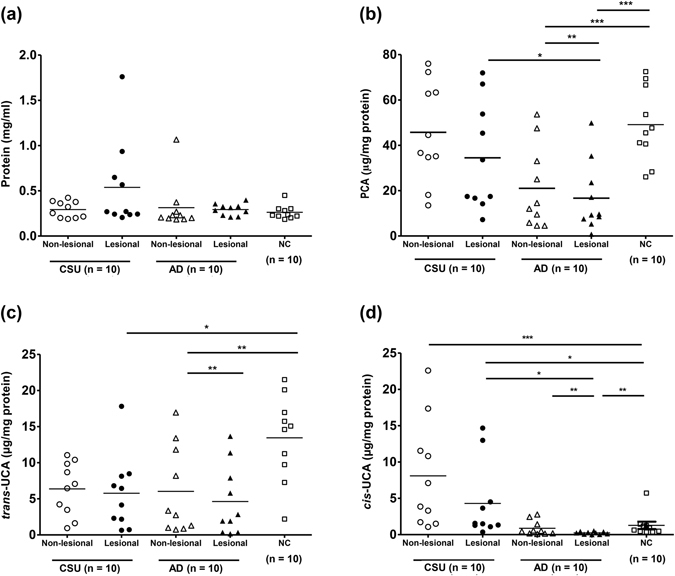
Concentrations of total protein (a) and filaggrin break down products, including PCA (b), trans-UCA (c), and cis-UCA (d), normalised to the quantity of protein from tape-stripped epidermal samples from study subjects. Horizontal lines in the middle of the dot plots indicate mean values. AD, atopic dermatitis; CSU, chronic spontaneous urticaria; Histamine, histamine-induced wheals; NC, normal control. *, **, *** P < 0.05, 0.01, 0.001, obtained by one-way ANOVA with Bonferroni’s post-hoc test.
After normalising for total protein content, PCA quantities (non-lesional: 45.72 ± 6.95, lesional: 34.48 ± 7.46 μg/mg protein) levels in CSU skin did not differ from those in NC skin (49.14 ± 5.16 μg/mg protein); however, PCA quantities in both were significantly higher than those found in AD skin (non-lesional: 21.02 ± 5.73 μg/mg protein, lesional: 16.70 ± 4.87 μg/mg protein; P < 0.05 for both). The quantity of trans-UCA (Fig. 1c) from NC skin specimens (13.44 ± 1.73 μg/mg protein) was significantly greater than those in CSU (non-lesional: 6.38 ± 1.16 μg/mg protein, lesional: 5.76 ± 1.63 μg/mg protein; P < 0.01 for both) and AD (non-lesional: 6.03 ± 1.92 μg/mg protein, P < 0.05; lesional: 4.62 ± 1.54 μg/mg protein, P < 0.01) skin specimens; there were no significant differences in trans-UCA level between the CSU and AD groups. The quantities of cis-UCA (Fig. 1d) in CSU skin (non-lesional: 8.09 ± 2.34 μg/mg protein, lesional: 4.29 ± 1.64 μg/mg protein) were significantly greater than those in AD (non-lesional: 0.88 ± 0.32, lesional: 0.24 ± 0.06 μg/mg protein; P < 0.001 for both) and NC (1.28 ± 0.51 μg/mg protein; P < 0.001 for lesional and P < 0.05 for non-lesional) skin.
Ratio of cis- to trans-UCA is increased in CSU skin
The differences in trans- and cis-UCA concentrations in SC specimens among the three study groups prompted us to investigate the potential use of cis-to-trans-UCA ratio in differentiating CSU from AD and NC subjects (Fig. 2). The cis-to-trans-UCA ratio in the SC specimens from CSU patients (non-lesional: 1.30 ± 0.69, lesional: 1.08 ± 0.76) was significantly higher than those in the specimens from AD patients (non-lesional: 0.34 ± 0.43, lesional: 0.26 ± 0.45, P < 0.01 for both) and NCs (0.14 ± 0.19; P < 0.001 for both non-lesional and lesional). However, no significant difference in cis-to-trans-UCA ratio was noted between the AD and NC groups.
Figure 2.
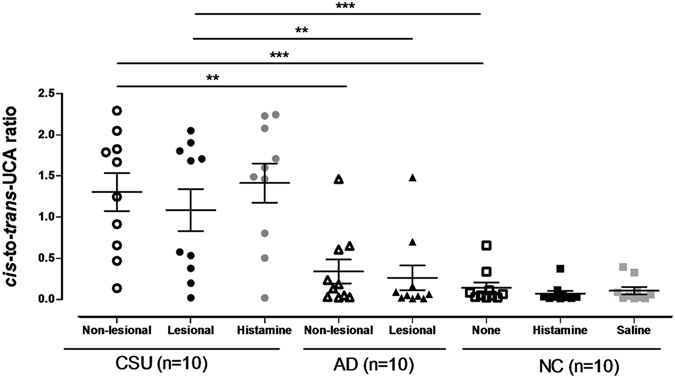
Ratio of cis- and trans-UCA measured in tape-stripped epidermal samples obtained from study subjects. Horizontal lines in the middle of the dot plots indicate mean values. AD, atopic dermatitis; CSU, chronic spontaneous urticaria; Histamine, histamine-induced wheals; NC, normal control. *, **, *** P < 0.05, 0.01, 0.001, obtained by one-way ANOVA with Bonferroni’s post-hoc test.
Figure 3 shows the diagnostic values of cis- to trans- UCA ratio in distinguishing CSU from AD patients, using receiver operating characteristic curve. The area under the curve (AUC) for cis-to trans-UCA ratio in lesional skins was 0.850 (P = 0.008) with a sensitivity of 90% and specificity of 80% at the cut-off value of 0.179. In non-lesional skin, the AUC was 0.89 (P = 0.003) with a sensitivity of 80% and specificity of 90% at the cut-off value of 0.653.
Figure 3.
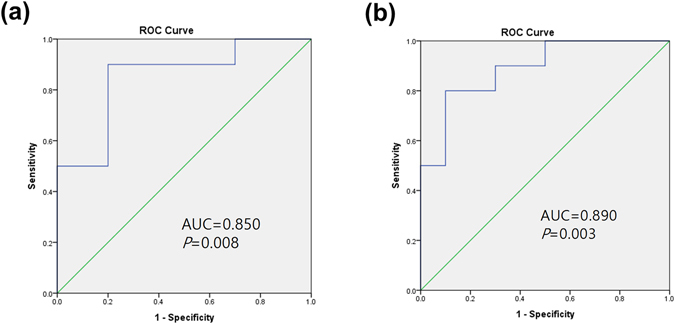
Diagnostic values of cis- to trans- UCA ratio in distinguishing CSU from AD patients, using receiver operating characteristic curve. Diagnostic values of cis-to trans-UCA ratio in (a) lesional skins and (b) non-lesional skins are shown. AUC, area under the curve.
FBPs may contribute to differences in the physiological functions of CSU and AD skin
To investigate whether FBPs in the skin influence the physiological function of the epidermis or disease activity, we assessed associations between FBPs, skin pH, TEWL, and the disease-activity scores of CSU and AD patients. Significantly negative correlations between FBP quantities and TEWL were observed in both lesional (Spearman’s rho = −0.553, P = 0.011) and non-lesional (Spearman’s rho = −0.739, P < 0.001) SC specimens for all CSU and AD patients. However, no significant correlation was noted between FBPs and pH in either lesional or non-lesional SC specimens from CSU and AD patients.
In the CSU group, there was no significant correlation of FBP quantities with pH or UAS-Ye; however, the pH of lesional skin was positively correlated with UAS-Ye (Spearman’ rho = 0.859, P = 0.001). Meanwhile, in the AD group, the quantities of PCA and trans-UCA in lesional skin were negatively correlated with both pH (Spearman’ rho = −0.648, P = 0.043 and r = −0.729, P = 0.017; respectively) and TEWL (Spearman’ rho = −0.650, P = 0.042 and r = −0.709, P = 0.022; respectively). In addition, the cis-to-trans-UCA ratio in AD lesional skin was significantly correlated with SCORAD scores (Spearman’ rho = 0.644, P = 0.044).
Cis-UCA, but not trans-UCA, enhances basophil activation upon IgE stimulation
To investigate whether the two UCA isomers have different biological influences on IgE-mediated basophil activation, we performed basophil activation tests with basophils from eight atopic CSU patients. As previously described in the literature and in our preliminary experiments, CD203c had a superior sensitivity than CD63 in evaluating basophil activation13–15. Consequently, we measured the expression of CD203c on basophils after incubation with cis- or trans-UCA (Fig. 4). Cis- and trans-UCA at the tested concentrations did not induce cell death (data not shown). Pre-treatment of human peripheral blood basophils with cis-UCA (100 µg/mL) significantly enhanced the expression of CD203c upon stimulation with IgE (P = 0.017), which was not observed in basophils pre-treated with trans-UCA. Without IgE stimulation, neither cis- or trans-UCA affected CD203c expression on basophils.
Figure 4.
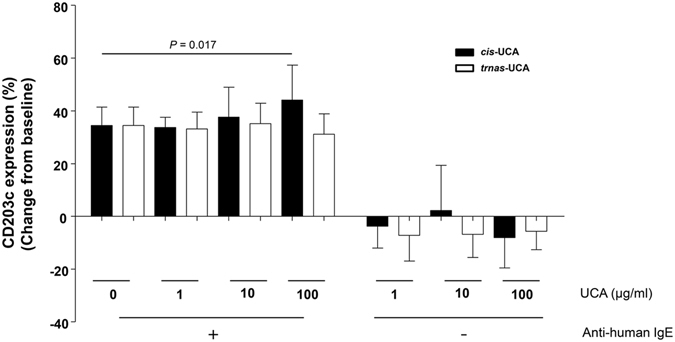
Effects of cis- and trans-UCA on peripheral blood basophil activation. Basophils from eight atopic subjects were treated simultaneously with cis- and trans-UCA and with anti-IgE stimulation. Basophil activation was measured by surface CD203c expression using flow cytometry. Changes in the percentages of CD203c expressing basophils from baseline (34.5 ± 7%), where neither anti-human IgE nor UCA was treated, are presented. P values were obtained by the Wilcoxon signed-ranks test.
Cis-UCA enhances degranulation of LAD-2 cells via both IgE-mediated and calcium-mediated pathways
To investigate the effect of UCA on LAD-2 cell degranulation via the IgE-mediated pathway, the cells were treated with cis- or trans-UCA simultaneously with IgE sensitisation for 16 h. Upon stimulation, the IgE-primed LAD-2 cells treated with cis-UCA (100 µg/mL) released a significantly higher quantity of beta-hexosaminidase, compared with untreated cells and cells treated with an equal concentration of trans-UCA (both P < 0.001, Fig. 5a and Fig. S2a, Supplementary document). Consistently, cis-UCA enhanced beta-hexosaminidase release from IgE-unprimed LAD-2 cells stimulated with calcium ionophore; moreover, it did so in a dose-dependent manner, which was not observed in trans-UCA treated cells (Fig. 5b and Fig. S2b, Supplementary document). Neither cis- nor trans-UCA affected the expression of FcεRI alpha on LAD-2 cells (assessed by flow cytometry, Fig. S3, Supplementary document). Moreover, we failed in detecting the secretion of inflammatory mediators, including IL-6 and TNFα from LAD-2 cells (assessed by ELISA). The tested concentrations of cis and trans-UCA did not induce cell death (data not shown).
Figure 5.
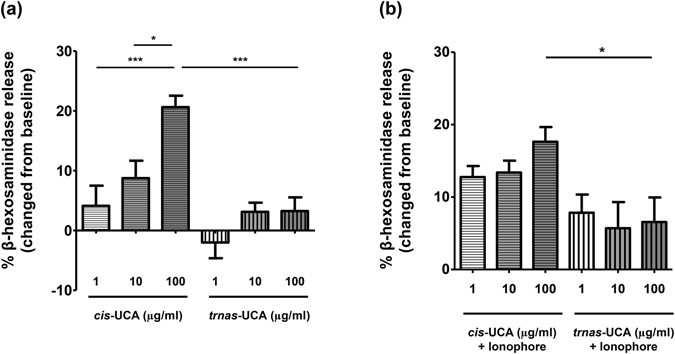
Effect of cis- and trans-UCA on IgE-mediated (a) and calcium-mediated (b) degranulation of LAD-2 cells. Mast cell degranulation levels were investigated using the beta-hexosaminidase release test. The control comprised LAD-2 cells sensitised with IgE and stimulated with streptavidin peroxidase (a) or only stimulated with calcium ionophore (b) without UCA pre-treatment, which yielded 57.5 ± 6.9% and 68.9 ± 9.6% of beta-hexosaminidase release; respectively. *, ***P < 0.05, 0.001, obtained by one-way ANOVA with Bonferroni’s post-hoc test.
Discussion
Previously, we demonstrated increased filaggrin expression in lesional CSU skin at both the mRNA (using quantitative PCR) and protein levels (using immunohistochemistry)8. To verify our speculation that increased filaggrin expression leads to increased FBP production, we measured the quantities of PCA and cis- and trans-UCA in tape-stripped skin specimens from patients with CSU and AD, as well as in NCs. The AD patients showed significantly lower quantities of PCA and total UCA in SC specimens, compared to the NCs; however, the quantities of these substances in the CSU patients did not differ from those in the NC group. Notably, cis-to-trans-UCA ratio was significantly higher in CSU skin than in both AD and NC skin. We also showed that cis-UCA, but not trans-UCA, significantly enhanced the activation of human basophils and the degranulation of human mast cells.
Filaggrin in the skin is degraded into its amino acid component, histidine, which is then converted to histamine by histidine decarboxylase or to trans-UCA by histidase16, 17. Trans-UCA is converted into cis-UCA by photoisomerisation when the skin is exposed to UV light8, 18. We hypothesised that increased filaggrin expression in CSU skin could lead to increased production of histidine and glutamine, resulting in increased synthesis of histamine, UCA, and PCA, respectively8. However, PCA and total UCA quantities in the skin of CSU patients and NCs were the same. Thus, we speculated that histidine in CSU skin is predominantly converted into histamine due to a high expression of histidine decarboxylase19, 20, leaving the expression of PCA and UCA unchanged. Additionally, a lower expression of filaggrin in AD skin8 likely explains the lower productions of PCA and UCA therein, compared to NC and CSU skin, as was observed in the present study. This result is linked clinically to a defect in epidermal barrier function in AD skin.
Interestingly, when we analysed the quantity of each UCA isoform normalised to total protein concentrations in SC specimens, trans-UCA levels were significantly decreased, whereas cis-UCA levels were significantly increased in the CSU group, compared to the NC group. Consistently, the absolute concentrations of cis-UCA were significantly higher in both the lesional and non-lesional skin of CSU patients in comparison to NC and AD skin. Moreover, cis-to-trans-UCA ratios for both lesional and non-lesional CSU skin were significantly higher than those for AD skin. Trans-UCA was the more prominent UCA isoform (contributing up to 80–90% of the total UCA concentration) in AD and NC skin, while cis-UCA was more abundant in CSU skin, accounting for 51.5% of the total UCA concentration in non-lesional and 44% of the total UCA concentration in lesional SC specimens. Notably, these ratios were not changed in histamine-induced wheals from CSU patients or NCs, suggesting a persistent increase in cis-UCA concentrations across CSU skin. In addition, cis- to trans-UCA ratio provided good diagnostic values with which to distinguish CSU from AD patients upon applying AUCs of 0.85 for ratio values in lesional skin and 0.89 for ratio values in non-lesional skin. The findings indicate that an increased concentration of cis-UCA alone and an increase in cis-to-trans-UCA ratio in SC specimens could be considered as potential diagnostic markers for distinguishing CSU patients from AD and NC subjects, even before lesions develop.
The underlying mechanisms for an increased cis-to-trans-UCA ratio in CSU skin have not been studied; however, the conversion between trans- and cis-UCA is known to be affected by the skin environment. In the present study and others, a significantly lower pH in CSU skin than in AD and NC skin was observed8. Meanwhile, the photoisomerisation of trans- to cis-UCA has been shown to be more efficient at a lower skin pH (3 to 5.5) than at a higher skin pH21, explaining the increased cis-to-trans-UCA ratio in CSU skin. Additionally, cis-UCA could be reversed to trans-UCA by cis-UCA isomerase produced by skin microbial flora, whose function may be affected by the skin pH22. The acidic environment noted in CSU skin, therefore, could prevent cis- to trans-UCA isomerisation, thereby leading to an accumulation of cis-UCA and an increased cis-to-trans-UCA ratio in CSU skin. In this context, we speculate that increased cis-UCA production in CSU skin may result from 1) an increased conversion of trans-UCA to cis-UCA and 2) a decreased conversion of cis-UCA back to trans-UCA, both are resulted from the acidic nature of CSU skin. Further studies investigating the underlying mechanisms of these phenomena are needed.
Additionally, we observed a higher TEWL and pH in the AD skin, compared to CSU and NC skin, which is consistent with previous findings8, 23. PCA and UCA are crucial to maintain epidermal hydration and the acidic environment of the skin16, 24. Consequently, decreases in PCA and UCA in AD skin result in impaired hydration and acidity, leading to increased TEWL and skin pH8, 23, 25. Also, we observed negative correlations for both PCA and trans-UCA with TEWL and pH in AD skin. Taken together, differences in the expressions of PCA and UCA in SC specimens from CSU and AD patients could explain the differences in TEWL and skin pH for these two disease phenotypes.
The dramatic increase in cis-to-trans-UCA ratio in CSU skin prompted us to investigate the role of cis-UCA in the pathomechanism of CSU we with a focus on basophil/mast cell activation, which has long been implicated in the pathogenesis of CSU26, 27. A previous in vivo study reported that cis-UCA at 1 µg/ml significantly induced degranulation of skin mast cells12. Several potential mechanisms may account for the in vivo degranulation effect of cis-UCA on mast cells: cis-UCA could induce prostaglandin E2 production, leading to prostaglandin E2 receptor-3-dependent mast cell degranulation28. Additionally, cis-UCA at approximately 1.38 mg/ml induces neuropeptide release from peripheral sensory nerves in the skin, which, in turn, elicits histamine release from mast cells29. In the present study, we observed that cis-UCA, but not trans-UCA, significantly enhanced human basophil activation, as well as beta-hexosaminidase release, from a human mast cell line (LAD-2) and that this was induced by IgE-mediated pathways. However, expression of a high-affinity receptor for IgE (FcεRI) on LAD-2 cells was not affected by either cis- or trans-UCA. This finding may suggest that cis-UCA could enhance mast cell and basophil degranulation in CSU patients regardless the underlying autoimmune mechanisms. Since intracellular calcium is an important signal for IgE-mediated mast cell degranulation, we investigated whether cis-UCA enhances LAD-2 cell degranulation mediated by the calcium signalling pathway. Interestingly, cis-UCA also boosted the degranulation of LAD-2 cells induced by calcium ionophore, a reagent that can increase intracellular Ca2+ concentrations by facilitating the transport of Ca2+ across the plasma membrane. Notably, in the absence of IgE and calcium ionophore, cis-UCA could not induce basophil activation or LAD-2 cell degranulation. Accordingly, these findings suggest that cis-UCA may enhance IgE-mediated activation of basophils and mast cells by facilitating calcium signalling. A previous study reported that cis-UCA could bind to and activate 5-hydroxytryptamine (5-HT) receptor, thereby inducing intracellular calcium mobilisation30. Additionally, human mast cells were found to express a variety of 5-HT receptors, and the activation of 5-HT receptors by 5-HT could increase mast cell migration and adherence, although degranulation was not observed31.
Studies suggest that anti-IgE monoclonal antibody downregulates the IgE-FcεRI-mast cell axis and may increase the threshold for mast cell activation since omalizumab was introduced for the treatment of CU32–36. Our present study demonstrates that cis-UCA was able to enhance histamine release from IgE-primed mast cells, but not from unprimed cells. We suggest that cis-UCA may be one of the autoreactive components or the final trigger that induces mast cell degranulation upon IgE stimulation. Accordingly, an increase in the epidermal cis-to-trans UCA ratio in patients whose mast cells and basophils are already primed by IgE may result in increased histamine release. Moreover, neutralisation of circulating IgE by omalizumab treatment may be able to diminish cis-UCA enhanced mast cell degranulation. Furthermore, an association between AD and a deficiency in skin FBP, which may lead to increased TEWL and skin pH, was found in our study. Although the cis-to-trans UCA was decreased in AD versus CSU skin, it correlated significantly with the disease activity score of patients with AD. Taken together, our findings are the first to demonstrate that an altered proportion of FBPs, particularly increased cis-UCA concentration, can enhance the degranulation of mast cells and basophils.
Several limitations were raised in the present study. Although the study subjects were enrolled within 3 months to avoid the influence of sunlight exposure, 10 participants in each group would not be sufficient to represent for the inter-individual variations of UCA concentrations in human skins. Filaggrin genetic mutations have been suggested as predisposing factors for approximately 25–50% of AD patients in previous studies9, 23; however, we were limited in analysing the associations of genetic polymorphisms of filaggrin in the present study. Additionally, we did not evaluate the cis-UCA content in the dermis where cutaneous mast cells exist; however, cis-UCA was found to diffuse freely to the deeper layer of the epidermis with a diffusion coefficient of 10−7 m2/sec37. We could not exclude the possibility of that increased mast cell degranulation leads to the elevated cis-UCA in the skin. A further study may be needed to address this issue by comparing the expression of cis- and trans-UCA in CSU skin before and after an appropriate treatment and between control and uncontrolled CSU groups.
In summary, the present study revealed novel findings related to the CSU pathomechanism, wherein cis-UCA may be crucial to increasing skin mast cell degranulation. In particular, we found that cis-to-trans UCA ratio in the epidermis, even in non-lesional skin, may be potential diagnostic markers to differentiate CSU from AD. We also report an association between AD and a deficiency in skin FBPs, which may lead to increased TEWL and skin pH in AD patients.
Methods
Study subjects
Koreans, aged 20–70 years, recruited at Ajou University Hospital, Suwon, South Korea, were enrolled in this study from March to May 2014. We evaluated urticaria activity score (UAS-Ye) modified from the UAS recommended by EAACI /GA2LEN/WAO38, which assesses the features of wheals (including quantity [0, no wheals; 1, <10 wheals; 2, 10–50 wheals; 3, >50 wheals], distribution [0, none; 1, <25% of the body surface area (BSA); 2, 25–50% of the BSA; 3, >50% of the BSA], mean diameter [0, no wheals; 1, <1 cm; 2, 1–3 cm; 3, >3 cm], and duration [0, no wheals; 1, <4 hr; 2, 4–12 hr; 3, >12 hr], and intensity of pruritus [0, no pruritus; 1, mild; 2, moderate; 3, severe]) within the last week for outpatient clinic visits, yielding a total score of 0–15. AD was defined according to typical clinical features compatible with the diagnostic criteria for AD suggested by Hanifin and Rajka39. The disease activity of AD was evaluated using the SCORing Atopic Dermatitis (SCORAD) as previously described40. Patients with CSU did not concomitantly had AD and vice versa.
Table 1 shows the clinical characteristics of the three study groups: 10 NCs (mean age, 39.5 ± 5.3 years) with no history of allergy and skin diseases, 10 patients with active CSU (mean age, 37.2 ± 10.1 years; mean urticaria activity score [UAS-Ye] 10.8 ± 2.0), and 10 patients with active AD (mean age, 25.3 ± 4.0 years; mean SCORAD, 25.8 ± 5.8). Atopy was defined by at least one positive skin prick test to common inhalant allergens41. Levels of total IgE in blood were measured using the ImmunoCAP system (Thermo-Fisher, Uppsala, Sweden) according to the manufacturer’s instructions. None of the subjects had previously received immunomodulators, including cyclosporine, methotrexate, and anti-IgE. Prior to enrolment, patients had stopped using topical and systemic corticosteroids, as well as topical calcineurin inhibitors, for at least 2 weeks; anti-histamine use was stopped for at least 5 days. None of the healthy controls used anti-histamines. The study was approved by the Institutional Review Board at the Ajou University Medical Center (AJIRB-MED-SMP-13-384, AJIRB-MED-OBS-14-358). All subjects provided written informed consent before participation and methods in this study were performed in accordance with the relevant guidelines and regulations.
To investigate the physiological function of the epidermis, transepidermal water loss (TEWL, Tewameter TM300) and skin surface pH (PH900) on the lesional skin of CSU and AD patients, as well as skin from NCs, were measured.
Sample preparation
Specimens of the stratum corneum (SC) were obtained using the tape-stripping method with D-squame standard tape (Cuderm, Dallas, TX, diameter, 2.2 cm). Six consecutive tape-stripped specimens were collected from the volar forearm of each subject. For patients with CSU, we collected specimens from both lesional and non-lesional skin on the volar forearm, as well as on histamine-induced wheals. Tape-stripped specimens were collected from both lesional and non-lesional AD skin, as well as from normal skin and histamine-induced wheals of NCs. The specimens were stored at −80 °C.
Measurement of protein and FBPs in tape-stripping samples
For protein quantification, six tape-stripped specimens were placed in glass vials containing 5 mL of 0.1% (w/v) sodium dodecyl sulphate/2% (w/v) propylene glycol in phosphate buffered saline (PBS) solution, and sonicated for 1 h to obtain soluble proteins. The solutions were then centrifuged at 12,000 rpm for 10 min at 4 °C. After collecting the supernatant, aliquots of the solution were used to quantify protein concentrations; soluble protein concentrations were assayed using a protein assay kit (Pierce, Rockford, IL). The sample plates were incubated for 30 min at 37 °C, after which absorbance was measured with a microplate reader (Spectramax190, MDA) at 595 nm.
With purified standards, FBPs, including PCA and cis- and trans-UCA, were quantitated using hydrophilic interaction liquid chromatography coupled with tandem mass spectrometry (HILC-MS/MS) for simultaneous determination, according to methods described previously42.
Basophil activation test with UCA
We recruited eight CSU patients who were sensitized with at least one common aeroallergen identified by a skin prick test (Bencard). Venous peripheral blood (10 mL) from each subject was collected into acid-citrate-dextrose containing tubes (BD Vacutainer, Franklin Lakes, NJ, USA), and analysed within 2 hr after collection. Red blood cells (RBC) were lysed in RBC lysis buffer (155 mM NH4Cl, 1 mM NaHCO3, 0.1 mM EDTA) for 10 min on ice, followed by washing with PBS. Cells were then resuspended in assay buffer (PBS containing 5% bovine serum albumin [BSA, Amresco, Solon, Ohio, USA]), and treated with cis- or trans-UCA (Sigma-Aldrich, St. Louis, MO, USA) dissolved in PBS, with or without stimulation with 1 μg/mL of goat-anti human IgE (KPL, Gaithersburg, MD, USA) for 30 min at 37 °C. Cells were washed once in PBS, resuspended in assay buffer, and incubated with PE-conjugated anti-human CD203c antibody (basophil activation surface marker), APC-conjugated anti-HLA-DR antibody, and FITC-conjugated anti-human CD123 antibody (BD Biosciences, San Jose, CA, USA) for 20 min at room temperature. Cells were washed once with PBS and analysed by flow cytometry using FACSDiva software, v6.0 (FACSCanto II, BD Biosciences). Basophils were identified as CD123+ HLA-DR− populations. The percentage of cells expressing CD203c was evaluated.
Mast cell degranulation induced by UCA
Laboratory of Allergic Disease 2 (LAD-2) mast cells were kindly provided by Dr. Arnold Kirshenbaum (National Institute of Allergy and Infectious Diseases, Bethesda, MD, USA). Cells were maintained in StemPro-34 medium (Life Technologies, Grand Island, NY, USA) supplemented with 2 mM L-glutamine, 100 U/mL penicillin, 50 μg/mL streptomycin, and 100 ng/mL recombinant human stem cell factor (R&D Systems, Minneapolis, MN, USA) as described previously43.
LAD-2 cell degranulation was evaluated by the β-hexosaminidase release test44. Cells were treated for 16 h with cis- or trans-UCA with or without simultaneous sensitisation with biotinylated-IgE (100 ng/mL, BioPorto Diagnostics, Hellerup, Denmark) (IgE-mediated and non-IgE mediated degranulation), followed by 30 min of stimulation with streptavidin peroxidase (100 ng/mL) or calcium ionophore A23187 (1 µM, Sigma) in Tyrode’s buffer containing 0.1% BSA. Total β-hexosaminidase was obtained by lysing LAD-2 cells in 0.1% Triton X-100 in PBS. The supernatants were collected and incubated with an equal volume of p-nitrophenyl N-acetyl-β-D-glucosamide (Sigma, 4 mM in citrate buffer) for 1 h. The reactions were stopped by adding 0.4 M glycine buffer, and the signals were read at 405 nM. The percentage of degranulation was calculated as 100 × (OD stimulated − OD unstimulated)/(OD total lysate − OD unstimulated).
Statistical analysis
Descriptive statistics are presented for all subjects included in the analysis. Categorical data are presented as numbers and percentages. Continuous data are presented as arithmetic means ± standard deviations or as medians (25th percentile, 75th percentile) when the distribution of the data was skewed. The diagnostic value of cis- to trans-UCA ratio to distinguish CSU from AD patients was evaluated by using receiver operating characteristic (ROC) curve.
Statistical analyses were conducted using Graph Pad Prism (ver. 4.03; San Diego, CA) and SPSS (ver. 19). Statistical differences between groups were determined using an unpaired t-test or Mann Whitney u test, and significance was defined as P < 0.05. In comparisons of the two patient groups with the control group, data were analysed by one-way ANOVA, and significant differences in multiple comparisons were determined with Bonferroni correction.
Electronic supplementary material
Acknowledgements
The authors are thankful to Prof. Sang Myun Park (Department of Pharmacology, Ajou University School of Medicine, Suwon, South Korea) for his professional supports in discussions. This work was supported by grants from the National Research Foundation of Korea, funded by the Korean Government (MSIP: NRF-2012R1A5A2048183).
Author Contributions
Pham D.L. performed experiments, participated in analyzing data and wrote the manuscript; Lim K.M. and Joo K.M. performed experiments and participated in analyzing data; Park H.S. participated in recruiting patient samples and revising manuscript; Leung D.Y.M. designed the study and revised the manuscript. Ye Y.M. designed the study, recruited patient samples, revised and approved the manuscript for submission.
Competing Interests
The authors declare that they have no competing interests.
Footnotes
Electronic supplementary material
Supplementary information accompanies this paper at doi:10.1038/s41598-017-01487-9
Publisher's note: Springer Nature remains neutral with regard to jurisdictional claims in published maps and institutional affiliations.
References
- 1.Zuberbier T, et al. The EAACI/GA(2) LEN/EDF/WAO Guideline for the definition, classification, diagnosis, and management of urticaria: the 2013 revision and update. Allergy. 2014;69:868–887. doi: 10.1111/all.12313. [DOI] [PubMed] [Google Scholar]
- 2.Ying S, Kikuchi Y, Meng Q, Kay AB, Kaplan AP. TH1/TH2 cytokines and inflammatory cells in skin biopsy specimens from patients with chronic idiopathic urticaria: comparison with the allergen-induced late-phase cutaneous reaction. J Allergy Clin Immunol. 2002;109:694–700. doi: 10.1067/mai.2002.123236. [DOI] [PubMed] [Google Scholar]
- 3.Maurer M, et al. Unmet clinical needs in chronic spontaneous urticaria. A GA(2)LEN task force report. Allergy. 2011;66:317–330. doi: 10.1111/j.1398-9995.2010.02496.x. [DOI] [PubMed] [Google Scholar]
- 4.Maurer M, et al. Omalizumab for the treatment of chronic idiopathic or spontaneous urticaria. N Engl J Med. 2013;368:924–935. doi: 10.1056/NEJMoa1215372. [DOI] [PubMed] [Google Scholar]
- 5.Kaplan A, et al. Omalizumab in patients with symptomatic chronic idiopathic/spontaneous urticaria despite standard combination therapy. J Allergy Clin Immunol. 2013;132:101–109. doi: 10.1016/j.jaci.2013.05.013. [DOI] [PubMed] [Google Scholar]
- 6.Ye YM, et al. Prognostic Factors for Chronic Spontaneous Urticaria: A 6-Month Prospective Observational Study. Allergy Asthma Immunol Res. 2016;8:115–123. doi: 10.4168/aair.2016.8.2.115. [DOI] [PMC free article] [PubMed] [Google Scholar]
- 7.Gericke J, et al. Serum autoreactivity predicts time to response to omalizumab therapy in chronic spontaneous urticaria. J Allergy Clin Immunol. 2017;139(1059–1061):e1051–1061.e1. doi: 10.1016/j.jaci.2016.07.047. [DOI] [PubMed] [Google Scholar]
- 8.Ye YM, Kim BE, Shin YS, Park HS, Leung DY. Increased epidermal filaggrin in chronic idiopathic urticaria is associated with severity of urticaria. Ann Allergy Asthma Immunol. 2014;112:533–538. doi: 10.1016/j.anai.2014.03.016. [DOI] [PMC free article] [PubMed] [Google Scholar]
- 9.Leung DY, Guttman-Yassky E. Deciphering the complexities of atopic dermatitis: shifting paradigms in treatment approaches. J Allergy Clin Immunol. 2014;134:769–779. doi: 10.1016/j.jaci.2014.08.008. [DOI] [PMC free article] [PubMed] [Google Scholar]
- 10.Bieber T. Atopic Dermatitis. Ann Dermatol. 2010;22:125–137. doi: 10.5021/ad.2010.22.2.125. [DOI] [PMC free article] [PubMed] [Google Scholar]
- 11.Kaplan, A. P. Chronic urticaria: pathogenesis and treatment. J Allergy Clin Immunol114, 465–474, doi:10.1016/j.jaci.2004.02.049, quiz 475 (2004). [DOI] [PubMed]
- 12.Wille JJ, Kydonieus AF, Murphy G. F. cis-urocanic acid induces mast cell degranulation and release of preformed TNF-alpha: A possible mechanism linking UVB and cis-urocanic acid to immunosuppression of contact hypersensitivity. Skin Pharmacol Appl Skin Physiol. 1999;12:18–27. doi: 10.1159/000029842. [DOI] [PubMed] [Google Scholar]
- 13.Abuaf N, et al. Comparison of two basophil activation markers CD63 and CD203c in the diagnosis of amoxicillin allergy. Clin Exp Allergy. 2008;38:921–928. doi: 10.1111/j.1365-2222.2008.02960.x. [DOI] [PubMed] [Google Scholar]
- 14.Boumiza R, et al. Marked improvement of the basophil activation test by detecting CD203c instead of CD63. Clin Exp Allergy. 2003;33:259–265. doi: 10.1046/j.1365-2222.2003.01594.x. [DOI] [PubMed] [Google Scholar]
- 15.Ozdemir SK, et al. Reliability of basophil activation test using CD203c expression in diagnosis of pollen allergy. Am J Rhinol Allergy. 2011;25:e225–231. doi: 10.2500/ajra.2011.25.3723. [DOI] [PubMed] [Google Scholar]
- 16.Sandilands A, Sutherland C, Irvine AD, McLean WH. Filaggrin in the frontline: role in skin barrier function and disease. J Cell Sci. 2009;122:1285–1294. doi: 10.1242/jcs.033969. [DOI] [PMC free article] [PubMed] [Google Scholar]
- 17.Baden HP, Pathak MA. The metabolism and function of urocanic acid in skin. J Invest Dermatol. 1967;48:11–17. doi: 10.1038/jid.1967.3. [DOI] [PubMed] [Google Scholar]
- 18.Gibbs NK, Tye J, Norval M. Recent advances in urocanic acid photochemistry, photobiology and photoimmunology. Photochem Photobiol Sci. 2008;7:655–667. doi: 10.1039/b717398a. [DOI] [PubMed] [Google Scholar]
- 19.Papadopoulou N, Kalogeromitros D, Staurianeas NG, Tiblalexi D, Theoharides TC. Corticotropin-releasing hormone receptor-1 and histidine decarboxylase expression in chronic urticaria. J Invest Dermatol. 2005;125:952–955. doi: 10.1111/j.0022-202X.2005.23913.x. [DOI] [PubMed] [Google Scholar]
- 20.Gutowska-Owsiak D, et al. The histamine-synthesizing enzyme histidine decarboxylase is upregulated by keratinocytes in atopic skin. Br J Dermatol. 2014;171:771–778. doi: 10.1111/bjd.13199. [DOI] [PubMed] [Google Scholar]
- 21.Laihia JK, Lemmetyinen H, Pasanen P, Jansen CT. Establishment of a kinetic model for urocanic acid photoisomerization. J Photochem Photobiol B. 1996;33:211–217. doi: 10.1016/1011-1344(95)07247-0. [DOI] [Google Scholar]
- 22.Hug DH, Dunkerson DD, Hunter JK. The degradation of L-histidine and trans- and cis-urocanic acid by bacteria from skin and the role of bacterial cis-urocanic acid isomerase. J Photochem Photobiol B. 1999;50:66–73. doi: 10.1016/S1011-1344(99)00072-X. [DOI] [PubMed] [Google Scholar]
- 23.Jung M, et al. Pyrrolidone carboxylic acid levels or caspase-14 expression in the corneocytes of lesional skin correlates with clinical severity, skin barrier function and lesional inflammation in atopic dermatitis. J Dermatol Sci. 2014;76:231–239. doi: 10.1016/j.jdermsci.2014.09.004. [DOI] [PubMed] [Google Scholar]
- 24.Brown SJ, McLean WH. One remarkable molecule: filaggrin. J Invest Dermatol. 2012;132:751–762. doi: 10.1038/jid.2011.393. [DOI] [PMC free article] [PubMed] [Google Scholar]
- 25.Jungersted JM, et al. Stratum corneum lipids, skin barrier function and filaggrin mutations in patients with atopic eczema. Allergy. 2010;65:911–918. doi: 10.1111/j.1398-9995.2010.02326.x. [DOI] [PubMed] [Google Scholar]
- 26.Niimi N, et al. Dermal mast cell activation by autoantibodies against the high affinity IgE receptor in chronic urticaria. J Invest Dermatol. 1996;106:1001–1006. doi: 10.1111/1523-1747.ep12338544. [DOI] [PubMed] [Google Scholar]
- 27.Smith CH, Kepley C, Schwartz LB, Lee TH. Mast cell number and phenotype in chronic idiopathic urticaria. J Allergy Clin Immunol. 1995;96:360–364. doi: 10.1016/S0091-6749(95)70055-2. [DOI] [PubMed] [Google Scholar]
- 28.Jaksic A, et al. Cis-urocanic acid synergizes with histamine for increased PGE2 production by human keratinocytes: link to indomethacin-inhibitable UVB-induced immunosuppression. Photochem Photobiol. 1995;61:303–309. doi: 10.1111/j.1751-1097.1995.tb03976.x. [DOI] [PubMed] [Google Scholar]
- 29.Khalil Z, Townley SL, Grimbaldeston MA, Finlay-Jones JJ, Hart P. H. cis-Urocanic acid stimulates neuropeptide release from peripheral sensory nerves. J Invest Dermatol. 2001;117:886–891. doi: 10.1046/j.0022-202x.2001.01466.x. [DOI] [PubMed] [Google Scholar]
- 30.Walterscheid JP, et al. Cis-urocanic acid, a sunlight-induced immunosuppressive factor, activates immune suppression via the 5-HT2A receptor. Proc Natl Acad Sci USA. 2006;103:17420–17425. doi: 10.1073/pnas.0603119103. [DOI] [PMC free article] [PubMed] [Google Scholar]
- 31.Ulbricht A, et al. Cellular mechanotransduction relies on tension-induced and chaperone-assisted autophagy. Curr Biol. 2013;23:430–435. doi: 10.1016/j.cub.2013.01.064. [DOI] [PubMed] [Google Scholar]
- 32.Asero R, et al. Current challenges and controversies in the management of chronic spontaneous urticaria. Expert Rev Clin Immunol. 2015;11:1073–1082. doi: 10.1586/1744666X.2015.1069708. [DOI] [PubMed] [Google Scholar]
- 33.Kaplan, A. et al. Timing and duration of omalizumab response in patients with chronic idiopathic/spontaneous urticaria. J Allergy Clin Immunol (2015). [DOI] [PubMed]
- 34.Saini S, et al. A randomized, placebo-controlled, dose-ranging study of single-dose omalizumab in patients with H1-antihistamine-refractory chronic idiopathic urticaria. J Allergy Clin Immunol. 2011;128(567–573):e561. doi: 10.1016/j.jaci.2011.06.010. [DOI] [PubMed] [Google Scholar]
- 35.Maurer M, et al. Efficacy and safety of omalizumab in patients with chronic urticaria who exhibit IgE against thyroperoxidase. J Allergy Clin Immunol. 2011;128(202–209):e205. doi: 10.1016/j.jaci.2011.04.038. [DOI] [PubMed] [Google Scholar]
- 36.Chang TW, et al. The potential pharmacologic mechanisms of omalizumab in patients with chronic spontaneous urticaria. J Allergy Clin Immunol. 2015;135:337–342. doi: 10.1016/j.jaci.2014.04.036. [DOI] [PubMed] [Google Scholar]
- 37.Krien PM, Moyal D. Sunscreens with broad-spectrum absorption decrease the trans to cis photoisomerization of urocanic acid in the human stratum corneum after multiple UV light exposures. Photochem Photobiol. 1994;60:280–287. doi: 10.1111/j.1751-1097.1994.tb05105.x. [DOI] [PubMed] [Google Scholar]
- 38.Ye YM, et al. Clinical evaluation of the computerized chronic urticaria-specific quality of life questionnaire in Korean patients with chronic urticaria. Clin Exp Dermatol. 2012;37:722–728. doi: 10.1111/j.1365-2230.2012.04414.x. [DOI] [PubMed] [Google Scholar]
- 39.Hanifin J, Rajka G. Diagnostic features of atopic eczema. Acta Dermatol Venereol (Stockh) 1980;92:44–47. [Google Scholar]
- 40.Wolkerstorfer A, de W van der Spek FB, Glazenburg EJ, Mulder PG, Oranje AP. Scoring the severity of atopic dermatitis: three item severity score as a rough system for daily practice and as a pre-screening tool for studies. Acta Derm Venereol. 1999;79:356–359. doi: 10.1080/000155599750010256. [DOI] [PubMed] [Google Scholar]
- 41.Palikhe S, Kim SH, Pham le D, Ye YM, Park HS. Association Between PTPN22 Polymorphisms and IgE Responses to Staphylococcal Superantigens in Chronic Urticaria. Allergy Asthma Immunol Res. 2015;7:290–294. doi: 10.4168/aair.2015.7.3.290. [DOI] [PMC free article] [PubMed] [Google Scholar]
- 42.Joo KM, et al. Rapid, simultaneous and nanomolar determination of pyroglutamic acid and cis-/trans-urocanic acid in human stratum corneum by hydrophilic interaction liquid chromatography (HILIC)-electrospray ionization tandem mass spectrometry. J Chromatogr B Analyt Technol Biomed Life Sci. 2012;897:55–63. doi: 10.1016/j.jchromb.2012.04.008. [DOI] [PubMed] [Google Scholar]
- 43.Kirshenbaum AS, et al. Characterization of novel stem cell factor responsive human mast cell lines LAD 1 and 2 established from a patient with mast cell sarcoma/leukemia; activation following aggregation of FcepsilonRI or FcgammaRI. Leuk Res. 2003;27:677–682. doi: 10.1016/S0145-2126(02)00343-0. [DOI] [PubMed] [Google Scholar]
- 44.Kuehn, H. S., Radinger, M. & Gilfillan, A. M. Measuring mast cell mediator release. Curr Protoc Immunol Chapter 7, Unit7 38, doi:10.1002/0471142735.im0738s91 (2010). [DOI] [PMC free article] [PubMed]
Associated Data
This section collects any data citations, data availability statements, or supplementary materials included in this article.