

Abstract
The mammalian kidney consumes a large amount of energy to support the reabsorptive work it needs to excrete metabolic wastes and to maintain homeostasis. Part of that energy is supplied via the metabolism of glucose. To gain insights into the transport and metabolic processes in the kidney, we have developed a detailed model of the renal medulla of the rat kidney. The model represents water and solute flows, transmural fluxes, and biochemical reactions in the luminal fluid of the nephrons and vessels. In particular, the model simulates the metabolism of oxygen and glucose. Using that model, we have identified parameters concerning glucose transport and basal metabolism that yield predicted blood glucose concentrations that are consistent with experimental measurements. The model predicts substantial axial gradients in blood glucose levels along various medullary structures. Furthermore, the model predicts that in the inner medulla, owing to the relatively limited blood flow and low tissue oxygen tension, anaerobic metabolism of glucose dominates.
Keywords: Anaerobic respiration, Glycolysis, Renal physiology
1 Introduction
A major function of the mammalian kidney is to produce urine, which serves as a vehicle for excreting metabolic waste products and for maintaining the balance of electrolytes, acid–base, and blood osmolality. In part to achieve that goal, the human and rodent kidneys receive approximately 20–25 % of the cardiac output. A portion of that blood passes through the renal filters (called the glomeruli) and enters long, narrow tubules (called the nephrons). Most of that filtrate is reabsorbed, so that only 1–2 L of urine is produced per day in humans. To support that reabsorptive process, the kidneys require a large amount of energy. Indeed, although the human kidneys constitute only 0.5%of body mass, they consume 10%of the oxygen used in cellular respiration.
Relative to its size, the amount of blood that the kidneys receive is large (20–25 % of cardiac output, as previously noted). Thus, the renal cortex (the outermost portion of the kidney) is well perfused, with an oxygen tension (PO2) of ~50 mmHg. However, in large part due to shunting of cortical blood flow, blood flow in the medulla (the innermost portion of the kidney) is low (Ganguli and Tobian 1974; Kramer et al. 1960; Stern et al. 1979). That blood flow must support the relatively high oxygen requirements of the medulla, which are primarily attributable to Na+/K+-ATPase-mediated active reabsorption of Na+.
Glucose molecules are sufficiently small to pass through the glomeruli. Except under pathophysiological conditions (e.g., diabetes or pregnancy), 100%of the filtered glucose is reabsorbed along the initial segment of the nephron (called the proximal tubule). Thus, tubular fluid entering the renal medulla contains virtually no glucose. Rather, glucose is supplied to the medulla via medullary blood flow. Glucose may be consumed via either aerobic or anaerobic metabolism. Aerobic metabolism requires oxygen and produces, via the Krebs cycle, carbon dioxide and ATP. In regions of the kidney where PO2 is sufficiently high, glucose is consumed as a fuel for respiration to support, tubular transport and basal metabolism. It is noteworthy, however, that the kidney also utilizes other fuels, such as fatty acids, endogenous lipids, ketone bodies, lactate, and some amino acids (Weidemann and Krebs 1969; Klein et al. 1980). When PO2 is sufficiently low, such as in the inner medulla where blood flow is further limited, glucose is metabolized to lactate via a process known as anaerobic glycolysis.
In separate studies, Thomas and Wexler (1995) and Zhang and Edwards (2006) investigated glucose transport and its conversion to lactate in the renal medullary circulation using simple models of vasa recta. In a follow-up study (Hervy and Thomas 2003), Hervy and Thomas used a more detailed model that explicitly represents renal tubules to investigate the impact of medullary glucose metabolism on the urine concentrating mechanism of the rat kidney. Because the focus of those studies was on the accumulation of lactate in the medulla, only anaerobic glycolysis was considered.
As previously noted, medullary blood and O2 supply are relatively limited. Thus, tissue PO2 in the outer and inner medulla is ~20 and 10 mmHg, respectively. One might therefore expect a significant fraction of the medullary glycolysis, especially in the inner medulla where PO2 is particularly low, to be anaerobic—but what fraction precisely? Anaerobic glycolysis is less efficient than its aerobic counterpart and produces lactate, the excessive accumulation of which may cause metabolic acidosis. To quantify aerobic versus anaerobic glucose metabolism, we develop a mathematical model of the medulla of the rat kidney that takes into account (i) the transport and consumption of both O2 and glucose and (ii) all types of glucose metabolism, including basal consumption and transport-driven consumption (both aerobic and anaerobic). Using that model, we conduct a more comprehensive investigation of renal metabolism.
The present model is based on our published models Fry et al. (2014, 2015) and Layton (2011a, b) which, in addition to detailed representation of tubular and vascular flows, also represent oxygen utilization and predict PO2 at different medullary levels in the rat kidney. More specifically, the model represents tubular reabsorption of Na+, as well as the consumption of O2 and glucose that drives that reabsorption. Whether that glucose is metabolized aerobically or anaerobically is determined based on local PO2. The model requires a large set of parameters, most of which were gleaned from experimental literature and were thoroughly tested in our earlier studies. However, some of the new model parameters, including the basal metabolic consumption rate of glucose and the descending vasa recta (DVR) permeability of glucose, are not well characterized. Thus, a goal of this study is to identify a set of model parameters that yield model predictions that are consistent with experimental measurements of tissue glucose concentration in the papillary tip.
2 Model Description
Our model is based on previously applied models of the urine concentrating mechanism, and oxygen transport and metabolism in the medulla of a rat kidney in an anti-diuretic state (i.e., water deprived) (Fry et al. 2014, 2015; Layton 2011a, b); those models are extended to include glucose transport and metabolism. The model is formulated for steady state. Represented in the model are vessels that supply the medulla (known as the vasa recta) and nephron segments found in the medulla: the loops of Henle and the collecting ducts. A schematic diagram is shown in Fig. 1. Given the key role of red blood cells (RBC) in oxygen transport and metabolism, which is a major focus of this work, the model separates blood flow in the vasa recta into two compartments: plasma and RBC. The RBC compartment is contained within the plasma compartment. The model predicts fluid flows in the tubules and vessels, which are represented as rigid tubes and interact via the interstitium. To simulate renal metabolism, the model represents O2 and glucose in the luminal fluid of each tubule and vessel, and in the interstitial fluid; in the red blood cells, nitrosyl-heme (HbNO), oxyhemoglobin (HbO2), and deoxyhemoglobin (Hb) are also represented. In addition, the model represents in all compartments (i) NaCl, because much of the renal oxygen consumption can be attributed to the metabolically driven reabsorption of NaCl, and (ii) urea, because of its substantial contribution to the osmotically driven reabsorption of water, especially in the inner medulla. Also represented are nitric oxide (NO) and superoxide ( ), which exert opposite effects on renal vascular and tubular function; the balance between the two significantly modulates renal oxygenation.
Fig. 1.
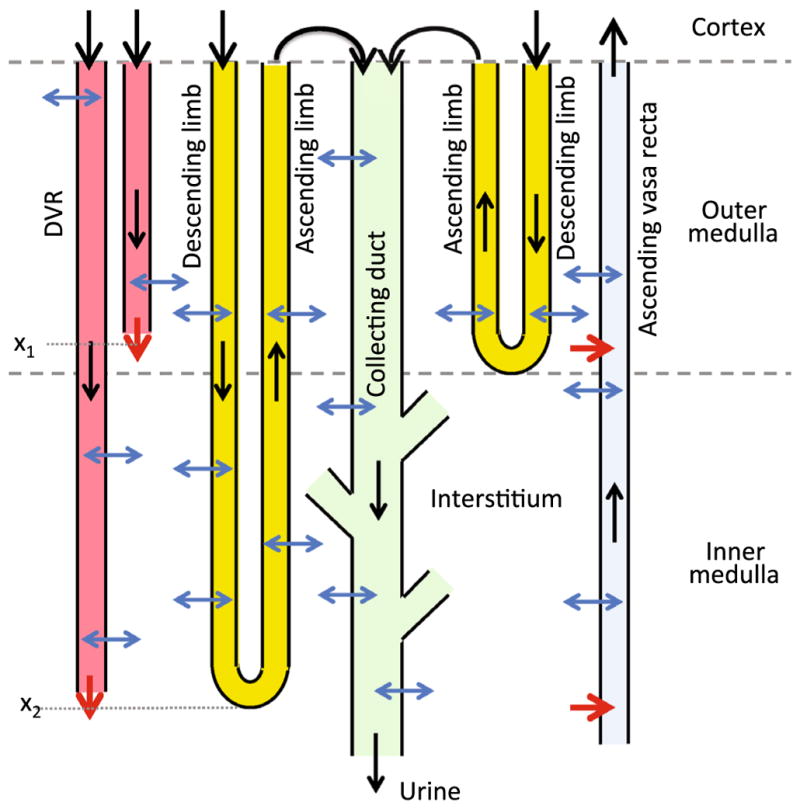
Schematic diagram of model structure. A short loop, which consists of a descending limb and a contiguous ascending limb and which turns at the outer–inner medullary boundary, is represented. The diagram also depicts a long loop that turns within the inner medulla (at x2) (Layton 2011a). Although only one long loop is shown, the model represents one long loop that turns at every spatial point in the inner medulla. Similarly, only two representative DVR are shown (with one terminating at x1 and one at x2), whereas the model represents one DVR that terminates at every spatial point. A representative collecting duct is shown; the “branches” represent the coalescence of the collecting ducts in the inner medulla (Layton 2011a). The black arrows at the cortico-medullary boundary represent boundary flows. The outflow of the ascending limbs determines the inflow of the collecting duct. The red arrows at the DVR outlets denote capillary sources at x1 and x2. The net fluid and solute accumulations at those medullary levels are taken up by the ascending vasa recta, as indicated by the red arrows pointing into the ascending vasa recta. The blue arrows represent transmural water and solute fluxes. Collecting duct outflow becomes urine (Color figure online)
2.1 Anatomy of the Renal Medulla
The renal medulla is divided into the outer and inner medullas, with the outer medulla further divided into the outer stripe and the inner stripe. The nephron segments that extend into the medulla are the loops of Henle and collecting ducts. Each loop of Henle consists of a descending limb and an ascending limb. Two-thirds of the model loops of Henle turn at the boundary of the outer and inner medulla, whereas the remaining one-third of the loops turn at all depths of the inner medulla. The longest loop extends through the entire renal medulla, from the cortico-medullary boundary (x = 0) to the papillary tip (x = L). As some of these loops turn, the loop population decreases as a function of medullary depth; for details see Layton (2011a).
The model collecting ducts extend from the cortico-medullary boundary to the papillary tip. Similar to the loops of Henle, the population of collecting ducts also decreases as a function of the inner medullary depth; unlike the loops which turn back at differing medullary levels, the collecting ducts undergo successive coalescences within the inner medulla. The fraction of collecting ducts remaining at a given medullary depth can be found in Layton (2011a).
As previously noted, blood flow in the vasa recta is separated into the plasma compartment and the RBC compartment. Each compartment is represented by rigid tubules extending along the cortico-medullary axis. DVR, which supply the capillary plexus, terminate at all depths of the medulla. The shortest DVR terminates just below the cortico-medullary boundary, and the longest one reaches into the papillary tip. The fraction of DVR that extend beyond medullary depth x is given by
| (1) |
where fSDV denotes the fraction of DVR that terminate within the outer medulla, taken to be 44/56; LOM, LIM, and LOS are the lengths of the model outer medulla, inner medulla, and outer stripe, respectively (given below). The DVR population is depicted in Fig. 2.
Fig. 2.

Fraction of DVR that extend beyond medullary depth. Medullary depth x = 2 mm corresponds to the inner–outer medullary boundary
The RBC and plasma compartments of the DVR interact similarly to how the tubules and interstitium interact; in particular, the flux of solutes (in particular, O2) between the two compartments is driven by local concentration differences (Jik (x) term in Eq. 3 below).
2.2 Model Equations
We present key equations for solute and water volumetric flow rates in the renal tubules and vasa recta; the equations are based on conservation of water and solutes. The full set of model equations can be found in Chen et al. (2009c), Edwards and Layton (2011) and Layton et al. (2012). Key processes involved in the conservation of water and solutes in the luminal flow of a tubule i in Fig. 3.
Fig. 3.
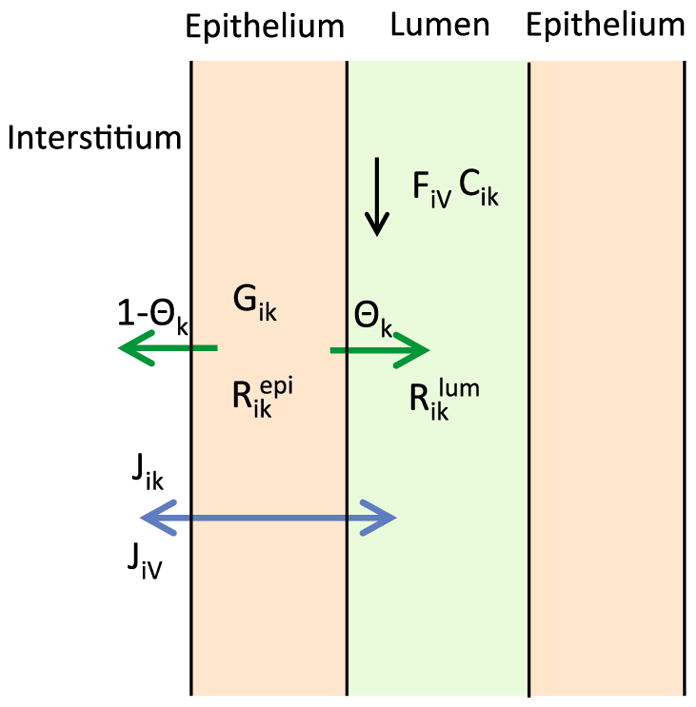
Schematic diagram showing key processes involved in the conservation of fluid and solutes in the luminal flow of a tubule i (Eqs. 2, 3). Lumen is surrounded by a layer of epithelial cells. Within the lumen, FiV denotes water flow and Cik denotes the concentration of solute k. Flow direction is indicated by the black arrow. The product FiV Cik gives solute flow rate. The net volumetric consumption rate of a reactive solute is denoted by within the lumen and by in the epithelia. The epithelial volumetric generation rate of the solute is denoted by Gik. A fraction θk of the net generation (or consumption) of the solute by the cells is directed into (or taken out of) the lumen and indicated by the green arrow; the remainder (1−θk) is directed into (or taken out of) the interstitium. Transmural water and solute fluxes are denoted by JiV and Jik, respectively, and by the blue arrow (Color figure online)
Water conservation for a renal tubule, or for the plasma or RBC compartment of a vessel, indexed i, is given by
| (2) |
where x is the position along the medulla; FiV denotes water volumetric flow rate; and JiV denotes transmural water flux, taken to be positive into the tubule. Water flux is assumed to be osmotically driven and the expression of JiV can be found in Layton (2011a).
The steady state conservation equation for a solute k in a renal tubule i is given by
| (3) |
where Cik is the concentration of solute k in tubule or vessel i ; Jik is the transmural solute flux, taken positive into the tubule; and are the cross-sectional areas of the lumen of tubule i and that of the surrounding epithelium, respectively; and are the volumetric consumption rates of solute k in the lumen of tubule i and that of the surrounding epithelium, respectively. For the non-reactive species (i.e., NaCl and urea), . The reactions associated with O2, NO, , HbNO, HbO2, and Hb have been previously described in published models (Chen et al. 2009c; Fry et al. 2014). Of note is that the majority of the oxygen delivered to the medulla is bound to hemoglobin in the RBCs, and we assume that the dissociation of HbO2 into O2 and Hb is described by a Hill equation dependent on the local O2 concentration. (The solute conservation equations for the RBC compartments are similar to Eq. 3, except most notably that the fluxes into the compartment are from the surrounding plasma, rather than the interstitium.) Gik is the epithelial volumetric generation rate of solute k. For the non-generative species (i.e., NaCl, urea, O2, HbNO, HbO2), Gik = 0. The generations associated with NO and have also been described in published models (Chen et al. 2009c; Fry et al. 2014). θk is the fraction of the amount of solute k generated in epithelia that diffuses toward (or away from) the lumen, with the remainder (1−θk) diffusing toward the interstitium. Except for glucose, θk = 0.5; i.e., we assume equal contributions from lumen and interstitium. For glucose, whose tubular luminal concentrations are almost 0, we assume that all the consumed glucose derives from the interstitium and set θG = 0. The consumption of glucose, which was not represented in previous models, will be described later in this section.
The model assumes that there is no axial flow along the interstitium. At a given medullary level, any net fluid accumulation in the interstitium, which arises from capillary source (from DVR) and from water reabsorbed from the renal tubules and vessels, is taken up by the ascending vasa recta (AVR). Water conservation is given by
| (4) |
where nAVR and nDVR denote the number of AVR and DVR, respectively, per nephron, taken to be 342/71 and 56/71, respectively (Layton and Layton 2005). The product nAVRQAVR denotes the amount of fluid taken up by the AVR. The first term on the right-hand-side represents capillary source, where −dwDVR/dx gives the rate at which the DVR terminate into capillaries at medullary level x. The second term denotes the net fluid reabsorption, given per nephron.
Similarly, solute conservation for the interstitium is given by
| (5) |
where Cint,k denotes the interstitial fluid concentration of solute k. The product nAVRQAVRCint,k denotes the amount of solute k taken up by the AVR. The first term on the right-hand-side represents the capillary source. The second term denotes the net reabsorption of solute k, and the third term Rint,k denotes its net generation, including contributions from tubules and vessels.
2.3 Oxygen Consumption
The model assumes that O2 consumption has two components, one attributable to basal metabolism and another to active NaCl transport. That is, for a given tubule, vessel, or interstitium,
| (6) |
The model represents basal O2 consumption by interstitial cells, vascular endothelial cells, RBC, and tubular epithelial cells. The volumetric rate of basal O2 consumption in tubule or vas rectum i is assumed to follow
| (7) |
where KM,O2 is an increasing function of local NO concentration (Fry et al. 2014), to account for the inhibitory effects of NO on mitochondrial utilization.
To compute , we must first determine active NaCl transport, which occurs along some tubular segments, including the proximal straight tubules (the outer stripe portion of the descending limbs), thick ascending limbs, and collecting ducts. A previous study (Fry et al. 2015) suggested that due to the nonlinear interactions among O2, NO, and , their respective effects on sodium transport cannot be considered in isolation. As such, the rate of active NaCl transport is assumed to depend on local concentration of O2 (or, equivalently, PO2), NO, and and is expressed assuming Michaelis–Menten kinetics as follows:
| (8) |
where Vmax,i,Na is the maximal rate of Na+ transport, KM,Na is the Michaelis constant (taken here to be 70mM, Greger et al. 1983), and the functions fact(Ci,O2), gact(Ci,NO), and represent the effects of O2, NO, and on the rate of active sodium reabsorption (Fry et al. 2014). The functions gact and hact are included here because our models have predicted that the effects of NO significantly contribute to maintaining sufficient medullary oxygenation, and that increased can lead to hypoxia (Fry et al. 2016, 2015).
When the medulla is sufficiently well oxygenated, active Na+ transport is not limited by O2 levels (Nelimarkka 1984). But as local PO2 falls below a certain threshold, aerobic transport decreases and is partially compensated by anaerobic metabolism. To describe this process, we set
| (9) |
where describes the capacity of the tubular segment i for anaerobic transport.
For a given tubule i, the O2 consumption rate arising from its active NaCl transport can be computed from a quantity known as TQi, which is defined as the number of moles of NaCl actively reabsorbed per mole of O2 consumed under maximum efficiency. With this notation,
| (10) |
where ri is the inner radius of tubule i, and Θ(Pi,O2) is the fraction of the Na+ active transport rate supported by aerobic respiration. We assume that below a certain threshold, aerobic respiration decreases linearly, so that Θ(Pi,O2) is given by
| (11) |
2.4 Glucose Consumption
Similar to the assumption made for O2, glucose consumption is assumed to consist of a component attributable to basal metabolism and another to active NaCl transport; i.e.,
| (12) |
This direct sum may be a slight oversimplification, as the basal and active rates of glucose consumption could potentially be interdependent; however, we are not aware of any experimental evidence to support a more complicated relationship.
The model represents basal glucose consumption in the tubular epithelium, vascular endothelium, and interstitium, given by
| (13) |
where KM,G is the Michaelis constant and is the maximum rate of glucose consumption. We assumed that the basal glucose consumption rate is a first-order Michaelis–Menten curve, as it is the simplest way to avoid unrealistic glucose concentrations (similar to Thomas 2000).
Glucose is consumed to support both aerobic and anaerobic active transport of Na+. For aerobic active Na+ transport [the proportion of which is Θ(Pi,O2)], the glucose consumption rate due to aerobic glycolysis is given by
| (14) |
where TQi,G,aerobic is the number of moles of Na+ transported per mole of glucose consumed. In aerobic respiration, 1 molecule of glucose reacts with 6 molecules of O2 to produce about 30 molecules of ATP (Rich 2003), 1 molecule of ATP is needed to transport 3 Na+ ions (and 2K+ ions), we assume here that TQi,G,aerobic = 30×3 = 90.
The proportion of the Na+ active transport supported by anaerobic metabolism is given by 1 − Θ(Pi,O2). As a result, the glucose consumption rate due to anaerobic glycolysis is given by
| (15) |
where TQi,G,anaerobic is the number of moles of Na+ transported per mole of glucose consumed. Since the consumption of 1 glucose molecule leads to 2 molecules of ATP via anaerobic respiration, and 1 ATP molecule is needed to transport 3 Na+ ions (and 2 K+ ions), we assume here that TQi,G,anaerobic = 2 × 3 = 6.
2.5 Model Parameters
Most morphological and transport parameters of the present model are taken from Layton (2011a), Chen et al. (2009b) and Fry et al. (2015). Below we describe parameters corresponding to active Na+ transport, O2 transport, and glucose transport, and selected parameters of particular importance in the present study. The axial lengths of the model outer and inner medulla are taken to be 2 and 5 mm, respectively; the lengths of the outer and inner stripes of the outer medulla are taken to be 0.6 and 1.4 mm, respectively. Key Na+, O2, and glucose transport parameters are shown in Table 1. All renal tubules (but not vessels) are assumed to be impermeable to glucose. Selected boundary concentrations and water flows for fluid entering descending limbs, collecting duct, and DVR are given in Table 2; additional boundary conditions can be found in Layton (2011a).
Table 1.
Na+, O2, and glucose transport parameters
| Parameters | Value |
|---|---|
| Na+ transport | |
| Maximum active Na+ transport rate (Vmax,i,Na) | |
| Proximal straight tubule | 2.1 nmol/cm2/s (Layton and Layton 2005) |
| Thick ascending limb (outer stripe) | 10.5 nmol/cm2/s (Layton and Layton 2005) |
| Thick ascending limb (inner stripe) | 25.9 nmol/cm2/s (Layton and Layton 2005) |
| Collecting duct (outer stripe) | 1.0 nmol/cm2/s (Layton and Layton 2005) |
| Collecting duct (inner stripe) | 1.6 nmol/cm2/s (Layton and Layton 2005) |
| Collecting duct (initial inner medulla) | 8.5 nmol/cm2/s (Layton 2011a) |
| Collecting duct (terminal inner medulla) | 3.0 nmol/cm2/s (Layton 2011a) |
| Tubular capacity for anaerobic transport ( ) | |
| Proximal straight tubule | 0.14 (Dickman and Mandel 1990) |
| Thick ascending limb | 0.1 (Bagnasco et al. 1985) |
| Outer medullary collecting duct | 0.5 (Uchida and Endou 1988; Zeidel et al. 1986) |
| Inner medullary collecting duct | 0.4 (Stokes et al. 1987) |
| O2 transport | |
| Maximum basal O2 consumption rate ( ) | 10 μM/s (Chen et al. 2009a) |
| PO2 threshold for aerobic respiration (Pi,c) | 10 mmHg (Fry et al. 2014) |
| Number of moles of Na+ transported per mole of O2 consumed (TQi) | |
| Proximal straight tubule | 18 (Nieves-Gonzalez et al. 2013; Weinstein 1998) |
| Thick ascending limb | 18 (Nieves-Gonzalez et al. 2013) |
| Collecting duct | 12 (Weinstein 1998) |
| Capillary and tubular wall O2 permeability | 0.04 cm/s (Chen et al. 2009c) |
| Glucose transport | |
| Maximum basal glucose consumption rate ( ) | 0.3 mM/s |
| Michaelis–Menten constant for basal glucose consumption (KM,G) | 0.1 mM |
| Number of moles of Na+ transported per mole of glucose consumed | |
| Aerobic (TQi,G,aerobic) | 90a |
| Anaerobic (TQi,G,anaerobic) | 6a |
| DVR wall glucose permeability | 5.0 × 10⁻⁵ cm/s (Zhang and Edwards 2006) |
| AVR wall glucose permeability | 1.0 × 10⁻⁵ cm/s (Zhang and Edwards 2006) |
| RBC membrane glucose permeability | 1.0 × 10⁻⁵ cm/s (Zhang and Edwards 2006) |
See text.
Table 2.
Boundary conditions for descending tubules and vessels at x = 0
| SDL | LDL | CD | DVR
|
||
|---|---|---|---|---|---|
| Plasma | RBC | ||||
| FV (nL/min) | 10 | 12 | 6.7 | 6 | 2 |
| PO2 (mmHg) | 36 | 36 | 36 | 60 | 60 |
| CHb (mM) | 0 | 0 | 0 | 0 | 3.0 |
| CHbO2 (mM) | 0 | 0 | 0 | 0 | 17.3 |
| CG (mM) | 0.001 | 0.001 | 0.001 | 5 | 5 |
| CNa (mM) | 160 | 160 | 75.4 | 163.7 | 163.7 |
SDL short descending limb, LDL long descending limb, CD collecting duct
3 Results
3.1 Base Case Results
The overall supply of O2 to the medulla is given by the total molar flow per nephron of O2 and HbO2 entering the descending limb, collecting ducts, and, most importantly, DVR at the cortico-medullary boundary. Given the in flow and fluid composition specified at the cortico-medullary boundary, overall medullary O2 supply is computed to be 27.9 pmol/min/nephron, 98.2 % of which is delivered by the RBC. Of that medullary O2 supply, the model predicts that 48.0 % (or, 13.4 pmol/min/nephron) is consumed in the outer medulla, 10.8 % (or, 3.0 pmol/min/nephron) is delivered to the inner medulla, and 8.60 % (or, 2.42 pmol/min/nephron) is consumed in the inner medulla. The model predicts a generally decreasing interstitial PO2 profile (shown in Fig. 4). That decreasing axial gradient, also observed in other medullary structures (results not shown), can be attributed, in large part, to the metabolically driven O2 consumption of the thick ascending limbs (in the outer medulla) and the collecting ducts (in the inner medulla).
Fig. 4.
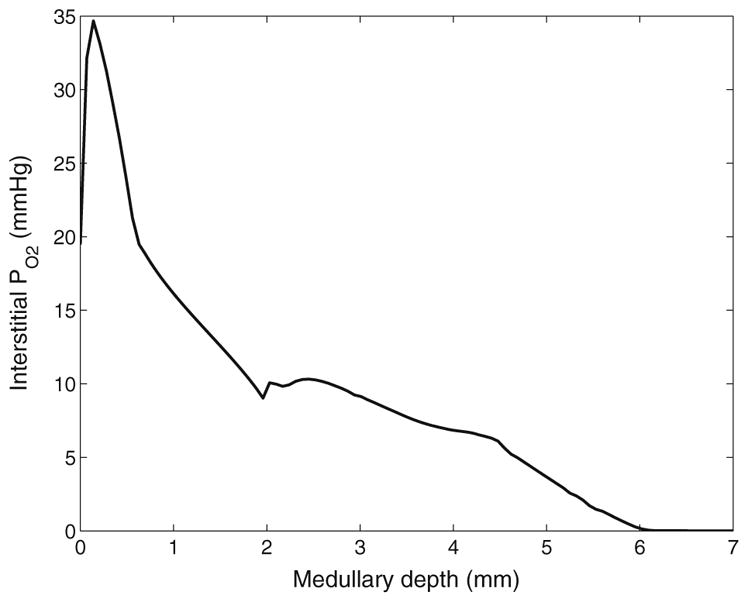
Interstitial fluid PO2 as a function of medullary depth, generated using baseline model parameters
The overall supply of glucose to the medulla is computed to be 31.6 pmol/min/ nephron, 75.0%of which is delivered by the DVR. Total DVR glucose flow decreases along the medulla, in part because DVR population steadily decreases as DVR peel off to supply the capillary plexus; see Fig. 5a. Predicted interstitial and DVR fluid glucose concentration profiles are shown in Fig. 5b. Unlike DVR glucose flow, which steadily decreases along the medullary axis, DVR glucose concentration is monotonic: it increases along the inner stripe, but decreases along the inner medulla. In the inner stripe, DVR luminal glucose concentration rises above its inflow value as more water than glucose is reabsorbed. In the inner medulla, where the interstitial fluid osmolality axial gradient is less steep compared to the inner stripe, glucose reabsorption from the DVR exceeds water reabsorption, resulting in a decreasing DVR glucose concentration profile.
Fig. 5.

a DVR glucose flow as a function of medullary depth. b interstitial and DVR fluid glucose concentration profiles. Medullary depth x = 0 mm corresponds to the cortico-medullary boundary; x = 0.6 mm, inner–outer strip boundary; x = 2 mm, inner–outer medullary boundary; x = 7 mm, papillary tip
Interstitial fluid glucose concentration is given, in part, by the balance of glucose supply (via capillaries) and glucose consumption (by tubular epithelia and vascular endothelia). The rate at which DVR terminate to supply the capillaries at a given medullary level is given by −dwDVR/dx (see Eq. 1). Within the outer medulla, the capillary plexus is denser in the inner stripe (lower 1.4mmof the outer medulla) than in the outer stripe (upper 0.6 mm); thus, the capillary source is higher in the inner stripe. This explains the steep rise in interstitial glucose concentration at the inner–outer stripe boundary (x = 0.6 mm, Fig. 5). A substantial fraction of the outer medullary glucose consumption can be attributed to active NaCl transport by the thick ascending limbs and, in the outer stripe, by the proximal straight tubules. Given these observations, the model predicts that the interstitial fluid glucose concentration is ~1.12–1.27 mM in the outer stripe and ~1.17–3.24 mM in the inner stripe. The two “dips” in the interstitial glucose concentration profile (Fig. 5) can be attributed to abrupt changes in tubular transport properties, and the resulting abrupt changes in glucose consumption and water reabsorption rates.
Basal and active glucose consumption can be determined by evaluating Eqs. (7) and (10), respectively. The model predicts that 22.2 % (or, 7.0 pmol/min/nephron) of the medullary glucose supply is consumed in the outer medulla, with active NaCl transport ( ) accounting for 3.86 pmol/min/nephron (63.7 % aerobic, 36.3 % anaerobic), and basal metabolism ( ) accounting for 3.14 pmol/min/nephron.
The model assumes that 22.1 % of the DVR reach into the inner medulla. Of the medullary glucose supply, 14.6 % (or, 4.6 pmol/min/nephron) is delivered to the inner medulla, and 5.52 % (or, 1.74 pmol/min/nephron) is consumed in the inner medulla, with active NaCl transport and basal metabolism accounting for 1.37 and 0.37 pmol/min/nephron, respectively. It is noteworthy that, in contrast to the outer medulla, the majority of the inner medullary (75.9 %) is attributable to anaerobic respiration. Owing to the low PO2 in the inner medulla, a substantial fraction (76.2 %) of the collecting duct is anaerobic. The model predicts that, along the upper half of the inner medulla, interstitial fluid glucose concentration decreases from 3.04 to 1.05 mM (Fig. 5b). That decrease can be attributed to the glucose consumed by the active NaCl transport of inner medullary collecting ducts and contributes to the decrease in DVR luminal fluid glucose concentration (Fig. 5b). In the lower half of the inner medulla, however, the active NaCl transport rate of the collecting ducts is assumed to be lower; also, the number of collecting ducts decreases owing to coalescence. As a result, glucose consumption decreases and interstitial fluid glucose concentration rises (Fig. 5b). At the papillary tip, the model predicts an interstitial glucose concentration of 1.69 mM, which is ~1/3 of arterial blood glucose concentration, consistent with experimental findings by Ruiz-Guinazu et al. (1961).
3.2 Sensitivity Studies
A number of model parameters, such as DVR glucose permeability and basal glucose consumption rate, are not well characterized. We have chosen baseline values for these parameters in order to yield medullary interstitial tissue glucose concentration consistent with experimental findings (Ruiz-Guinazu et al. 1961) (see above). To study the effects of varying these parameters on model predictions, we conduct a series of sensitivity studies.
The model describes basal metabolism by means of Michaelis–Menten kinetics (Eq. 13). We first conducted model simulations in which we set the maximum rate of basal metabolism ( in Eq. 13) to 0.2 and 0.4mM/s (baseline value is 0.3mM/s). The resulting interstitial and DVR fluid glucose concentration profiles are shown in Fig. 6. A higher value (0.4 mM/s) increases glucose consumption by 22.3 and 16.6%in the outer and inner medulla, respectively. As a result, interstitial fluid glucose concentration is reduced by~0.663mMin the inner medulla (see Fig. 6a). The impact is less pronounced in the outer medulla (especially the outer stripe) where there is much larger DVR flow and where DVR fluid glucose concentration is not significantly affected (see Fig. 6b). Conversely, when is reduced to 0.2 mM/s, glucose consumption is lowered by 19.7 and 30.1%in the outer and inner medulla, respectively, resulting in elevated interstitial and DVR fluid glucose concentrations (see Fig. 6).
Fig. 6.

Interstitial fluid (a) and DVR tubular fluid (b) glucose concentration profiles, obtained for of 0.2, 0.3 (baseline), and 0.4 mM/s. Medullary depth x = 0 mm corresponds to the cortico-medullary boundary; x = 0.6mm, inner–outer strip boundary; x = 2 mm, inner–outer medullary boundary; x = 7mm, papillary tip
We then studied the effects of varying KM,G (in Eq. 13), which corresponds to the glucose concentration at which basal metabolism rate is half of . Specifically, we set KM,G to 0.01, 1.0, and 2.0 mM (baseline value is 0.1 mM). A tenfold increase in KM,G lowers glucose consumption by 15.1 and 21.2 % in the outer and inner medulla, respectively. As a result, interstitial fluid glucose concentration increases by ~0.566 mM in the inner medulla. A 20-fold increase in KM,G lowers glucose consumption by 10.3 and 15.5 % in the outer and inner medulla, respectively. As a result, interstitial fluid glucose concentration increases by~1mMin the inner medulla (see Fig. 7a). Again, the impact is significantly less pronounced in the outer medulla, where glucose concentration generally exceeds KM,G by a substantial margin. An analogous increase in DVR fluid glucose concentration is observed (see Fig. 7b). Conversely, a tenfold decrease in KM,G increases glucose consumption by 3.31 and 5.68 % in the outer and inner medulla, respectively, resulting in lower interstitial and DVR fluid glucose concentrations (see Fig. 7).
Fig. 7.

Interstitial fluid (a) and DVR tubular fluid (b) glucose concentration profiles, obtained for KM,G of 0.01, 0.1 (baseline), 1.0, and 2.0 mM. Medullary depth x = 0 mm corresponds to the cortico-medullary boundary; x = 0.6mm, inner–outer strip boundary; x = 2 mm, inner–outer medullary boundary; x = 7mm, papillary tip
Next, we considered the effect of varying DVR glucose permeability. Figure 8a, b shows interstitial and DVR glucose concentrations, obtained for DVR glucose permeability of 1 × 10⁻⁵, 5 × 10⁻⁵ (base case), and 1 × 10⁻⁴ cm/s. With a lower DVR glucose permeability, transendothelial glucose efflux is reduced, as evidenced by the higher DVR glucose concentration profile depicted in Fig. 8b. As a result, outer stripe interstitial fluid glucose concentration is predicted to be lower than base case (Fig. 8a). However, the higher DVR glucose flow downstream results in elevated capillary glucose supply. Consequently, interstitial fluid glucose concentration in the inner medulla is predicted to be higher with this lower DVR glucose permeability. Conversely, a twofold increase in DVR glucose permeability increases DVR transendothelial glucose reabsorption, giving a higher outer stripe but lower inner medullary interstitial fluid glucose concentration.
Fig. 8.

Interstitial fluid (a) and DVR tubular fluid (b) glucose concentration profiles, obtained for DVR glucose permeabilities of 10−5, 5 × 10⁻⁵ (baseline), and 10−4 cm/s. Medullary depth x = 0 mm corresponds to the cortico-medullary boundary; x = 0.6 mm, inner–outer strip boundary; x = 2 mm, inner–outer medullary boundary; x = 7 mm, papillary tip
4 Discussion
The goal of the present study is to better understand cellular metabolism and glucose transport in a rat kidney. To that end, we have extended a detailed model of solute transport in the medulla of a rat kidney (Fry et al. 2015) to include glucose transport and metabolism. The model represents blood flow in the renal medulla, transmural transport of key solutes, as well as the basal and transport-driven consumption of O2 and glucose. The conversion of glucose into lactate via glycolysis was investigated in previous model studies (Hervy and Thomas 2003; Thomas and Wexler 1995; Zhang and Edwards 2006). The present model does not represent lactate. Nonetheless, compared to those studies (Hervy and Thomas 2003; Thomas and Wexler 1995; Zhang and Edwards 2006), which did not consider renal oxygenation, the present model provides a more comprehensive picture of renal metabolism, in the sense that it represents the consumption of both O2 and glucose.
To apply the present model, we first identified model parameters that yield predicted interstitial fluid glucose concentration that is consistent with experimental measurements of papillary blood glucose concentration (Ruiz-Guinazu et al. 1961) (see below). Using these parameters, the model predicts generally decreasing interstitial PO2 profiles along the cortico-medullary axis, consistent with previous modeling studies (Fry et al. 2014, 2015). The steeper slope in the outer medulla can be attributed to the oxygen-demanding active Na+ transport of the thick ascending limb (see Fig. 4). DVR glucose concentration is predicted to be close to arterial blood concentration in the outer medulla, but steadily decreases within the inner medulla to ~1/3 of arterial concentration. Additionally, we used the model to study the sensitivity of model predictions to variations in key glucose transport and metabolism parameters (see below).
4.1 Comparison with Experimental Findings
Despite the important role of glucose in renal tubular function, experimental data related to glucose reaction rates and renal accumulation are relatively scarce. Thus, a goal of this study is to determine parameter values that yield sufficient agreement between model predictions and experimental measurements of glucose concentration. Unfortunately, there has not been any direct measurement of glucose concentration in the renal medulla of the rat kidneys. In an experimental study using the kidneys of golden hamster, Ruiz-Guinazu et al. (1961) reported that glucose concentration in the vasa recta blood collected at the papillary tip is approximately one-third of that in the arterial blood. We have chosen parameter values, within physiologically relevant ranges, so that the model predicts a similar decline in DVR glucose concentration from the cortico-medullary boundary to the papillary tip; see Fig. 5.
Because a number of model parameters have not been measured, we conducted simulations to assess the effects of variations in key parameters on model predictions. Results of those sensitivity studies suggest that DVR and interstitial glucose concentrations (especially DVR) are more sensitive to changes in parameters concerning basal glucose metabolism in the inner medulla than in the outer medulla; see Figs. 6 and 7. A 33.3 % increase or decrease in , or a tenfold increase in KM,G, would result in papillary tip blood glucose concentrations that deviate substantially from experimental data. In contrast, model results are relatively insensitive to reductions in KM,G.
4.2 Model Limitations and Future Extensions
As previously noted, the model predicts substantial axial gradients in interstitial PO2 and glucose concentrations (also Na+ and urea concentrations; results not shown but similar profiles can be found in our previous studies Layton 2011a; Layton et al. 2012). At each medullary level, the model assumes that the arrangement of nephrons and vessels is homogeneous. In contrast, anatomic studies in the renal medulla of rodent kidneys have revealed highly structured organization of renal tubules and vasa recta (Kriz 1967, 1981; Kriz et al. 1972; Pannabecker et al. 2004). For example, in the inner stripe of the outer medulla, DVR and some of the ascending vasa recta are isolated within tightly packed vascular bundles, away from the thick ascending limbs and collecting ducts. That separation of the oxygen- and glucose-rich DVR from the metabolically demanding thick ascending limbs likely results in significant radial gradients (perpendicular to the cortico-medullary axis) in interstitial fluid PO2 and glucose concentration. Indeed, our previous modeling studies have predicted such a radial gradient in medullary PO2 (Fry et al. 2015). However, the present model assumes that at a given medullary level, interstitial fluid is well mixed; thus, it cannot predict radial concentration gradient in glucose or any other solutes. It would be interesting to extend the model to represent the radial organization of medullary structures and the resulting preferential interactions among tubules and vessels. This extension is by no means trivial, but can be done using the “region-based” approach that we applied in previous models (Layton and Layton 2005; Layton 2011a).
The anaerobic glycolysis of glucose produces lactate. Because blood flow is particularly limited in the inner medulla, a substantial fraction of the glucose metabolism in that region is anaerobic, thereby likely leading to the production and accumulation of a significant amount of lactate. It has been hypothesized that lactate may contribute to the production of a concentrated urine by raising the osmolality of the interstitial fluid and facilitating the reabsorption of water from the collecting ducts (Jen and Stephenson 1994; Thomas 2000). (This is one of the many hypotheses that have been put forward in the past few decades to explain the production of a highly concentrated urine by rodents, which has remained as one of the longest-standing mysteries in traditional physiology.) The present model already represents nephron segments and solutes that are believed to have major roles in the urine concentrating mechanism of the rat kidney. If extended to represent lactate, the model can be used to assess the validity of the hypothesis that the production of lactate via anaerobic glycolysis may be the key to the production of a highly concentrated urine by the mammalian kidney.
The present model may also be useful for understanding the impacts of diabetes on kidney function. Diabetes is a major risk of developing chronic kidney diseases (Foley and Collins 2007), which affect one in ten adults and are a growing public health and economic burden in the USA. Despite intense research, the mechanisms underlying the transition from diabetes to end-stage renal disease remain incompletely understood. It is generally believed that renal hypoxia is an important pathway in the development of chronic kidney diseases (Fine et al. 2000; Tanaka et al. 2014). In diabetes, a number of pathophysiological processes are known to increase renal oxygen demand, which, in the absence of a compensatory increase in oxygen supply, may result in intrarenal tissue hypoxia and the development of clinical hallmarks of diabetic nephropathy. Additionally, hyperglycemia is a hallmark sign of diabetes (in both type 1 and type 2 diabetes) and even prediabetes (Fine and Norman 2008; Friederick-Persson et al. 2013). The present model simulates the transport, metabolism, and interactions among O2, glucose, and other major solutes in the kidney, and can be used as a key component in an integrative model for studying diabetes and chronic kidney diseases.
Acknowledgments
This work was supported in part by the National Science Foundation through Grant DMS-1263995 and the National Institutes of Health through Grants DK089066 and DK106102 to A. Layton.
References
- Bagnasco S, Good D, Balaban R, Burg M. Lactate production in isolated segments of the rat nephron. Am J Physiol Renal Physiol. 1985;248:F522–F526. doi: 10.1152/ajprenal.1985.248.4.F522. [DOI] [PubMed] [Google Scholar]
- Chen J, Edwards A, Layton AT. A mathematical model of oxygen transport in the rat outer medulla: II. Impacts of outer medullary architecture. Am J Physiol Renal Physiol. 2009a;297:F537–F548. doi: 10.1152/ajprenal.90497.2008. [DOI] [PMC free article] [PubMed] [Google Scholar]
- Chen J, Edwards A, Layton AT. Effects of pH and medullary blood flow on oxygen transport and sodium reabsorption in the rat outer medulla. Am J Physiol Renal Physiol. 2009b;298(6):F1369–F1383. doi: 10.1152/ajprenal.00572.2009. [DOI] [PMC free article] [PubMed] [Google Scholar]
- Chen J, Layton AT, Edwards A. A mathematical model of oxygen transport in the rat outer medulla: I. Model formulation and baseline results. Am J Physiol Renal Physiol. 2009c;297:F517–F536. doi: 10.1152/ajprenal.90496.2008. [DOI] [PMC free article] [PubMed] [Google Scholar]
- Dickman KG, Mandel LJ. Differential effects of respiratory inhibitors on glycolysis in proximal tubules. Am J Physiol. 1990;258:F1608–F1615. doi: 10.1152/ajprenal.1990.258.6.F1608. [DOI] [PubMed] [Google Scholar]
- Edwards A, Layton AT. Modulation of outer medullary NaCl transport and oxygenation by nitric oxide and superoxide. Am J Physiol Renal Physiol. 2011;301:F979–F996. doi: 10.1152/ajprenal.00096.2011. [DOI] [PMC free article] [PubMed] [Google Scholar]
- Fine LG, Norman JT. Chronic hypoxia as a mechanism of progression of chronic kidney disease: form hypothesis to novel therapeutics. Kidney Int. 2008;74:867–872. doi: 10.1038/ki.2008.350. [DOI] [PubMed] [Google Scholar]
- Fine LG, Bandyopadhay D, Norman JT. Is there a common mechanism for the progression of different types of renal diseases other than proteinuria? Towards the unifying theme of chronic hypoxia. Kidney Int Suppl. 2000;75:S22–S26. [PubMed] [Google Scholar]
- Foley RN, Collins AJ. End-stage renal disease in the United States: an update from the United States Renal Data System. J Am Soc Nephrol. 2007;18:2644–2648. doi: 10.1681/ASN.2007020220. [DOI] [PubMed] [Google Scholar]
- Friederick-Persson M, Thorn E, Hansell P, Nangaku M, Palm F. Kidney hypoxia, attributable to increased oxygen consumption, induces nephropathy independently of hyperglycemia and oxidative stress. Hypertension. 2013;62:914–919. doi: 10.1161/HYPERTENSIONAHA.113.01425. [DOI] [PMC free article] [PubMed] [Google Scholar]
- Fry BC, Edwards A, Sgouralis I, Layton AT. Impact of renal medullary three-dimensional architecture on oxygen transport. Am J Physiol Renal Physiol. 2014;307:F263–F272. doi: 10.1152/ajprenal.00149.2014. [DOI] [PMC free article] [PubMed] [Google Scholar]
- Fry BC, Edwards A, Layton AT. Impacts of nitric oxide and superoxide on renal medullary oxygen transport and urine concentration. Am J Physiol Renal Physiol. 2015;308:F967–F980. doi: 10.1152/ajprenal.00600.2014. [DOI] [PMC free article] [PubMed] [Google Scholar]
- Fry BC, Edwards A, Layton AT. Impact of nitric-oxide-mediated vasodilation and oxidative stress on renal medullary oxygenation: a modeling study. Am J Physiol Renal Physiol. 2016;310:F237–F247. doi: 10.1152/ajprenal.00334.2015. [DOI] [PMC free article] [PubMed] [Google Scholar]
- Ganguli M, Tobian L. Does the kidney autoregulate papillary plasma flow in chronic postsalt hypertension? Am J Physiol. 1974;226:330–333. doi: 10.1152/ajplegacy.1974.226.2.330. [DOI] [PubMed] [Google Scholar]
- Greger R, Schlatter E, Lang F. Evidence for electroneutral sodium chloride cotransport in the cortical thick ascending limb of Henle’s loop of rabbit kidney. Pflügers Arch. 1983;396:308–314. doi: 10.1007/BF01063936. [DOI] [PubMed] [Google Scholar]
- Hervy S, Thomas SR. Inner medullary lactate production and urine-concentrating mechanism: a flat medullary model. Am J Physiol Renal Physiol. 2003;284:F65–F81. doi: 10.1152/ajprenal.00045.2002. [DOI] [PubMed] [Google Scholar]
- Jen JF, Stephenson JL. Externally driven countercurrent multiplication in a mathematical model of the urinary concentrating mechanism of the renal inner medulla. Bull Math Biol. 1994;56:491–514. doi: 10.1007/BF02460468. [DOI] [PubMed] [Google Scholar]
- Klein Keith I, Maw-Song Wang, Shozo Torikai, Warren Davidson, Kiyoshi Kurokawa. Substrate oxidation by defined single nephron segments of rat kidney. Int J Biochem. 1980;12(1):53–54. doi: 10.1016/0020-711x(80)90041-5. [DOI] [PubMed] [Google Scholar]
- Kramer K, Thurau K, Deetjen P. Hämodynamik des nierenmarks. Pflügers Arch Eur J Physiol. 1960;270(3):251–269. [PubMed] [Google Scholar]
- Kriz W. Der architektonische and funktionelle Aufbau der Rattenniere. Z Zellforsch. 1967;82:495–535. [PubMed] [Google Scholar]
- Kriz W. Structural organization of the renal medulla: comparative and functional aspects. Am J Physiol (Regul Integr Comp Physiol 10) 1981;241:R3–R16. doi: 10.1152/ajpregu.1981.241.1.R3. [DOI] [PubMed] [Google Scholar]
- Kriz W, Schnermann J, Koepsell H. The position of short and long loops of Henle in the rat kidney. Z Anat Entwickl-Gesch. 1972;138:301–319. doi: 10.1007/BF00520710. [DOI] [PubMed] [Google Scholar]
- Layton AT. A mathematical model of the urine concentrating mechanism in the rat renal medulla: I. Formulation and base-case results. Am J Physiol Renal Physiol. 2011a;300:F356–F371. doi: 10.1152/ajprenal.00203.2010. [DOI] [PMC free article] [PubMed] [Google Scholar]
- Layton AT. A mathematical model of the urine concentrating mechanism in the rat renal medulla: II. Functional implications of three-dimensional architecture. Am J Physiol Renal Physiol. 2011b;300:F372– F394. doi: 10.1152/ajprenal.00204.2010. [DOI] [PMC free article] [PubMed] [Google Scholar]
- Layton AT, Dantzler WH, Pannabecker TL. Urine concentrating mechanism: Impact of vascular and tubular architecture and a proposed descending limb urea-Na+ cotransporter. Am J Physiol Renal Physiol. 2012;302:F591–F605. doi: 10.1152/ajprenal.00263.2011. [DOI] [PMC free article] [PubMed] [Google Scholar]
- Layton AT, Layton HE. A region-based mathematical model of the urine concentrating mechanism in the rat outer medulla: I. Formulation and base-case results. Am J Physiol Renal Physiol. 2005;289:F1346– F1366. doi: 10.1152/ajprenal.00346.2003. [DOI] [PubMed] [Google Scholar]
- Nelimarkka O. Renal oxygen and lactate metabolism in hemorrhagic shock. An experimental study. Acta Chir Scand Suppl. 1984;518:1–44. [PubMed] [Google Scholar]
- Nieves-Gonzalez A, Clausen C, Layton AT, Layton HE, Moore LC. Transport efficiency and work-load distribution in a mathematical model of the thick ascending limb. Am J Physiol Renal Physiol. 2013;304:F653–F664. doi: 10.1152/ajprenal.00101.2012. [DOI] [PMC free article] [PubMed] [Google Scholar]
- Pannabecker TL, Abbott DE, Dantzler WH. Three-dimensional functional reconstruction of inner medullary thin limbs of Henle’s loop. Am J Physiol Renal Physiol. 2004;286:F38–F45. doi: 10.1152/ajprenal.00285.2003. [DOI] [PubMed] [Google Scholar]
- Rich PR. The molecular machinery of Keilin’s respiratory chain. Biochem Soc Trans. 2003;31:1095–1106. doi: 10.1042/bst0311095. [DOI] [PubMed] [Google Scholar]
- Ruiz-Guinazu A, Pehling G, Rumrich G, Ullrich KJ. Glucose and lactic acid concentration at the peak of the vascular counter flow system in the renal medulla. Pflügers Arch. 1961;274:311–317. [PubMed] [Google Scholar]
- Stern MD, Bowen PD, Parma R, Osgood RW, Bowman RL, Stein JH. Measurement of renal cortical and medullary blood flow by laser-Doppler spectroscopy in the rat. Am J Physiol Renal Physiol. 1979;236:F80–F87. doi: 10.1152/ajprenal.1979.236.1.F80. [DOI] [PubMed] [Google Scholar]
- Stokes JB, Grupp C, Kinne RKH. Purification of rat papillary collecting duct cells: functional and metabolic assessment. Am J Physiol. 1987;253:F251–F262. doi: 10.1152/ajprenal.1987.253.2.F251. [DOI] [PubMed] [Google Scholar]
- Tanaka S, Tanaka T, Nnagaku M. Hypoxia as a key player in the AKI-to-CKD transition. Am J Physiol Renal Physiol. 2014;307:F1187–F1195. doi: 10.1152/ajprenal.00425.2014. [DOI] [PubMed] [Google Scholar]
- Thomas SR. Inner medullary lactate production and accumulation: a vasa recta model. Am J Physiol Renal Physiol. 2000;279:F468–F481. doi: 10.1152/ajprenal.2000.279.3.F468. [DOI] [PubMed] [Google Scholar]
- Thomas SR, Wexler AS. Inner medullary external osmotic driving force in a 3-D model of the renal concentrating mechanism. Am J Physiol (Renal Fluid Electrolyte Physiol 38) 1995;269:F159–F171. doi: 10.1152/ajprenal.1995.269.2.F159. [DOI] [PubMed] [Google Scholar]
- Uchida S, Endou H. Substrate specificity to maintain cellular ATP along the mouse nephron. Am J Physiol Renal Physiol. 1988;255:F977–F983. doi: 10.1152/ajprenal.1988.255.5.F977. [DOI] [PubMed] [Google Scholar]
- Weidemann MJ, Krebs HA. The fuel of respiration of rat kidney cortex. Biochem J. 1969;112:149–166. doi: 10.1042/bj1120149. [DOI] [PMC free article] [PubMed] [Google Scholar]
- Weinstein AM. A mathematical model of the inner medullary collecting duct of the rat: pathways for Na and K transport. Am J Physiol (Renal Physiol 43) 1998;274:F841–F855. doi: 10.1152/ajprenal.1998.274.5.F841. [DOI] [PubMed] [Google Scholar]
- Zeidel ML, Silva P, Seifter JL. Intracellular pH regulation and proton transport by rabbit renal medullary collecting duct cells: role of plasma membrane proton adenosine triphosphatase. J Clin Invest. 1986;77:113–120. doi: 10.1172/JCI112264. [DOI] [PMC free article] [PubMed] [Google Scholar]
- Zhang W, Edwards A. A model of glucose transport and conversion to lactate in the renal medullary microcirculation. Am J Physiol Renal Physiol. 2006;290:F87–F102. doi: 10.1152/ajprenal.00168.2005. [DOI] [PubMed] [Google Scholar]