

Abstract
Background
Metastatic renal cell carcinoma (RCC) patients are commonly treated with vascular endothelial growth factor (VEGF) inhibitors or mammalian target of rapamycin inhibitors. Correlations between somatic mutations and first-line targeted therapy outcomes have not been reported on a randomized trial.
Objective
To evaluate the relationship between tumor mutations and treatment outcomes in RECORD-3, a randomized trial comparing first-line everolimus (mTOR inhibitor) followed by sunitinib (VEGF inhibitor) at progression with the opposite sequence in 471 metastatic RCC patients.
Design, setting, and participants
Targeted sequencing of 341 cancer genes at ~540× coverage was performed on available tumor samples from 258 patients; 220 with clear cell histology (ccRCC).
Outcome measurements and statistical analysis
Associations between somatic mutations and median first-line progression free survival (PFS1L) and overall survival were determined in metastatic ccRCC using Cox proportional hazards models and log-rank tests.
Results and limitations
Prevalent mutations (≥ 10%) were VHL (75%), PBRM1 (46%), SETD2 (30%), BAP1 (19%), KDM5C (15%), and PTEN (12%). With first-line everolimus, PBRM1 and BAP1 mutations were associated with longer (median [95% confidence interval {CI}] 12.8 [8.1, 18.4] vs 5.5 [3.1, 8.4] mo) and shorter (median [95% CI] 4.9 [2.9, 8.1] vs 10.5 [7.3, 12.9] mo) PFS1L, respectively. With first-line sunitinib, KDM5C mutations were associated with longer PFS1L (median [95% CI] of 20.6 [12.4, 27.3] vs 8.3 [7.8, 11.0] mo). Molecular subgroups of metastatic ccRCC based on PBRM1, BAP1, and KDM5C mutations could have predictive values for patients treated with VEGF or mTOR inhibitors. Most tumor DNA was obtained from primary nephrectomy samples (94%), which could impact correlation statistics.
Conclusions
PBRM1, BAP1, and KDM5C mutations impact outcomes of targeted therapies in metastatic ccRCC patients.
Patient summary
Large-scale genomic kidney cancer studies reported novel mutations and heterogeneous features among individual tumors, which could contribute to varied clinical outcomes. We demonstrated correlations between somatic mutations and treatment outcomes in clear cell renal cell carcinoma, supporting the value of genomic classification in prospective studies.
Keywords: Genomic biomarker, Kidney cancer, Targeted therapy, Everolimus, Sunitinib, Tumor suppressor gene, PBRM1, SETD2, BAP1, KDM5C
1. Introduction
Clear cell renal cell carcinoma (ccRCC) is most common histological subtype and accounts for the most RCC-specific deaths. The genetic inactivation of Von Hippel Lindau (VHL) tumor suppressor gene was the only known prevalent oncogenic driver event in ccRCC for decades [1]. Recent analyses of ccRCC using next-generation sequencing (NGS) revealed novel, common mutations including PBRM1, BAP1, SETD2, and KDM5C [2]. These genes encode proteins that regulate chromatin [3] and most reported somatic mutations result in loss of function, indicating that these proteins function as tumor suppressors. Thus far, analyses of published cohorts encompassing Stages I–IV kidney cancer patients have suggested prognostic values of individual mutations [4,5]. However, large-scale mutation profiles of Stage IV kidney cancer are lacking.
Inhibitors of vascular endothelial growth factor (VEGF) or mammalian target of rapamycin (mTOR) signaling pathways are standard treatment options for patients with metastatic RCC (mRCC) [6]. RECORD-3 (Renal Cell Cancer Treatment With Oral RAD001 Given Daily) was a randomized phase 2 trial comparing sunitinib, a VEGF receptor-tyrosine kinase inhibitor, with everolimus, an mTOR inhibitor, in previously untreated patients with mRCC (N = 471) [7]. After disease progression, patients crossed over to the alternative agent for second-line therapy. Most enrolled patients (~85%) had metastatic ccRCC. Median first-line progression-free survival (PFS1L; 7.9 mo, everolimus; 10.7 mo, sunitinib; hazard ratio [HR]: 1.4; 95% confidence interval [CI]: 1.2, 1.8) and final median overall survival (OS; 22.4 mo, everolimus-sunitinib; 29.5 mo, sunitinib-everolimus; HREVE-SUN/SUN-EVE: 1.1; 95% CI: 0.9, 1.4) [7,8] favored the standard sequence of sunitinib followed by everolimus [6,9]. Case studies involving cancer gene mutations of advanced (Stage IV or recurrent metastatic) ccRCC have indicated a potential correlation between mutations and treatment response to targeted therapy [10–12]; however, these associations have not been evaluated in a large clinical trial setting. To address these questions, we leveraged archived tumor samples collected from the RECORD-3 study, sequenced 341 cancer genes, and performed correlation analysis.
2. Materials and methods
2.1. Patients, study design, and treatment
The RECORD-3 trial design has been previously reported [7]. Patients received everolimus 10 mg/d or sunitinib 50 mg/d in a crossover design. Patients were randomly assigned 1:1 to sequentially receive either everolimus-sunitinib (n = 238) or sunitinib-everolimus (n = 233), and stratified by Memorial Sloan-Kettering Cancer Center (MSKCC) risk criteria [13]. Adult patients with measurable mRCC of any histology who had not previously received systemic therapy, and with a Karnofsky performance status ≥70% were included. All patients gave informed consent.
2.2. Tumor DNA and MSK-Integrated Mutation Profiling of Actionable Cancer Targets
Hematoxylin and eosin slides of available tumor tissue from RECORD-3 were reviewed by a dedicated genitourinary pathologist (YC). Unstained sections were microdissected to ensure tumor purity. DNA was purified using the DNeasy Blood and Tissue Kit and subjected to ultra-deep sequencing using the MSK-Integrated Mutation Profiling of Actionable Cancer Targets platform [14].
2.3. Statistical analysis
Associations between PFS1L (and OS), first-line treatment (treatment regimen), and gene alteration status (mutant type [MT] or wild type [WT]) were investigated. All nonsynonymous mutations were considered while defining the alteration status. Median PFS1L (and OS) by first-line treatment (treatment regimen) and alteration status (MT vs WT) were determined by the Kaplan-Meier method. HR (95% CIs) are estimated from a Cox proportional hazards (PH) model for PFS1L (OS). The model included terms for mutation status, treatment arm, interaction between treatment arms and mutation status groups, with stratification by MSKCC risk groups and adjustment for baseline covariates (RCC histology when combining data from clear and nonclear cell, number of metastatic sites, baseline lactate dehydrogenase levels). Differences between survival curves of PFS1L (and OS) for each mutation status group and treatment arm were tested using the log-rank test. All p values were not adjusted for multiple testing. When exploring associations with OS, all ccRCC patients with NGS data were included based on the randomized treatment regimen, regardless of their crossover status, and no adjustments were performed for confounding effects of crossover. Patterns of mutual exclusivity or co-occurrence were explored via odds ratio, and statistical significance for the relationship between gene pairs was assessed using Fisher exact test [15].
3. Results
3.1. Study cohort
Among 258 successfully sequenced tumors, 220 were of cc histology (first-line everolimus, n = 109; first-line sunitinib, n = 111; Fig. 1). For a clear correlation analysis, we only included ccRCC patients. Our NGS ccRCC cohort (n = 220) reflects patient characteristics of the original 471 patients included in RECORD-3 (Table 1). Patient characteristics of the total biomarkers population (ccRCC and non-ccRCC) are shown (Supplementary Table 1).
Fig 1.
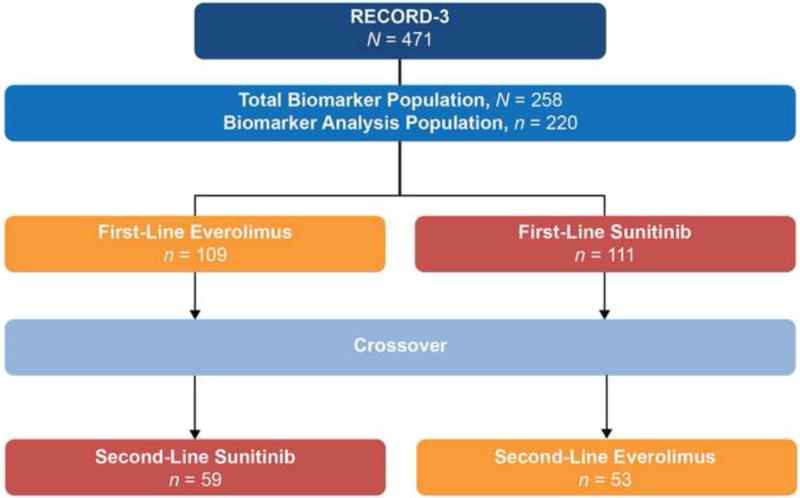
RECORD-3 clear cell renal cell carcinoma next-generation sequencing cohort.
Table 1.
Baseline characteristics of patients with clear cell renal cell carcinoma included in the next-generation sequencing analysis
| First-line everolimus N = 109 |
First-line sunitinib N = 111 |
Biomarker analysis set N = 220 |
|
|---|---|---|---|
| Sex, n (%) | |||
| Male | 80 (73) | 88 (79) | 168 (76) |
| Female | 29 (27) | 23 (21) | 52 (24) |
| Age, mean (range; yr) | 62 (21–89) | 62 (32–84) | 62 (21–89) |
| Race, n (%) | |||
| White | 78 (72) | 90 (81) | 168 (76) |
| Black | 1 (1) | 3 (3) | 4 (2) |
| Asian | 20 (18) | 10 (9) | 30 (14) |
| Other | 10 (9) | 8 (7) | 18 (8) |
| KPS, n (%) | |||
| ≥90 | 28 (26) | 28 (25) | 56 (25) |
| 80 | 20 (18) | 12 (11) | 32 (14) |
| ≤70 | 10 (9) | 12 (11) | 22 (10) |
| Missing | 51 (47) | 59 (53) | 110 (50) |
| Nephrectomy, n (%) | |||
| Yes | 98 (90) | 101 (91) | 199 (90) |
| No. of metastatic sites, n (%) | |||
| 0 | 1 (<1) | 2 (2) | 3 (1) |
| 1 | 21 (19) | 28 (25) | 49 (22) |
| ≥2 | 87 (80) | 81 (73) | 168 (76) |
| MSKCC risk group, n (%) | |||
| Favorable | 41 (38) | 53 (48) | 94 (43) |
| Intermediate | 56 (51) | 50 (45) | 106 (48) |
| Poor | 12 (11) | 8 (7) | 20 (9) |
| LDH, median (range; U/l) | 169 (102–860) | 159 (106–669) | 163 (102–860) |
| Median PFS1L (mo), (95% CI) | 8.3 (5.4–10.7) | 10.8 (8.1–12.9) | — |
KPS = Karnofsky performance status; LDH = lactate dehydrogenase; MSKCC = Memorial Sloan Kettering Cancer Center; PFSL1 = progression-free survival first-line.
3.2. Somatic mutation profiling of RECORD-3 ccRCC tumors
The median sequencing coverage of the 341 cancer genes in our NGS ccRCC 220-patient cohort was ~540× (33–1378×), with 93% of exons at >100×. Germline DNA was sequenced for 171 patients (78%). DNA from 206 tumors (94%) was obtained from primary nephrectomy samples. Within the NGS ccRCC cohort, 217 tumors (99%) had ≥1 somatic mutation and 161 tumors (73%) had <10 mutations; the median number of mutations was five (Fig. 2A). There were 18 genes with mutation frequencies detected at ≥5%. Six genes—VHL, PBRM1, SETD2, BAP1, KDM5C, and PTEN—were mutated at ≥10% in our cohort, and there was no association between these mutations and MSKCC risk groups (Supplementary Table 2). Most mutations were truncating (VHL, 64%; PBRM1, 79%; SETD2, 89%; BAP1, 69%; KDM5C, 75%; PTEN, 81%), consistent with previous reports [2,3,16]. Compared with recent large-scale ccRCC genomic series that encompass primary tumors of ccRCC from Stages I–V, the RECORD-3 ccRCC NGS cohort exhibited comparable mutation frequencies in VHL (75% vs 49–82%), PBRM1 (46% vs 29–41%), and MTOR (6–6%), whereas the frequency was higher in SETD2 (30% vs 8–12%), BAP1 (19% vs 7–10%), KDM5C (15% vs 4–8%), and PTEN (12% vs 2–4%; Fig. 2B).
Fig. 2.
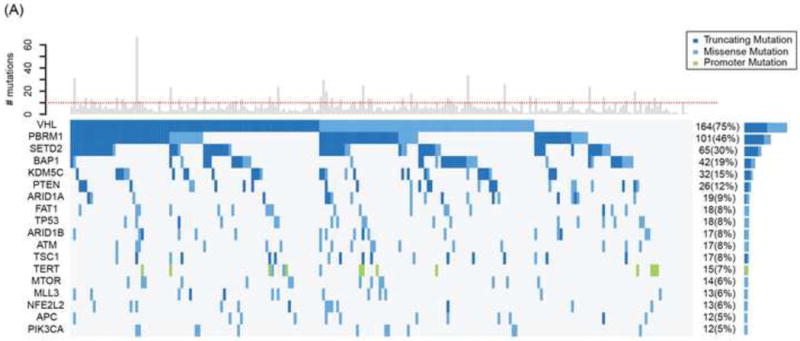
Mutation profiles of RECORD-3 clear cell renal cell carcinoma next-generation sequencing cohort. (A) Oncoprint of frequently mutated genes (≥ 5%) from RECORD-3 patients with clear cell metastatic renal cell carcinoma. (B) Frequently mutated genes from RECORD-3 and other published data.
TCGA = The Cancer Genome Atlas.
3.3. Correlations between mutations and PFS1L within treatment arms
The interaction terms between treatment and mutation status groups in the Cox PH models were not statistically significant. However HRs (MT vs WT) within each treatment group are presented to determine if the data suggest a differential impact of the mutation on the treatment response which warrants further investigation in independent studies. In the everolimus arm, patients with PBRM1 MT appear to have a lower risk of progression on first-line than WT tumors (HR: 0.53; 95% CI: 0.3, 0.8; median PFS1L [95% CI], 12.8 [8.1, 18.4] vs 5.5 [3.1, 8.4] mo), whereas in the sunitinib arm, the mutation status of PBRM1 appears to have no effect (HR: 0.79; 95% CI: 0.5, 1.3; Table 2). Conversely, in the everolimus arm, patients with BAP1 MT tumors appear to have a higher risk of progression than those with WT tumors (HR: 1.84; 95% CI: 1.1, 3.2; median PFS1L [95% CI], 4.9 [2.9, 8.1] vs 10.5 [7.3, 12.9] mo). In the sunitinib arm patients with BAP1 MT tumors appear to have a higher risk of progression than WT tumors, although the HR is not statistically significant (HR: 1.69; 95% CI: 0.9, 3.2; median PFS1L [95%CI], 8.1 [3.1, 11.3] vs 11.0 [8.3, 13.8]). The mutation status of KDM5C appears to have no effect on PFS1L in the everolimus arm (HR: 1.06; 95% CI: 0.5, 2.1; median PFS1L [95%CI], 9.8 [2.2, 16.6] vs 8.2 [5.3, 10.9]); whereas patients in the sunitinib arm with KDM5C MT appear to have lower risk of progression than those with WT tumors (HR: 0.57; 95% CI: 0.3, 1.1; median PFS1L [95%CI], 20.6 [12.4, 27.3] vs 8.3 [7.8, 11.0]).
Table 2.
Median progression-free survival first-line (PFS1L) by first-line treatment and mutation status of patients with clear cell renal cell carcinoma (n = 220)
| Biomarker | Treatment | Mutation status | Patients (n) | Events (n) | Median PFS1L, mo (95% CI) | Hazard ratio, MT vs WTa (95% CI) | Log-rank p valueb |
|---|---|---|---|---|---|---|---|
| VHL | Everolimus | WT MT |
29 80 |
22 62 |
6.5 (3.1–10.9) 8.4 (5.3–11.2) |
0.77 (0.5–1.3) | 0.2 |
| Sunitinib | WT MT |
27 84 |
17 59 |
10.9 (5.4–27.3) 10.8 (8.1–13.3) |
0.88 (0.5–1.5) | 0.5 | |
| PBRM1 | Everolimus | WT MT |
64 45 |
53 31 |
5.5 (3.1–8.4) 12.8 (8.1–18.4) |
0.53 (0.3–0.8) | 0.002 |
| Sunitinib | WT MT |
55 56 |
36 40 |
8.3 (5.8–12.9) 11.0 (8.3–13.8) |
0.79 (0.5–1.3) | 0.3 | |
| SETD2 | Everolimus | WT MT |
78 31 |
57 27 |
8.4 (6.5–11.1) 6.6 (3.0–12.1) |
1.19 (0.7–1.9) | 02 |
| Sunitinib | WT MT |
77 34 |
51 25 |
9.8 (8.1–12.4) 11.5 (8.1–16.9) |
0.99 (0.6–1.6) | 0.3 | |
| BAP1 | Everolimus | WT MT |
87 22 |
65 19 |
10.5 (7.3–12.9) 4.9 (2.9–8.1) |
1.84 (1.1–3.2) | 0.02 |
| Sunitinib | WT MT |
91 20 |
62 14 |
11.0 (8.3–13.8) 8.1 (3.1–11.3) |
1.69 (0.9–3.2) | 0.06 | |
| KDM5C | Everolimus | WT MT |
98 11 |
74 10 |
8.2 (5.3–10.9) 9.8 (2.2–16.6) |
1.06 (0.5–2.1) | 05 |
| Sunitinib | WT MT |
90 21 |
65 11 |
8.3 (7.8–11.0) 20.6 (12.4–27.3) |
0.57 (0.3–1.1) | 0.03 | |
| PTEN | Everolimus | WT MT |
100 9 |
77 7 |
8.3 (5.5–10.7) 9.1 (2.1–28.4) |
1.24 (0.6–2.8) | 0.4 |
| Sunitinib | WT MT |
94 17 |
62 14 |
10.8 (8.1–13.8) 10.6 (5.8–12.4) |
1.52 (0.8–2.8) | 0.1 |
CI = confidence interval; MT = mutant type; WT = wild type.
HR for MT versus WT within a treatment arm is computed from a Cox proportional hazard model with terms for mutation status, treatment arm, interaction between treatment arms and mutation status groups, with stratification by Memorial Sloan Kettering Cancer Center risk groups and adjustment for baseline covariates (number of metastatic sites, baseline lactate dehydrogenase levels).
The p values from the log-rank test for difference in survival curves of PFS1L between mutation status groups, within treatment arm are not adjusted for multiple testing.
There were no statistically significant differences between PFS1L for the VHL, SETD2, and PTEN genotypes within either treatment arm. TSC1 and MTOR were mutated in 13% of our cohort, and no clear association between PFS1L outcomes and everolimus (HR: 0.91; 95% CI: 0.4, 2.2) or sunitinib (HR: 1.24; 95% CI: 0.7, 2.4) was observed. Of note, seven patients with MTOR tumor mutations were treated with first-line everolimus. Three patients remained on everolimus and were censored at 13.4 mo, 21.8 mo, and 21.8 mo, and three patients progressed at 2.2 mo, 2.8 mo, and 13.9 mo (at primary analysis data cut-off) [7]. One patient was censored due to the addition of a new treatment.
3.4. Subgroup analyses of PFS1L by PBRM1, BAP1, and KDM5C mutation status
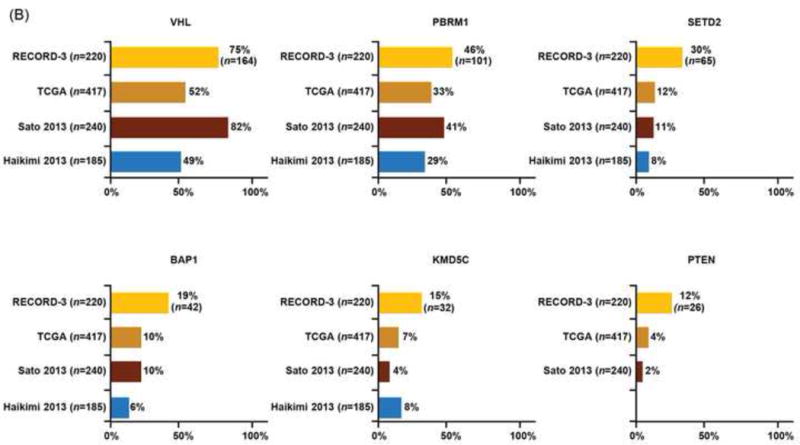
Consistent with reported PFS1L of the overall RECORD-3 population [7], patients in the NGS ccRCC population who received first-line everolimus versus sunitinib had shorter median PFS1L (median [95% CI], 8.3 [5.4–10.7] vs10.8 [8.1–12.9] mo; Table 1). However, when PFS1L was examined within genetic mutation subgroups, heterogeneous clinical outcomes were observed, although the heterogeneity did not meet the thresholds for statistical significance (Table 2, Supplementary Table 3). Among patients with KDM5C tumor mutations, although not statistically significant, patients receiving first-line everolimus have a high risk of progression than those receiving sunitinib (HR: 2.23; 95% CI: 0.9, 5.5; median PFS1L [95% CI], 9.8 [2.2, 16.2] vs 20.6 [12.4, 27.3] mo; Fig. 3A). There was no significant difference in the risk of progression and median PFS1L among patients with PBRM1 tumor mutations who received first-line everolimus versus sunitinib (HR: 1.02; 95% CI: 0.6, 1.7; median PFS1L [95% CI] 12.8 [8.1, 18.4] vs 11.0 [8.3, 13.8] mo; Fig. 3B). The shortest median PFS1L was found among patients with BAP1 tumor mutations in both treatment arms (median [95% CI], sunitinib 8.1 [3.1, 11.3] vs everolimus 4.9 [2.9, 8.1] mo; Fig. 3C).
Fig. 3.
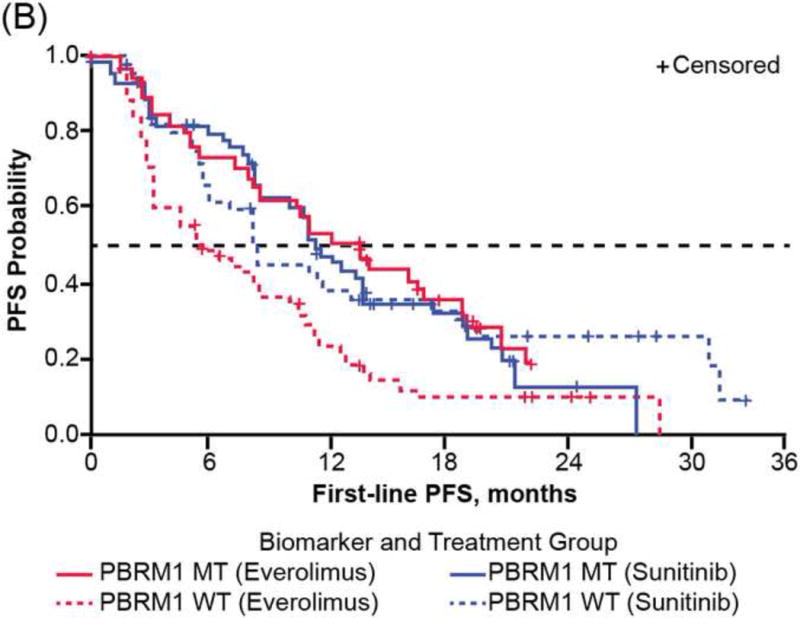
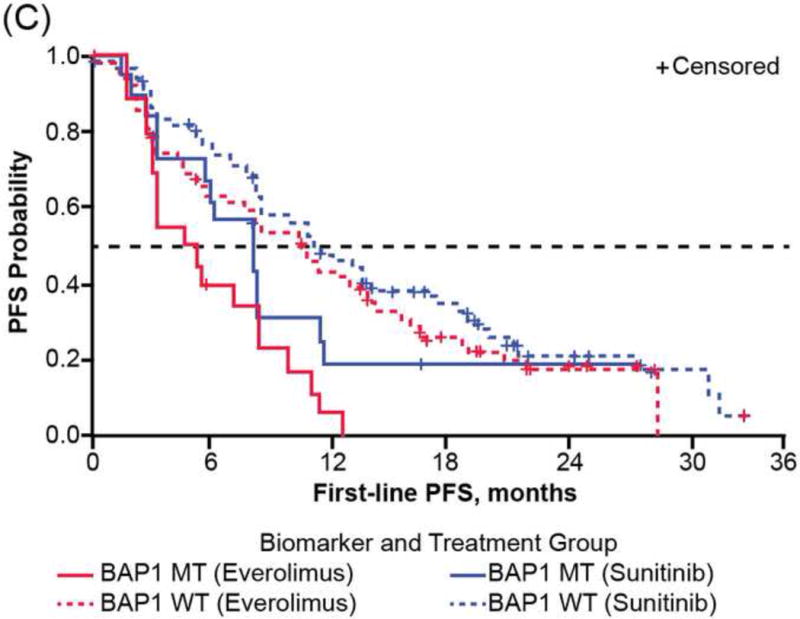
First-line progression-free survival (PFS) of RECORD-3 patients with metastatic clear cell renal cell carcinoma. First-line PFS of patients with (A) KDM5C, (B) PBRM1, and (C) BAP1 mutations.
MT = mutant type; WT = wild type.
Patients randomized to first-line sunitinib versus everolimus had longer median PFS1L irrespective of VHL, SETD2, or PTEN genetic status. Median PFS1L and mutation status of patients in the total biomarkers population (ccRCC and non-ccRCC) are shown (Supplementary Table 4). Given that 85% patients of the whole NGS cohort had ccRCC, comparable statistics data were observed (Table 2, Supplementary Table 4).
3.5. Correlation of genomic subgroups based on mutation status of PBRM1, BAP1, and KDM5C and OS on targeted therapies
Our data presented thus far demonstrated correlations between individual somatic mutations, including PBRM1, BAP1, and KDM5C, and the PFS1L of two distinct targeted therapies, everolimus and sunitinib. Acknowledging the existence of confounding factors such as the cross-over design and the 48–54% cross-over rate (Fig. 1), we explored the correlation between individual mutations and OS (Supplementary Table 5).
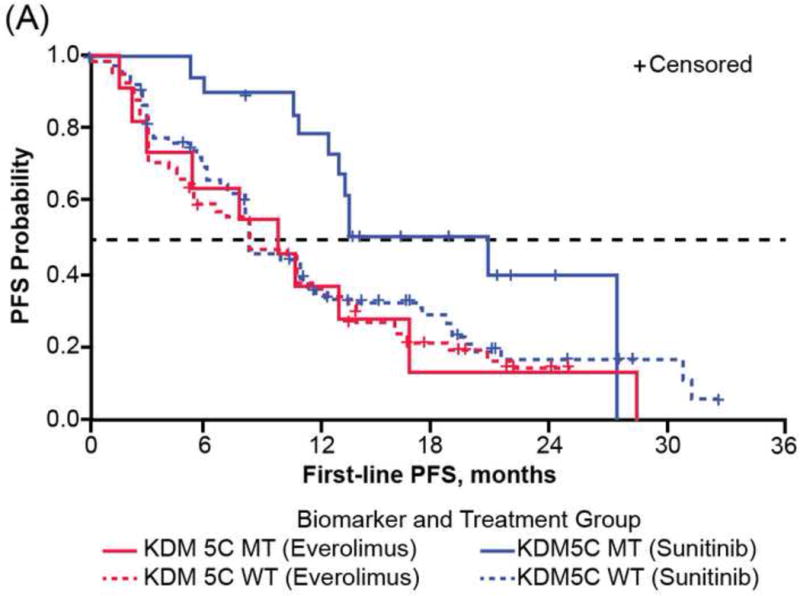
Mutual exclusivity [15] was detected between PBRM1 and BAP1 (p < 0.001) mutations with only seven (3%) cases carrying both mutations in our NGS ccRCC cohort (Fig. 4A), which was also observed with reported ccRCC genomics encompassing Stage I–IV tumors [2,4,16,17]. As the mutation status of PBRM1 and BAP1 was shown to associate with RCC-specific survival among ccRCC patients of all stages without taking consideration of treatment information [4,5,17], we classified patients into three molecular groups based on their combined PBRM1 and BAP1 mutation status and assessed the impact of genotypes on OS of patients with ccRCC in each treatment arm. The PBRM1 group was composed of PBRM1 MT and BAP1 WT (38%), the BAP1 group was composed of BAP1 MT and PBRM1 WT/MT (17%), and the WT group was composed of PBRM1 WT and BAP1 WT (44%). Of note, patients with mutations in both PBRM1 and BAP1 have been shown to fare poorly [17], and were assigned to the BAP1 group in our analysis. Among patients treated with sequential everolimus-sunitinib, the longest OS (median 95% CI: 43.5 [34.4, not estimated] mo) was observed with the PBRM1 group, the shortest (9.8 [8.2, 22.4]) with the BAP1 group, and an intermediate (18.1 [11.1, 29.6]) with the WT group (Fig. 4B). Among patients treated with sequential sunitinib-everolimus, median OS (95% CI) was 33.2 (25.8, 45.0) mo with the PBRM1 group, 29.9 (8.9, not estimated) mo with the BAP1 group, and 33.1 (.5, 39.5) mo with the WT group (Fig. 4C). Although the interaction between molecular groups and treatment was not significant in the Cox PH model, estimates of HR (95% CI) are presented within each treatment sequence, in order to assess if the data suggest there could be a differential impact of the molecular groups on treatment response. Risk for death appeared to be larger within the everolimus-sunitinib sequence when comparing the BAP1 and PBRM1 groups (HR: 2.2; 95% CI: 2.2 1.1, 4.3; log-rank p = 0.009); however, the risk for death was not significant within the sunitinib-everolimus sequence (HR: 1.6; 95% CI: 0.8, 3.2; log-rank p = 0.4).
Fig. 4.
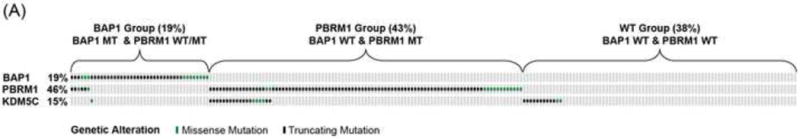
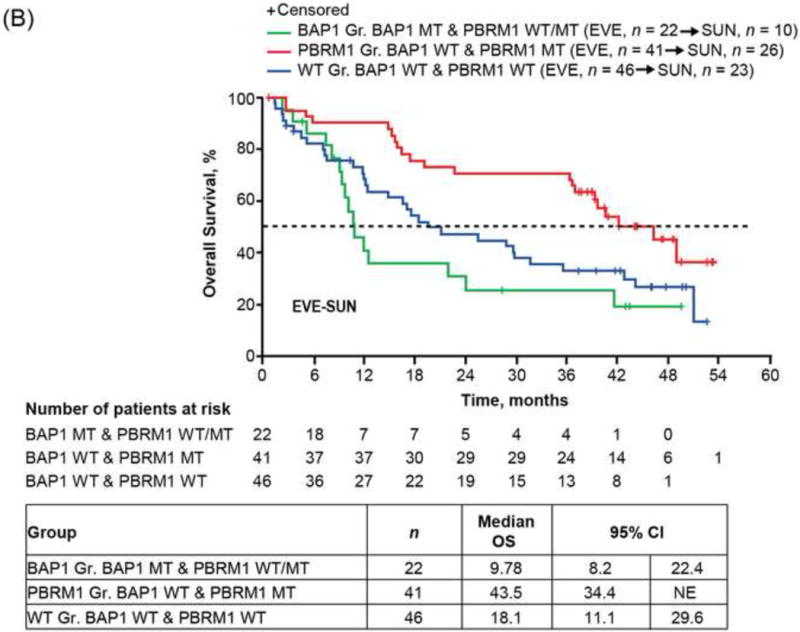
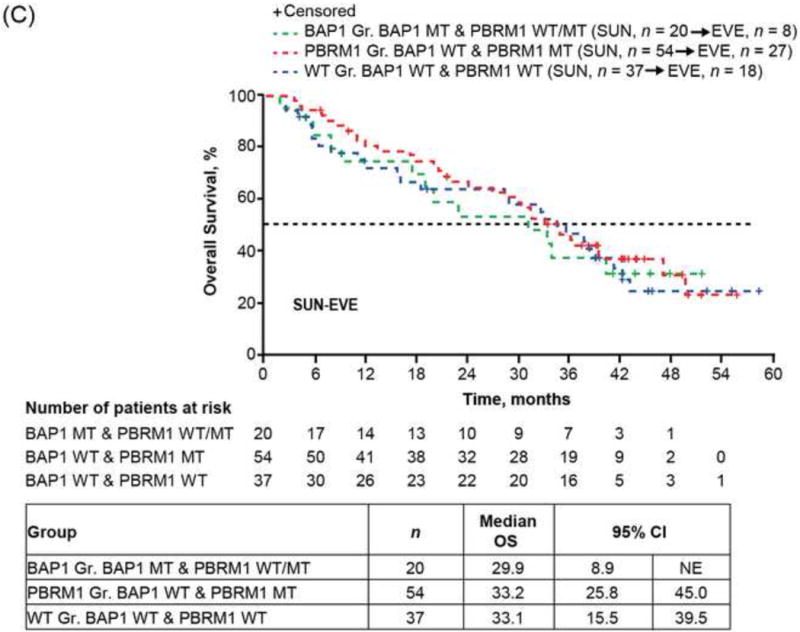
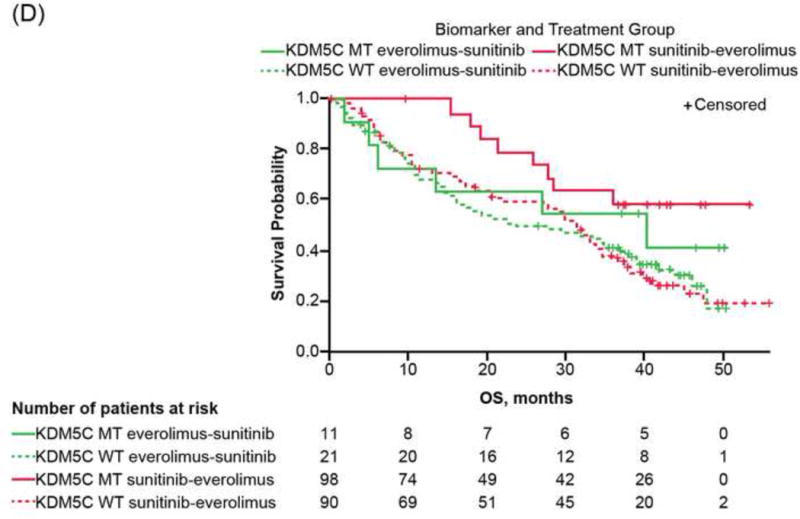
Overall survival (OS) of RECORD-3 patients with metastatic c clear cell renal cell carcinoma. (A) BAP1, PBRM1, and KDM5C mutation status. OS and BAP1/PBRM tumor mutations in the (B) everlimus-sunitinib (EVE-SUN) arm and the (C) SUN-EVE arm. (D) OS and KDM5C tumor mutation status.
CI = confidence interval; Gr = group; MT = mutant type; WT = wild type
As patients with KDM5C mutations appear to have longer PFS1L with first-line sunitinib but not with first-line everolimus (Fig. 3A), and PBRM1 mutations exhibited comparable PFS1L (Fig. 3B), we examined whether mutation status affected OS in our cohort.
Estimates of HR (95% CI) between mutation groups, within each treatment sequence are presented, in order to assess if the data suggest there could be a differential impact of the molecular groups on treatment response; although it should be noted that the interaction between treatment and mutation groups was not significant for KDM5C or PBRM1. The risk for death appears to be smaller when comparing KDM5C MT and WT patients within the sunitinib-everolimus sequence (HR: 0.39; 95% CI: 0.2, 0.9; log-rank p = 0.02); whereas it appears not to differ between the KDM5C MT and WT patients within the everolimus-sunitinib sequence (HR: 0.55; 95% CI: 0.2, 1.3; log-rank p = 0.2). Intriguingly, patients with PBRM1 MT appear to have a lower risk of death compared with WT, within the everolimus-sunitinib sequence (HR: 0.50; 95% CI: 0.3, 0.8; log-rank p = 0.004); while it appears not to differ between PBRM1 MT versus WT groups, within the sunitinib-everolimus (HR: 0.73; 95% CI: 0.5, 1.2; log-rank p = 0.4; Supplementary Table 5).
4. Discussion
The implementation of targeted therapy with VEGF receptor and mTOR inhibitors for mRCC transformed an imminently lethal disease into a more manageable malignancy [18]. However, a wide range of clinical outcomes has been observed [19–21]. The discoveries of intratumor heterogeneity [22–24] and novel prevalent mutations in ccRCC suggest a potential genetic basis for observed diverse clinical outcome.
Consistent with previous studies, we did not detect an association between VHL mutation and clinical outcome in ccRCC. Unexpectedly, patients whose tumors carry KDM5C mutation derived longer median PFS1L benefit with sunitinib (20.6 mo; 95% CI: 12.4–27.3) but not with everolimus (9.8 mo; 95% CI: 2.2–16.6). KDM5C is located at the X-chromosome, and single-allele mutation of KDM5C in male patients would result in complete genetic loss of KDM5C. The extended benefit in patients (especially men) with KDM5C mutations who received VEGF inhibitor therapy was noted in a smaller study where statistical significance was not detected [12]. The role of KDM5C in antagonizing the hypoxia-inducible factor pathway was recently reported using cell-based assays [25], offering potential mechanistic basis.
Kidney cancer is a metabolic disease [26,27]. Outlier studies have shown that direct mTOR complex 1 (mTORC1) activation through either complete TSC1 loss or MTOR-activating mutation [28] was associated with long-term therapeutic benefit from mTORC1 inhibitors [29]. Interestingly, in our NGS ccRCC cohort, four of six patients with mTOR mutations benefited from first-line everolimus with PFS1L >12 mo. The association of a PBRM1 or BAP1 mutation with better or worse PFS1L, respectively, with everolimus is surprising because higher mTORC1 activity was reported for patients with BAP1 versus PBRM1 mutant ccRCC [30]. Altogether, our data favor an indirect role of BAP1 loss in mTORC1 activation.
In this study, when patients with metastatic ccRCC were stratified into three genotypic groups based on PBRM1 and BAP1 mutations, median OS (mo) was longer in the PBRM1 group (43.5) than in the BAP1 (9.8) or WT (18.1) group in the everolimus-sunitinib arm, whereas median OS was similar in all three groups (BAP1, 29.9; PBRM1, 33.2; WT, 33.1) in the sunitinib-everolimus arm. In the intent-to-treat population the final OS was 22.4 mo with sequential everolimus-sunitinib and 29.5 mo with sequential sunitinib-everolimus. Intriguingly, survival durations of patients in the PBRM1 group of this study demonstrated a median OS of 43.5 mo with sequential everolimus-sunitinib and 33.2 mo with sequential sunitinib-everolimus.
Our analysis puts common RCC mutations into clinical context for patients treated with VEGF and mTOR inhibitors in a clinical trial at the frontline setting and suggests correlative clinical outcome signals for sunitinib and everolimus that warrant further investigation. The importance of tumor mutations in predicting benefit of first-line targeted therapy suggested by the current study necessitates further validation. Nevertheless, we confirmed that VHL, PBRM1, SETD2, BAP1, and KDM5C are the most commonly mutated genes in ccRCC and found that PBRM1 and KDM5C mutations could be associated with better clinical outcomes with everolimus and sunitinib, respectively.
5. Conclusions
Our analysis encompassed a large and relatively homogenous population of patients (all metastatic ccRCC) and included a broad panel of genes. We evaluated standard end points of two classes of targeted agents and showed the impact of genetic alterations on treatment. Our results confirmed prevalent ccRCC mutations, demonstrated distinct mutation enrichment in metastatic ccRCC, showed mutual exclusivity between BAP1 and PBRM1 or KDM5C mutations, and suggested distinct molecular subtypes based on PBRM1, BAP1, and KDM5C mutations could potentially have different efficacy genomic biomarker values for patients with metastatic ccRCC treated with targeted therapies.
Supplementary Material
Targeted next-generation sequencing and clinical correlation analyses of a randomized metastatic renal cell carcinoma first-line targeted therapy trial (RECORD-3) demonstrated enrichment of tumor suppressor gene mutations, showed mutual exclusivity among mutations, and presented distinct molecular subtypes based on PBRM1/BAP1/KDM5C mutations that could have predictive/prognostic values.
Acknowledgments
Editorial assistance was provided by Cathy R. Winter, PhD (ApotheCom, Yardley, PA, USA) and was funded by Novartis Pharmaceuticals Corporation.
Funding/Support and role of the sponsor: This work was supported in part by the National Institutes of Health under award number R01CA138505, the J. Randall & Kathleen L. MacDonald Kidney Cancer Research Fund, the Jill and Jeffrey Weiss Kidney Cancer Research Fund, and Novartis (J.J. Hsieh). RECORD-3 was sponsored by Novartis Pharmaceuticals Corporation.
Footnotes
Publisher's Disclaimer: This is a PDF file of an unedited manuscript that has been accepted for publication. As a service to our customers we are providing this early version of the manuscript. The manuscript will undergo copyediting, typesetting, and review of the resulting proof before it is published in its final citable form. Please note that during the production process errors may be discovered which could affect the content, and all legal disclaimers that apply to the journal pertain.
Author contributions: James J. Hsieh had full access to all the data in the study and takes responsibility for the integrity of the data and the accuracy of the data analysis.
Study concept and design: Hsieh, Chen, Wang, Marker, Voi, Motzer.
Acquisition of data: Hsieh, Chen, Wang, Marker, Redzematovic, Selcuklu, Bouvier, Huberman, Bhanot, Chevinsky, Patel, Pinciroli, You, Lee, Socci, Knox.
Analysis and interpretation of data: Hsieh, Chen, Wang, Marker, Cheng, Hakimi, Weinhold, Lee, Voss, Voi, Motzer.
Drafting of the manuscript: Hsieh.
Critical revision of the manuscript for important intellectual content: All authors.
Statistical analysis: Chen, Marker.
Obtaining funding: Hsieh.
Administrative, technical, or material support: Hsieh, Chen, Marker. Supervision: Hsieh.
Other: None.
Financial disclosures: James J. Hsieh certifies that all conflicts of interest, including specific financial interests and relationships and affiliations relevant to the subject matter or materials discussed in the manuscript (eg, employment/affiliation, grants or funding, consultancies, honoraria, stock ownership or options, expert testimony, royalties, or patents filed, received, or pending), are the following: Hsieh has received research grants from Novartis, Pfizer, and CGI and has served as a consultant for Novartis, Chugai, and Eisai. Chen is an employee of and a stockholder in Novartis Pharmaceuticals Corporation. Marker is an employee of and a stockholder in Novartis Pharmaceuticals Corporation. Patel is an employee of Novartis Pharmaceuticals Corporation. Lee is a stockholder in AbbVie, Abbott Laboratories, and Immunogen, Inc. Socci has received consulting or advisory fees from Champions Oncology. Voss has received research grants from BMS and Pfizer, consulting fees from Novartis and Bayer, and honoraria from Novartis. Voi is an employee of and a stockholder in Novartis Pharmaceuticals Corporation. Motzer has received research grants from Novartis, Pfizer, BMS, GlaxoSmithKline, Genentech, Exelixis, and Eisai, consulting or advisory compensation from Pfizer, and compensation for providing expert testimony for Pfizer.
References
- 1.Kaelin WG., Jr The von Hippel-Lindau tumour suppressor protein: O2 sensing and cancer. Nat Rev Cancer. 2008;8:865–73. doi: 10.1038/nrc2502. [DOI] [PubMed] [Google Scholar]
- 2.Cancer Genome Atlas Research N. Comprehensive molecular characterization of clear cell renal cell carcinoma. Nature. 2013;499:43–9. doi: 10.1038/nature12222. [DOI] [PMC free article] [PubMed] [Google Scholar]
- 3.Hakimi AA, Chen YB, Wren J, et al. Clinical and pathologic impact of select chromatin-modulating tumor suppressors in clear cell renal cell carcinoma. Eur Urol. 2013;63:848–54. doi: 10.1016/j.eururo.2012.09.005. [DOI] [PMC free article] [PubMed] [Google Scholar]
- 4.Hakimi AA, Ostrovnaya I, Reva B, et al. Adverse outcomes in clear cell renal cell carcinoma with mutations of 3p21 epigenetic regulators BAP1 and SETD2: a report by MSKCC and the KIRC TCGA Research Network. Clin Cancer Res. 2013;19:3259–67. doi: 10.1158/1078-0432.CCR-12-3886. [DOI] [PMC free article] [PubMed] [Google Scholar]
- 5.Joseph RW, Kapur P, Serie DJ, et al. Clear cell renal cell carcinoma subtypes identified by BAP1 and PBRM1 expression. J Urol. 2016;195:180–7. doi: 10.1016/j.juro.2015.07.113. [DOI] [PMC free article] [PubMed] [Google Scholar]
- 6.Motzer RJ, Jonasch E, Agarwal N, et al. Kidney cancer, version 3.2015. J Natl Compr Canc Netw. 2015;13:151–9. doi: 10.6004/jnccn.2015.0022. [DOI] [PubMed] [Google Scholar]
- 7.Motzer RJ, Barrios CH, Kim TM, et al. Phase II randomized trial comparing sequential first-line everolimus and second-line sunitinib versus first-line sunitinib and second-line everolimus in patients with metastatic renal cell carcinoma. J Clin Oncol. 2014;32:2765–72. doi: 10.1200/JCO.2013.54.6911. [DOI] [PMC free article] [PubMed] [Google Scholar]
- 8.Knox JJ, Barrios CH, Kim TM, Cosgriff T, Srimuninnimit V. Final overall survival analysis for the RECORD-3 study of first-line everolimus followed by sunitinib versus first-line sunitinib folowed by everolimus in metastatic RCC. J Clin Oncol. 2015;33 abstract 4554. [Google Scholar]
- 9.Wells JC, Stukalin I, Norton C, et al. Third-line targeted therapy in metastatic renal cell carcinoma: results from the International Metastatic Renal Cell Carcinoma Database Consortium. Eur Urol. doi: 10.1016/j.eururo.2016.05.049. In press. http://dx.doi.org/10.1016/j.eururo.2016.05.049. [DOI] [PubMed]
- 10.Voss MH, Hakimi AA, Pham CG, et al. Tumor genetic analyses of patients with metastatic renal cell carcinoma and extended benefit from mTOR inhibitor therapy. Clinical Cancer Res. 2014;20:1955–64. doi: 10.1158/1078-0432.CCR-13-2345. [DOI] [PMC free article] [PubMed] [Google Scholar]
- 11.Kwiatkowski DJ, Choueiri TK, Fay AP, et al. Mutations in TSC1, TSC2, and MTOR are associated with response to rapalogs in patients with metastatic renal cell carcinoma. Clin Cancer Res. 2016;22:2445–52. doi: 10.1158/1078-0432.CCR-15-2631. [DOI] [PMC free article] [PubMed] [Google Scholar]
- 12.Ho TH, Choueiri TK, Wang K, et al. Correlation between molecular subclassifications of clear cell renal cell carcinoma and targeted therapy response. Eur Urol Focus. 2016;2:204–9. doi: 10.1016/j.euf.2015.11.007. [DOI] [PubMed] [Google Scholar]
- 13.Motzer RJ, Bacik J, Murphy BA, Russo P, Mazumdar M. Interferon-α as a comparative treatment for clinical trials of new therapies against advanced renal cell carcinoma. J Clin Oncol. 2002;20:289–96. doi: 10.1200/JCO.2002.20.1.289. [DOI] [PubMed] [Google Scholar]
- 14.Cheng DT, Mitchell TN, Zehir A, et al. Memorial Sloan Kettering-Integrated Mutation Profiling of Actionable Cancer Targets (MSK-IMPACT): a hybridization capture-based next-generation sequencing clinical assay for solid tumor molecular oncology. J Mol Diagn. 2015;17:251–64. doi: 10.1016/j.jmoldx.2014.12.006. [DOI] [PMC free article] [PubMed] [Google Scholar]
- 15.Gao J, Aksoy BA, Dogrusoz U, et al. Integrative analysis of complex cancer genomics and clinical profiles using the cBioPortal. Sci Signal. 2013;6:pl1. doi: 10.1126/scisignal.2004088. [DOI] [PMC free article] [PubMed] [Google Scholar]
- 16.Sato Y, Yoshizato T, Shiraishi Y, et al. Integrated molecular analysis of clear-cell renal cell carcinoma. Nat Genet. 2013;45:860–7. doi: 10.1038/ng.2699. [DOI] [PubMed] [Google Scholar]
- 17.Kapur P, Pena-Llopis S, Christie A, et al. Effects on survival of BAP1 and PBRM1 mutations in sporadic clear-cell renal-cell carcinoma: a retrospective analysis with independent validation. Lancet Oncol. 2013;14:159–67. doi: 10.1016/S1470-2045(12)70584-3. [DOI] [PMC free article] [PubMed] [Google Scholar]
- 18.Rini BI, Campbell SC, Escudier B. Renal cell carcinoma. Lancet. 2009;373:1119–32. doi: 10.1016/S0140-6736(09)60229-4. [DOI] [PubMed] [Google Scholar]
- 19.Voss MH, Molina AM, Motzer RJ. mTOR inhibitors in advanced renal cell carcinoma. Hematol Oncol Clin North Am. 2011;25:835–52. doi: 10.1016/j.hoc.2011.04.008. [DOI] [PMC free article] [PubMed] [Google Scholar]
- 20.Albiges L, Oudard S, Negrier S, et al. Complete remission with tyrosine kinase inhibitors in renal cell carcinoma. J Clin Oncol. 2012;30:482–7. doi: 10.1200/JCO.2011.37.2516. [DOI] [PubMed] [Google Scholar]
- 21.Wei EY, Hsieh JJ. A river model to map convergent cancer evolution and guide therapy in RCC. Nat Rev Urol. 2015;12:706–12. doi: 10.1038/nrurol.2015.260. [DOI] [PubMed] [Google Scholar]
- 22.Gerlinger M, Rowan AJ, Horswell S, et al. Intratumor heterogeneity and branched evolution revealed by multiregion sequencing. N Engl J Med. 2012;366:883–92. doi: 10.1056/NEJMoa1113205. [DOI] [PMC free article] [PubMed] [Google Scholar]
- 23.Hsieh JJ, Manley BJ, Khan N, Gao J, Carlo MI, Cheng EH. Overcome tumor heterogeneity-imposed therapeutic barriers through convergent genomic biomarker discovery: a braided cancer river model of kidney cancer. Semin Cell Dev Biol. doi: 10.1016/j.semcdb.2016.09.002. In press. http://dx.doi.org/10.1016/j.semcdb.2016.09.002. [DOI] [PMC free article] [PubMed]
- 24.Sankin A, Hakimi AA, Mikkilineni N, et al. The impact of genetic heterogeneity on biomarker development in kidney cancer assessed by multiregional sampling. Cancer Med. 2014;3:1485–92. doi: 10.1002/cam4.293. [DOI] [PMC free article] [PubMed] [Google Scholar]
- 25.Niu X, Zhang T, Liao L, et al. The von Hippel-Lindau tumor suppressor protein regulates gene expression and tumor growth through histone demethylase JARID1C. Oncogene. 2012;31:776–86. doi: 10.1038/onc.2011.266. [DOI] [PMC free article] [PubMed] [Google Scholar]
- 26.Linehan WM, Srinivasan R, Schmidt LS. The genetic basis of kidney cancer: a metabolic disease. Nat Rev Urol. 2010;7:277–85. doi: 10.1038/nrurol.2010.47. [DOI] [PMC free article] [PubMed] [Google Scholar]
- 27.Hakimi AA, Reznik E, Lee CH, et al. An integrated metabolic atlas of clear cell renal cell carcinoma. Cancer Cell. 2016;29:104–16. doi: 10.1016/j.ccell.2015.12.004. [DOI] [PMC free article] [PubMed] [Google Scholar]
- 28.Xu J, Pham CG, Albanese SK, et al. Mechanistically distinct cancer-associated mTOR activation clusters predict sensitivity to rapamycin. J Clin Invest. 2016;126:3526–40. doi: 10.1172/JCI86120. [DOI] [PMC free article] [PubMed] [Google Scholar]
- 29.Voss MH, Hsieh JJ. Therapeutic Guide for mTOuRing through the braided kidney cancer genomic river. Clin Cancer Res. 2016;22:2320–2. doi: 10.1158/1078-0432.CCR-16-0035. [DOI] [PMC free article] [PubMed] [Google Scholar]
- 30.Pena-Llopis S, Vega-Rubin-de-Celis S, Liao A, et al. BAP1 loss defines a new class of renal cell carcinoma. Nature Genet. 2012;44:751–9. doi: 10.1038/ng.2323. [DOI] [PMC free article] [PubMed] [Google Scholar]
Associated Data
This section collects any data citations, data availability statements, or supplementary materials included in this article.