

Abstract
A nanowire-like WSe2-graphene catalyst was prepared via ultra-sonication and was tested in terms of the photocatalytic reduction of CO2 into CH3OH under irradiation with UV/visible light. The prepared nano-composite was further characterized via XRD, SEM, TEM, Raman and XPS. The photocurrent analysis was further tested for its photocatalytic reduction of CO2 using gas chromatography (GCMS-QP2010 SE). To further improve the the photo-catalytic efficiency, a sacrificial agent (Na2S/Na2SO3) was added to the WSe2-graphene nanocomposite and was found to improve the photo-catalytic efficiency, with the methanol yield reaching 5.0278 µmol g−1h−1. Our present work provides a convenient way to prepare nanomaterials various morphologies that have future applications for environmental remediation.
Introduction
The increase in the amount of the CO2 emissions in the environment has reached an alarming level, greatly contributing to global warming1, and in the last few decades, the shortage of fossil fuel resources has resulted in an increased demand for energy production from different sources, including photovoltaic and photocatalytic H2 production. One such technology is photocatalytic CO2 reduction, which is a most valuable approach to overcome both global environmental and energy problems due its low cost, clean energy production, and environmental friendliness2, 3. In particular, the photocatalytic reduction of CO2 can convert noxious gasses (carbon dioxide) into profitable solar fuels, i.e., CO, HCHO, CH3OH, and CH4 by using solar energy4, 5. To date, many photocatalysts such as TiO2, CdS, g-C3N4, ZnO and Bi2WO6 have been shown to achieve the photo reduction of CO2 6–10. Unfortunately, there are limits to the practical applicability of these semiconductors because the efficiency of the CO2 conversion into useful products is very low due to many factors of the CO2 reduction process, e.g., band gap tuning, charge carrier recombination, and light utilization11. Due to the wide band gap energy, most materials are unable to absorb visible light, and on the other hand, small band gap semiconductors exhibit a fast recombination phenomenon. To overcome this and to find an achievable process, highly efficient, low cost transition metal dichalcogenides (TMDC) have been investigated12–15. The generalized formula for TMDs is MX2, where M = transition metal element of group 4, 5 or 6 and X represents a chalcogen. Tungsten diselenide (WSe2) is a semiconductor that belongs to the TMDC family. Its structure consists of Selenium and tungsten held together by a weak van der Waals force that allow the material to be exfoliated into monolayers16, 17. Moreover WSe2 is a layered semiconductor with a small band gap of approximately 1.6 eV18. It has unique electrical transport performance, and its use was recently reported in many advanced energy storage applications, such as in superconductors19, lithium ion batteries20, photodetectors21, and photocatalytic hydrogen production22 in solar cells. Furthermore, Li, Yanguang et al. and Merki, Daniel et al. indicated that both the theoretical calculation and experimental results for the hydrogen evolution reaction of transition metal dichalcogenide (WSe2) materials appears to be from active edge sites that play an important role in hydrogen evolution reaction catalysis23, 24. However, due to the intrinsic interlayer Van der Waals attraction, the layered TMDC materials can be easily re-stacked as a result of reducing the active edge sites. Therefore, to improve photocatalyitc activity, the TMDC (WSe2) materials are combined with 2D carbon material such as graphene.
Graphene has unique properties, including a large surface area, good conductivity, and high flexibility, and it is used in high-performance energy storage devices25, 26. Therefore, coupling with a photocatalyst may improve the photocatalytic reduction efficiency of CO2 to fulfill the practical requirements. Liange et al. first described that coupling with a semiconductor is one of the best ways to boost the photocatalytic reduction efficiency of CO2 27. Recently, graphene coupled with TMDCs (WSe2) was reported for the hydrogen evolution reaction (HER)28, high-performance oxygen reduction reaction (ORR)29 and in a superconductor30. However, the WSe2 chalcogenide family has not yet been analyzed for the photocatalytic reduction activity of CO2. In the present study, we report on WSe2-graphene nano composites prepared via ultra-sonication. The prepared samples (WSe2-graphene) were used for CO2 reduction, and the results exhibit a high efficiency for photo catalytic CO2 conversion under UV and visible light irradiation.
Results and Discussion
Characterization of catalytic materials
The XRD patterns of the WSe2-graphene nanocomposites is shown in Fig. 2(a), the diffraction peaks at 13.54, 32.50, 38.45, 41.86, 47.75, 56.25, 58.10, 66.77, 69.45, 72.55 and 76.78° correspond to (002), (100), (103), (006), (105), (112), (200), (203), (116) and (205) directions, respectively (a = b = 0.329 nm, c = 1.298 nm, JCPDS PDF# 00-38-1388)28, 29. However, no other diffraction peaks form any other chemical species were observed in the prepared sample. For the GO analysis, a sharp peak (002) occurs at 13.44°, revealing that the graphite power was converted into graphene oxide by expanding the d-spacing from 3.5 to 6.78 Å31, 32. Moreover, the results indicate that the XRD signals of GO are very weak and are overlapped with those of WSe2-graphene at 13.54°. Therefore, the measurements were unable to detect the weaker diffraction peaks of GO33. Further EDX spectra confirm the presence of the main elements in the catalyst composites. The Fig. 2(b) shows the presence of the prime elements C, O, W, and Se, The C elemental peak is derived from graphene sheet, and W, Se and O are the precursor material.
Figure 2.
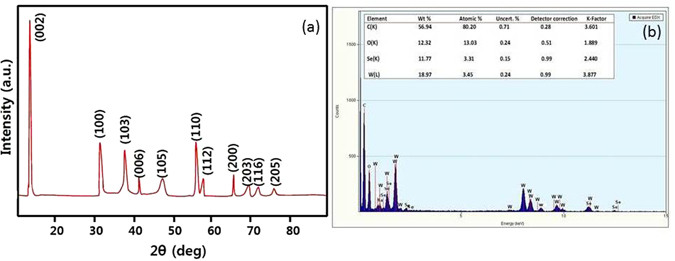
(a) XRD pattern and (b) EDX of WSe2-graphene composite.
SEM observations were carried out to investigate the surface and structural morphology. Figure 3 shows the SEM images of WSe2-graphene at different magnifications. Figure 3(a) shows the wire-like and nanoscale WSe2 morphology composed of interlaced and ultrathin nanosheets uniformly dispersed on the graphene nanosheet. Figure 3(b) and (c) show that graphene has an irregular structure that is broken off in different directions. Figure 3 also indicates that the WSe2 nanowires extensively grow on the surface of the graphene nanosheet. Figure 3(c) depicts bright nanowire WSe2 shapes that are properly coated on the graphene surface, indicating that graphene nanosheets provide a good platform for the nucleation and successive growth of WSe2 layers, and growth on WSe2 in graphene is possible due to the precursors that are attached to the graphene oxide through functional groups 23, 34–36. Figure 4(a–d) shows transmission electron microscopy (TEM) that further confirms the morphology and shape of the WSe2-graphene nanocomposites. Figure 4(a–c) shows the WSe2-graphene nanocomposites at different magnifications. The WSe2 is clearly seen to have dark imaged compounds that are almost very small in a spherical form, layer form, and a highly agglomerated structure attached to the surface of the graphene sheets. Moreover, several layers of the WSe2 are covered with the graphene nano sheets, and the average size of the WSe2 is measured to be approximately 6 to 10 um using the ImageJ software.
Figure 3.
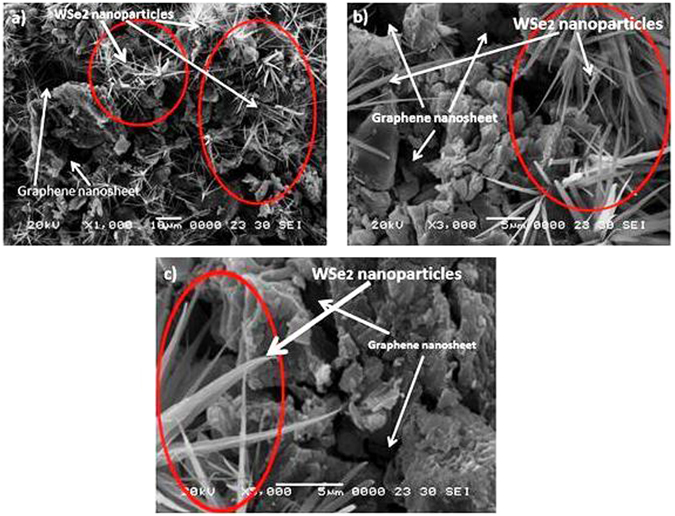
SEM imges of WSe2-graphene composite with different mignification.
Figure 4.
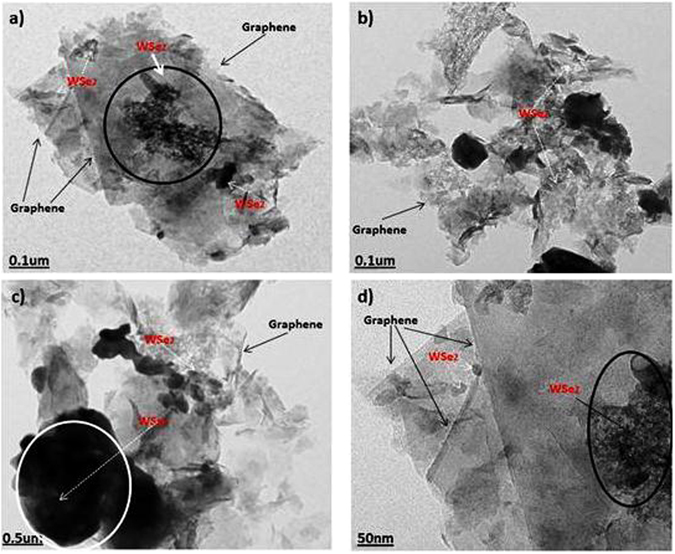
TEM image of WSe2-graphene.
Figure 4(d) shows the formation of single-crystalline and few-layered WSe2 nanosheets. Different WSe2 flakes indicating that the particles sizes fluctuate between 30 nm to 190 nm. When compared to the bulk material, the size of the WSe2 layers decreases, which is may be due to the discontinuity of the particles induced by sonication and particle selection by centrifugation37. The precise structural properties of the WSe2-graphene were analyzed via Raman spectroscopy. Figure 5 provides comprehensive detail of the GO and WSe2 nannocomposites (e.g., crystal structure and no. of layers), Fig. 5 shows the Raman signature energy band of the WSe2 located at 200 to 400 cm−1. The typical Raman spectra for WSe2 shows a band at the A1g (out-of-plane) (255 cm−1) and E12g (inplane) mode (250 cm−1)38.
Figure 5.
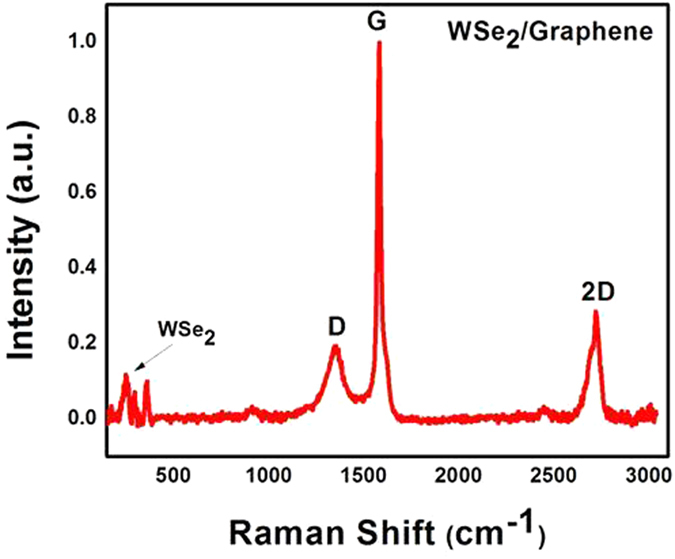
Raman spectra of the WSe2-graphene nanocomposite.
Figure 5 also shows that the characteristics of the graphene Raman shifts for the D, G, and 2D bands. The D band is located at 1360 cm−1, which shows the presence of disorder in the atomic arrangements or edge effect of graphene, while the G band appears at 1590 cm−1. Both the G and D band show the vibration of the carbon atoms in disorder or defect sites and the in-plane vibration of sp2 and sp3 bonded carbon atoms39. These two bands (D 1360 cm−1, G 1590 cm−1) indicate an interaction between rGO and selenide nanosheets, which improves the stability of the catalyst interface and provides a high stability for the nanocomposites. A 2D band appears at 2690 cm−1 to express the degree of graphitization. Moreover, the 2D band is smaller than the G band in our spectrum, which indicates the presence of a few layers of graphene sheets40–43.
XPS measurements were carried out to assess the elemental composition of the WSe2-graphene nanocomposite. Figure 6(a) shows the XPS spectrum, which indicates the presence of W, Se, C and O and shows the formation WSe2-graphene nanocomposite. Figure 6(b) shows the XPS spectrum of W and the binding energies of W4f7/2, Wf5/2 and W5p3/2 at positions of 31.90, 34.80 and 37.90 eV, respectively. The W4f7/2 and Wf5/2 binding energy peaks express the elemental chemical binding state of W, while the peak positioned at 37.70 eV is attributed to the core level of W5p3/2 from WO3 due to the partial oxidation of the WSe2 layers44, 45. The binding energy for the Se 3d3/2 core level peak of 54.90 eV confirms a lattice Se−2 of the WSe2-graphene hybrid (Fig. 6c). The core peak level of Se3d between 50 to 56 eV shows the absorbance of pure Se in a catalysts, which is conclude that WSe2-graphene nanocomposite is free from any impurity46, 47. Figure 6(d) shows the core level XPS spectrum of the O1s, peak located at 532.90 eV, which shows the carbonyl and carboxyl groups, while the C1s (Fig. 6(e)) spectrum is located at 284.5 eV. These results show that the spectra can fit with oxygen containing functional groups (C-C, C-O), which is evident in the reduction of GO to rGO48–52.
Figure 6.
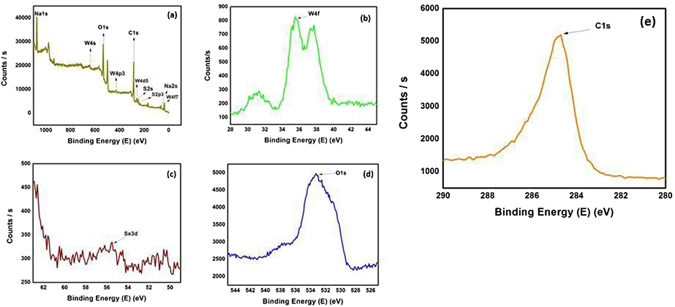
XPS spectra of the WSe2-graphene nanocomposite: (a) survey scan spectra (b) W4f (c) Se3d (d) O1s and (e) C1s.
The UV-vis diffuse reflectance spectrum of the WSe2-graphene nanocomposite was displayed in Fig. 7(a). The band gap energy value was achieved where the straight line approaching the curve intersects the horizontal axis. As the results from Fig. 7(a), the band gap energy values of the WSe2-graphene nanocomposite was 2.68 eV. The photoelectrochemical current response was investigated by employing different materials to decorate the ITO sheet used as a photoanode. The photocurrent of each prepared sample was calculated in a 0.1 M KCl solution containing 0.1 M TEA under “on-off” light illumination cycles at a bias of 0 V vs. Ag/AgCl, as shown in Fig. 7(b). The photoresponse for graphene was non-existent because graphene could not be excited, as shown in curve a53 to the nature of graphene, which requires further reduction steps to generate a photocurrent signal54. This Fig. 7(b) displays the photocurrent response of the ITO/WSe2-graphene based on time, which was repeatedly measured five times at 20-s intervals under visible irradiation. No current was observed in the dark, which clearly suggests that no photoinduced charge separation took place. When the light was turned on, the photocurrent intensity was significantly increased to 121.21 μA. This may have been due to the photoinduced electron–hole separation at the WSe2, in which the holes were scavenged by the TEA, and graphene acted as an electron transfer medium. Thus, the electrons were transported to the ITO electrode, resulting in photocurrent generation. The electrode showed a pronounced and stable photocurrent response during the light “on-off” condition, which it maintained.
Figure 7.

DRS of the WSe2-graphene composite and photocurrent measurement with pure WSe2 semiconductor (a) and WSe2-graphene modified photoelectrodes (b).
Photocatalytic performance
We assessed the photocatalytic activity of the pure WSe2 and WSe2-graphene composites for 48 h during UV (λ > 300) and visible (λ > 400) light irradiation, and every 12 h interval sample withdraw manually from the reactor using a gas-tight syringe, then the collected sample was centrifuged and characterized via gas chromatography. Figure 8 displays the CH3OH yield for the pure WSe2 and WSe2-g nanocomposites. The control experiment determined that no methanol yield was produced in the absence of photocatalysts or light irradiations or both. The gas chromatographic study shows that only CH3OH was successfully achieved as a reduction product. Furthermore, graphene is an electron donor for the reduction of CO2 as a substitute carbon source to produce CH3OH, and H2O was a reactant of the CO2 reduction. Figure 8(a) shows that the effect of the photocatalytic reduction of CO2 with pure WSe2 and WSe2-graphene under UV light was higher than that for the same composite under visible light.
Figure 8.
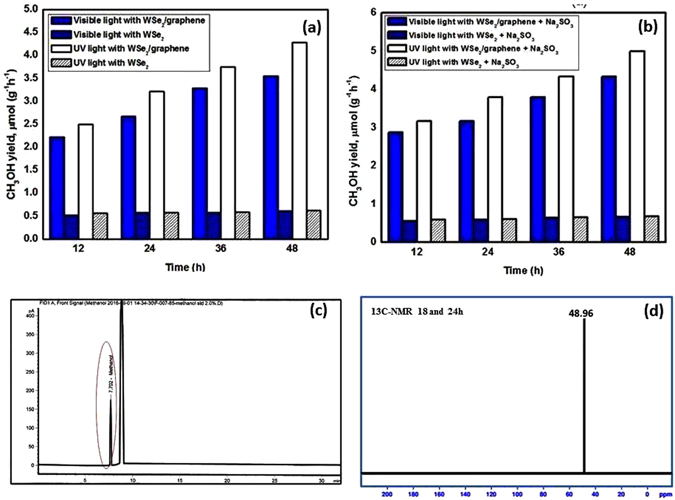
The methanol yields in the photocatalytic reduction of CO2 under UV/visible light irradiation by using pure WSe2 and WSe2-graphene nanocomposits as phtocatalyst (a) without Na2SO3, (b) with Na2SO3 (c) GC chromatogram of photoreaction using WSe2-graphene, after 48 h and (d) 13 C NMR (Proton decoupled).
The methanol yields and quantum yields for the WSe2-graphene nanocomposite with different time intervals and different conditions under UV/Visible light irradiation are shown in Tables 1 and 2. The methanol yield and quantum yield with WSe2-graphene (12 h), WSe2-graphene (24 h), WSe2-graphene (36 h) and WSe2-graphene (28 h) under visible light were 2.2434 (0.3285), 2.7021 (0.4435), 3.3243 (0.5346) and 3.5509 (0.5779) µmol g−1h−1, and under UV light were 2.8854 (0.4596), 3.1835 (0.3165), 3.7778 (0.6040) and 4.3257 (0.7053) µmol g−1h−1, respectively. Na2SO3 was used as a sacrificial reagent to further enhance the catalytic activity of the binary graphene-based nanocomposites in the photoreduction of CO2, as shown in Fig. 8. Figure 8(b) shows that the efficiency of the methanol yield of the pure WSe2 and WSe2-graphene nanocomposite under UV/visible light is almost two times greater than that of the nanocomposite without using scavenger (Na2SO3), and Fig. 8(c) shows a GC calibration curve for the quantification of methanol after 48 hours. The sacrificial reagent plays a crucial role in attaining the stability of the photocatalysts because of the well-known process of photocorrosion of sulfides. For further confirmation of final product CH3OH, the products were recovered after 18 h and 24 h of irradiation and analyzed by 13 C NMR (Proton decoupled) (Fig. 8d). A single peak was obtained at 48.96 ppm for both, as it is due to methanol, it is verified that photocatalytic conversions of CO2 yield mainly CH3OH. It is also substantiated by GC. For stability and recyclability, the WSe2-graphene nanocomposite was tested for photocatalytic conversion of CO2 into CH3OH under UV/Visible light irradiation. The WSe2-graphene (48 h) was reused for six consecutive runs, and only a minor change in the CH3OH yield rate was found, indicating that the prepared nanocomposite highly stable and can be used for a continuous photocatalytic reduction system of CO2.
Table 1.
Methanol Production condition with methanol yields and quantum yields under visible light.
| WSe2-graphene (visible light) | CH3OH yields (µmol g−1 h−1) | Quantum yields (QE) |
|---|---|---|
| WSe2- graphene (12 h) | 2.2434 | 0.3285 |
| WSe2- graphene (24 h) | 2.7021 | 0.4435 |
| WSe2- graphene (36 h) | 3.3243 | 0.5346 |
| WSe2- graphene (48 h) | 3.5509 | 0.5779 |
| WSe 2 - graphene + Na 2 SO 3 (visible light) | CH 3 OH yields (µmol g −1 h −1 ) | Quantum yields (QE) |
| WSe2- graphene (12 h) | 2.8854 | 0.4596 |
| WSe2- graphene (24 h) | 3.1835 | 0.3165 |
| WSe2- graphene (36 h) | 3.7778 | 0.6040 |
| WSe2- graphene (48 h) | 4.3257 | 0.7053 |
Table 2.
Effect of preparation method on methanol yields and quantum yields under Uv light.
| WSe2- graphene (UV light) | CH3OH yields (µmol g−1 h−1) | Quantum yields (QE) |
|---|---|---|
| WSe2- graphene (12 h) | 2.5134 | 0.3776 |
| WSe2- graphene (24 h) | 3.2686 | 0.4294 |
| WSe2- graphene (36 h) | 3.7746 | 0.5672 |
| WSe2- graphene (48 h) | 2.3523 | 0.3535 |
| WSe 2 - graphene + Na 2 SO 3 (UV light) | CH 3 OH yields (µmol g −1 h −1 ) | Quantum yields (QE) |
| WSe2- graphene (12 h) | 3.1848 | 0.4115 |
| WSe2 - graphene (24 h) | 3.7765 | 0.5606 |
| WSe2- graphene (36 h) | 4.3246 | 0.6530 |
| WSe2- graphene (48 h) | 5.0278 | 0.8159 |
A further explanation of the proposed photocatalytic mechanism is given in Fig. 9, which shows that the WSe2 nanomaterial absorbs light of the solar spectrum and creates photo-generated charge carriers (holes and electrons). However, due to the narrow bandgap of the WSe2 nanocomposite, these electron-holes recombine very quickly, and their photocatalytic efficiency is therefore limited. To improve the photocatalytic efficiency, the WSe2 nanocomposite was attached to a graphene nanosheet since graphene is an electron accepter/transporter that plays an important role in the separation of the transport electron-hole pairs in the binary system55. The excited electron and hole in the conduction band of WSe2 can be conveniently shifted to the graphene nanosheet, which decelerates the recombination of the electron-hole pairs and thus promotes the electron transport to the catalytic sites for the photo reduction of CO2. The graphene with a large surface area and many defective sites absorbs the CO2, and the photo-generated electrons on the WSe2 are transmitted to the catalytic sites of the graphene and then reduce the absorbed CO2 into CH3OH2, 56. However, the photocatalytic reduction mechanism contains a series of water oxidation and the reduction processes, as shown in Fig. 9. The photo-induced holes on the WSe2-g VB could absorb water molecules to form hydroxyl radicals (OH·), and then the hydroxyl radicals further oxidize the protons (H+) and oxygen. In the meantime, electrons in the conductor band transfer and absorb CO2 to form ·CO− 2. The ·CO−2 reacts with ·H radical, which then leads to the formation of a series of radicals, finally producing CH3OH.
Figure 9.
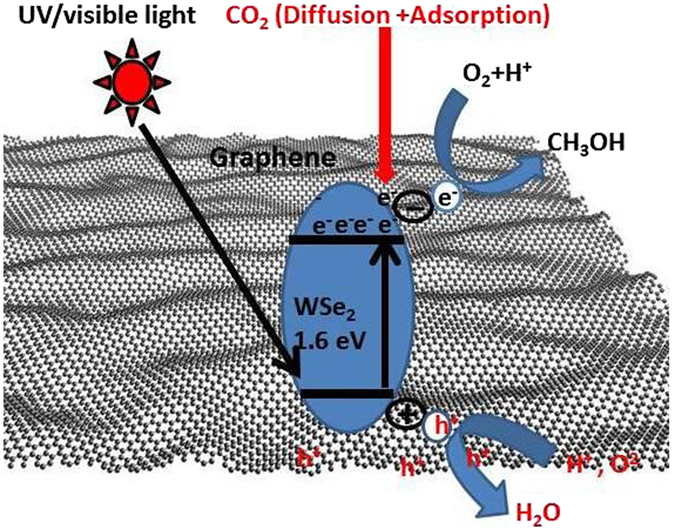
Mechanism study of photocatalytic reduction of CO2.
Reaction Mechanism.
CO2 reaction.
Methods
Experimental setup and Materials
Tungsten (VI) oxide (WO3), selenium powder (Se, 99%), ammonium hydroxide (NH4OH, 25–28%), Sodium sulfite (Na2SO3 ·7H2O, 95%), Nitric acid (HNO3) and ethyl alcohol (94%) were purchased from Duksan Pure Chemical Co. Ltd., Korea. All chemicals were used without further purification, and all dilutions were carried out using distilled water.
Preparation of Graphene
Graphene oxide was prepared in the laboratory following Hummer-Offeman’s method, as previously reported in the literature57, 58. A typical preparation method for graphene is as follows. First, 20 g of natural graphite and H2SO4 (450 ml) are put in de-ionized (DI) water and are stirred continuously for one hour at 0 C. After that, 45 g of KMnO4 are slowly mixed with the solution (graphite + H2SO4) and are constantly stirred at a temperature of 35 °C until it becomes a dim brownish color. Then, the container is sealed and kept at 100 °C with vigorous stirring for 30 min. Meanwhile 20% H2O2 is added drop wise within 5 min. After that, the solution is washed with acetone and 10% HCl several times to remove the residual metal ions. The solution was then heat-treated in a dry oven at 90 °C for 12 h to obtain the graphite oxide power, then 250 mg graphite oxide power were added to 200 ml DI water, were vigorously stirred for 30 min, and were then ultrasonicated (using Ultrasonic Processor, VCX 750) for 2 h. Finally, the resulting solution was refined and washed several times with hot water and kept in a dry oven for 6 h to obtain the graphene oxide powder.
Preparation of the WSe2 composite
In a typical synthesis process, 0.675 g tungsten (vi) oxide (WO3) are dispersed in deionized water, 0.5 M nitric acid are then added drop wise in a three-necked flask (100 mL), and the mixture is heated to 120 °C to eliminate H2O and O2. In a separate flask, 1.5 g of anhydrous sodium sulfite (Na2SO3) and 0.3 g crude selenium (Se) powder were dispersed in 200 ml of ethylene glycol with continuous magnetic stirring at 80 °C until a selenium salt was obtained. In the next step, both solutions are transferred to a stainless steel autoclave with a Teflon liner with 20 mL capacity for 24 h at 250 °C in an electric furnace. Finally, the WSe2 precipitates are cooled to room temperature, the prepared solution is filtered using 47-mm Whatman filter paper, and the remaining material is heated to a temperature of 350 K for 12 h to obtain a WSe2 power.
Preparation of WSe2-graphene nanocomposite
Graphene oxide (200 mg) was added in 150 ml ethylene glycol and was then exfoliated to generate a graphene oxide nanosheet (GONS) dispersion solution via ultrasonication for 30 min. The WSe2 powder from the above solution is mixed at equal volumetric ratios of 1:1, and the mixture is sonicated at room temperature for 6 h using a controllable serial-ultrasonic apparatus (Ultrasonic Processor, VCX 750, 500 Watt, Korea, Power 500 Watt, frequency 20 KHz, Amplitude 50%, low intensity). The reaction solution was allowed to cool and settle at room temperature after filtering with 47-mm Whatman filter paper with a pore size of 0.7 mm. The resulting powder was washed with distilled water multiple times and was dried in a vacuum oven at 80 °C for 12 h before heat treatment at 500 °C for 1 h with (Ar) inert atmosphere. The prepared sample was then labeled as WSe2-graphene.
Characterization
The crystal structure and morphology of the prepared samples were measured using monochromatic high intensity Cu Kα radiation (λ = 1.5406 Å) in XRD (Shimadzu XD-D1), Energy dispersive X-ray spectrometer (EDX) was used to measure the atomic percentage of W, Se, and C elements, SEM (JSM-5600 JEOL, Japan) and TEM (JEOL, JEM-2010, and Japan) observations. X-ray photoelectron spectroscopy (XPS) was performed using a VG Scientific VISACA Lab 2000 device with a monochromatic Mg X-ray radiation source, and the Raman spectra of the prepared samples were observed using a spectrometer (Jasco Model Name NRS-3100) with an excitation laser wavelength of 532.06 nm. For quantitative analysis of the CH3OH, a Standard Gas Chromatograph-Mass Spectrometer (GCMS-QP2010 SE) was used with a long column. Photoelectrochemical measurements were performed using a self-made photoelectrochemical system installed a 250-W halogen lamp as the irradiation source. The photocurrent measurement was performed by a computer-controlled Versa-STAT-3 electrochemical analyzer. A WSe2-graphene modified photoelectrode with an active area of 1 cm2 was used as the working electrode, and a Pt wire and saturated Ag/AgCl were used as the counter and reference electrodes, respectively. All the photocurrent measurements were conducted by dipping the WSe2-graphene modified photoelectrode into a mixture of 0.1 M KCl and 0.5 M TEA at a constant potential of 0 V vs. Ag/AgCl.
Photocatalytic reduction of CO2
The reduction of CO2 with H2O in the photocatalytic experiments was carried in a reactor designed in our laboratory, as shown in Fig. 1. The reactor consists of three parts: (1) light source, (2) closed chamber, (30 cm length × 2.0 diameter), (3) CO2 + N2 gas (N2 gas was used to remove gasses from the reactor). 100 mg of photocatalyst (WSe2-graphene) and Na2SO3 as hole scavenger59 were added in 20 ml distilled water containing sodium bicarbonate (NaHCO3, 0.04 M) and were constantly stirred for one hour. Ultra-high-purity grade CO2 gas was purged through the reactor for 30 min, and then the suspension solution was magnetically stirred and irradiated with visible light using a metal halide lamp (500 W, SOLAREDGE700, Perfect Light, China). The distance between the light source and the photocatalyst remained at 10 cm, and a heat sink was equipped in the left side of the chamber to remove the lamp heat. Furthermore, the temperatures inside the reactor were kept at 283.15 K. The reaction continued up to 48 h, and in every 12 h interval, the reactor was allowed to cool down naturally for CH3OH desorption from the catalyst. Then, the reaction product was taken from the reactor for GC analysis (GCMS-QP2010 SE).
Figure 1.
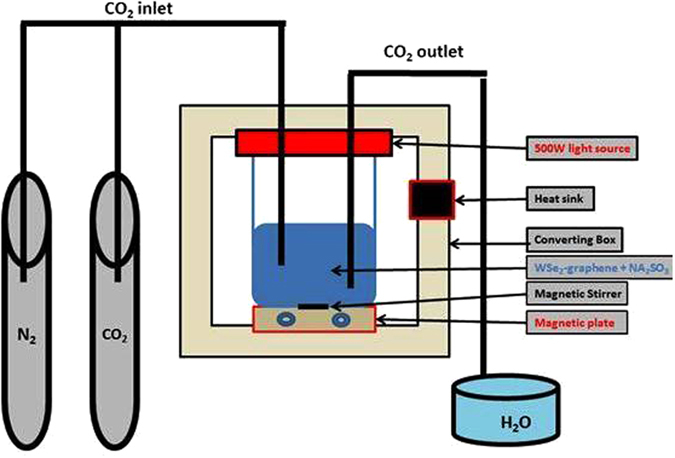
The schematic diagram of CO2 reduction device.
The reaction quantum yield (QE) is estimated using the CH3OH yield, noting that six electrons are required to reduce CO2 to CH3OH. The equation is as follow.
where: I is light intensity (0.12 mW cm−2)
S is the irradiated area of the reactor (30 cm × 15 cm)
E is the photon energy (4.97 × 10⁻¹⁹ J at 400 nm)
NA is Avogadro’s constant (6.02 × 10²³ mol−1)
Conclusion
In summary, the TMDC (WSe2) materials are attached to the graphene nanosheet via ultra-sonication. The SEM and TEM images of the prepared samples show that the WSe2 have nanowire morphology that is uniformly distributed on the graphene sheets, and the average size of the nanowires is verified to be from 30 to 130 nm. The graphene sheet-supported WSe2 nanowire resulting from the binary structure present excited charge carriers with the combined effect of WSe2 and graphene, improving the recombination time. Raman spectroscopy and XPS measurements show an intimate contact and chemical binding interaction between the WS2 and GO. Graphene plays a role as an electron mediator to support a binary system and to help provide stable photocatalyst materials. The CO2 photo reduction experiment was carried out to investigate the photo catalytic reduction of CO2 with the WSe2-G nanocomposite, achieving a maximum photocatalytic efficiency after 48 h. The WSe2-graphene with added Na2SO3 (48 h) showed the highest photocatalytic efficacy and obtained a total CH3OH yield of 5.0278 µmol g−1h−1. Our present work indicates that the attachment of WSe2 on the graphene sheet can further increase the photocatalytic performance, opening new ways to deploy novel, next-generation heterojunction photocatalysts for environmentally-related applications.
Author Contributions
W.C. Oh proposed and supervised the project; Asghar Ali designed and performed the experiments. Asghar Ali analyzed the data and wrote the manuscript. All authors participated in the discussions and provided input on the manuscript.
Competing Interests
The authors declare that they have no competing interests.
Footnotes
Publisher's note: Springer Nature remains neutral with regard to jurisdictional claims in published maps and institutional affiliations.
References
- 1.Lacis AA, Schmidt GA, Rind D, Ruedy RA. Atmospheric CO2: Principal control knob governing Earth’s temperature. Science. 2010;330:356–359. doi: 10.1126/science.1190653. [DOI] [PubMed] [Google Scholar]
- 2.Yu J, Low J, Xiao W, Zhou P, Jaroniec M. Enhanced photocatalytic CO2-reduction activity of anatase TiO2 by coexposed {001} and {101} facets. Journal of the American Chemical Society. 2014;136:8839–8842. doi: 10.1021/ja5044787. [DOI] [PubMed] [Google Scholar]
- 3.Maginn EJ. What to Do with CO2. The Journal of Physical Chemistry Letters. 2010;1:3478–3479. doi: 10.1021/jz101582c. [DOI] [Google Scholar]
- 4.Li X, Wen J, Low J, Fang Y, Yu J. Design and fabrication of semiconductor photocatalyst for photocatalytic reduction of CO2 to solar fuel. Science China Materials. 2014;57:70–100. doi: 10.1007/s40843-014-0003-1. [DOI] [Google Scholar]
- 5.Habisreutinger SN, Schmidt‐Mende L, Stolarczyk JK. Photocatalytic reduction of CO2 on TiO2 and other semiconductors. Angewandte Chemie International Edition. 2013;52:7372–7408. doi: 10.1002/anie.201207199. [DOI] [PubMed] [Google Scholar]
- 6.Ramesha GK, Brennecke JF, Kamat PV. Origin of catalytic effect in the reduction of CO2 at nanostructured TiO2 films. ACS Catalysis. 2014;4:3249–3254. doi: 10.1021/cs500730w. [DOI] [Google Scholar]
- 7.Yuan L, Xu Y-J. Photocatalytic conversion of CO2 into value-added and renewable fuels. Applied Surface Science. 2015;342:154–167. doi: 10.1016/j.apsusc.2015.03.050. [DOI] [Google Scholar]
- 8.Yu J, Wang K, Xiao W, Cheng B. Photocatalytic reduction of CO2 into hydrocarbon solar fuels over g-C3N4–Pt nanocomposite photocatalysts. Physical Chemistry Chemical Physics. 2014;16:11492–11501. doi: 10.1039/c4cp00133h. [DOI] [PubMed] [Google Scholar]
- 9.Ehsan MF, He T. In situ synthesis of ZnO/ZnTe common cation heterostructure and its visible-light photocatalytic reduction of CO2 into CH4. Applied Catalysis B: Environmental. 2015;166:345–352. doi: 10.1016/j.apcatb.2014.11.058. [DOI] [Google Scholar]
- 10.Marszewski M, Cao S, Yu J, Jaroniec M. Semiconductor-based photocatalytic CO2 conversion. Materials Horizons. 2015;2:261–278. doi: 10.1039/C4MH00176A. [DOI] [Google Scholar]
- 11.Cojocaru B, et al. Band gap effect on the photocatalytic activity of supramolecular structures obtained by entrapping photosensitizers in different inorganic supports. Physical Chemistry Chemical Physics. 2009;11:5569–5577. doi: 10.1039/b902348h. [DOI] [PubMed] [Google Scholar]
- 12.Voiry D, et al. Enhanced catalytic activity in strained chemically exfoliated WS2 nanosheets for hydrogen evolution. Nature materials. 2013;12:850–855. doi: 10.1038/nmat3700. [DOI] [PubMed] [Google Scholar]
- 13.Kibsgaard J, Chen Z, Reinecke BN, Jaramillo TF. Engineering the surface structure of MoS2 to preferentially expose active edge sites for electrocatalysis. Nature materials. 2012;11:963–969. doi: 10.1038/nmat3439. [DOI] [PubMed] [Google Scholar]
- 14.Cheng L, et al. Ultrathin WS2 nanoflakes as a high‐performance electrocatalyst for the hydrogen evolution reaction. Angewandte Chemie International Edition. 2014;53:7860–7863. doi: 10.1002/anie.201402315. [DOI] [PubMed] [Google Scholar]
- 15.Lukowski MA, et al. Enhanced hydrogen evolution catalysis from chemically exfoliated metallic MoS2 nanosheets. Journal of the American Chemical Society. 2013;135:10274–10277. doi: 10.1021/ja404523s. [DOI] [PubMed] [Google Scholar]
- 16.Li H, et al. Mechanical Exfoliation and Characterization of Single‐and Few‐Layer Nanosheets of WSe2, TaS2, and TaSe2. Small. 2013;9:1974–1981. doi: 10.1002/smll.201202919. [DOI] [PubMed] [Google Scholar]
- 17.Matte HR, Plowman B, Datta R, Rao C. Graphene analogues of layered metal selenides. Dalton Transactions. 2011;40:10322–10325. doi: 10.1039/c1dt10652j. [DOI] [PubMed] [Google Scholar]
- 18.Wang QH, Kalantar-Zadeh K, Kis A, Coleman JN, Strano MS. Electronics and optoelectronics of two-dimensional transition metal dichalcogenides. Nature nanotechnology. 2012;7:699–712. doi: 10.1038/nnano.2012.193. [DOI] [PubMed] [Google Scholar]
- 19.Cao L, et al. Direct Laser‐Patterned Micro‐Supercapacitors from Paintable MoS2 Films. Small. 2013;9:2905–2910. doi: 10.1002/smll.201203164. [DOI] [PubMed] [Google Scholar]
- 20.Chen D, et al. In situ nitrogenated graphene–few-layer WS2 composites for fast and reversible Li+ storage. Nanoscale. 2013;5:7890–7896. doi: 10.1039/c3nr02920d. [DOI] [PubMed] [Google Scholar]
- 21.Yin Z, et al. Single-layer MoS2 phototransistors. ACS nano. 2011;6:74–80. doi: 10.1021/nn2024557. [DOI] [PubMed] [Google Scholar]
- 22.Li Y, Li Y-L, Araujo CM, Luo W, Ahuja R. Single-layer MoS2 as an efficient photocatalyst. Catalysis Science & Technology. 2013;3:2214–2220. doi: 10.1039/c3cy00207a. [DOI] [Google Scholar]
- 23.Li Y, et al. MoS2 nanoparticles grown on graphene: an advanced catalyst for the hydrogen evolution reaction. Journal of the American Chemical Society. 2011;133:7296–7299. doi: 10.1021/ja201269b. [DOI] [PubMed] [Google Scholar]
- 24.Merki D, Fierro S, Vrubel H, Hu X. Amorphous molybdenum sulfide films as catalysts for electrochemical hydrogen production in water. Chemical Science. 2011;2:1262–1267. doi: 10.1039/C1SC00117E. [DOI] [Google Scholar]
- 25.Chang H, Wu H. Graphene-based nanocomposites: preparation, functionalization, and energy and environmental applications. Energy & Environmental Science. 2013;6:3483–3507. doi: 10.1039/c3ee42518e. [DOI] [Google Scholar]
- 26.Zhang H, et al. Large‐Scale Production of Nanographene Sheets with a Controlled Mesoporous Architecture as High‐Performance Electrochemical Electrode Materials. Chem Sus Chem. 2013;6:1084–1090. doi: 10.1002/cssc.201200904. [DOI] [PubMed] [Google Scholar]
- 27.Liang YT, Vijayan BK, Gray KA, Hersam MC. Minimizing graphene defects enhances titania nanocomposite-based photocatalytic reduction of CO2 for improved solar fuel production. Nano letters. 2011;11:2865–2870. doi: 10.1021/nl2012906. [DOI] [PubMed] [Google Scholar]
- 28.Liu Z, et al. Assembled 3D electrocatalysts for efficient hydrogen evolution: WSe2 layers anchored on graphene sheets. Inorganic Chemistry Frontiers. 2016;3:313–319. doi: 10.1039/C5QI00216H. [DOI] [Google Scholar]
- 29.Guo J, Shi Y, Bai X, Wang X, Ma T. Atomically thin MoSe2/graphene and WSe2/graphene nanosheets for the highly efficient oxygen reduction reaction. Journal of Materials Chemistry A. 2015;3:24397–24404. doi: 10.1039/C5TA06909B. [DOI] [Google Scholar]
- 30.Chakravarty D, Late DJ. Microwave and hydrothermal syntheses of WSe2 micro/nanorods and their application in supercapacitors. RSC Advances. 2015;5:21700–21709. doi: 10.1039/C4RA12599A. [DOI] [Google Scholar]
- 31.Bourlinos AB, et al. Graphite oxide: chemical reduction to graphite and surface modification with primary aliphatic amines and amino acids. Langmuir. 2003;19:6050–6055. doi: 10.1021/la026525h. [DOI] [Google Scholar]
- 32.Kovtyukhova NI, et al. Layer-by-layer assembly of ultrathin composite films from micron-sized graphite oxide sheets and polycations. Chemistry of Materials. 1999;11:771–778. doi: 10.1021/cm981085u. [DOI] [Google Scholar]
- 33.Ai W, et al. Nitrogen and sulfur codoped graphene: multifunctional electrode materials for high‐performance Li‐ion batteries and oxygen reduction reaction. Advanced Materials. 2014;26:6186–6192. doi: 10.1002/adma.201401427. [DOI] [PubMed] [Google Scholar]
- 34.Shi Y, et al. van der Waals epitaxy of MoS2 layers using graphene as growth templates. Nano letters. 2012;12:2784–2791. doi: 10.1021/nl204562j. [DOI] [PubMed] [Google Scholar]
- 35.Wang H, Robinson JT, Diankov G, Dai H. Nanocrystal growth on graphene with various degrees of oxidation. Journal of the American Chemical Society. 2010;132:3270–3271. doi: 10.1021/ja100329d. [DOI] [PubMed] [Google Scholar]
- 36.Wang H, et al. Mn3O4− graphene hybrid as a high-capacity anode material for lithium ion batteries. Journal of the American Chemical Society. 2010;132:13978–13980. doi: 10.1021/ja105296a. [DOI] [PubMed] [Google Scholar]
- 37.Muscuso L, Cravanzola S, Cesano F, Scarano D, Zecchina A. Optical, Vibrational, and structural properties of MoS2 nanoparticles obtained by exfoliation and fragmentation via ultrasound cavitation in isopropyl alcohol. The Journal of Physical Chemistry C. 2015;119:3791–3801. doi: 10.1021/jp511973k. [DOI] [Google Scholar]
- 38.Yu JH, et al. Vertical heterostructure of two-dimensional MoS2 and WSe2 with vertically aligned layers. Nano letters. 2015;15:1031–1035. doi: 10.1021/nl503897h. [DOI] [PubMed] [Google Scholar]
- 39.Wang R-C, Chen Y-C, Chen S-J, Chang Y-M. Unusual functionalization of reduced graphene oxide for excellent chemical surface-enhanced Raman scattering by coupling with ZnO. Carbon. 2014;70:215–223. doi: 10.1016/j.carbon.2013.12.110. [DOI] [Google Scholar]
- 40.Dresselhaus MS, Jorio A, Hofmann M, Dresselhaus G, Saito R. Perspectives on carbon nanotubes and graphene Raman spectroscopy. Nano letters. 2010;10:751–758. doi: 10.1021/nl904286r. [DOI] [PubMed] [Google Scholar]
- 41.Huang T, et al. The effects of low power density CO2 laser irradiation on graphene properties. Applied Surface Science. 2013;273:502–506. doi: 10.1016/j.apsusc.2013.02.069. [DOI] [Google Scholar]
- 42.Wang YY, et al. Raman studies of monolayer graphene: the substrate effect. The Journal of Physical Chemistry C. 2008;112:10637–10640. doi: 10.1021/jp8008404. [DOI] [Google Scholar]
- 43.Ullah K, Lei Z, Ye S, Ali A, Oh W-C. Microwave synthesis of a CoSe2/graphene–TiO2 heterostructure for improved hydrogen evolution from aqueous solutions in the presence of sacrificial agents. RSC Advances. 2015;5:18841–18849. doi: 10.1039/C5RA00065C. [DOI] [Google Scholar]
- 44.Katrib A, Hemming F, Wehrer P, Hilaire L, Maire G. The multi-surface structure and catalytic properties of partially reduced WO3, WO2 and WC + O2 or W + O2 as characterized by XPS. Journal of electron spectroscopy and related phenomena. 1995;76:195–200. doi: 10.1016/0368-2048(95)02451-4. [DOI] [Google Scholar]
- 45.Wang H, et al. MoSe2 and WSe2 nanofilms with vertically aligned molecular layers on curved and rough surfaces. Nano letters. 2013;13:3426–3433. doi: 10.1021/nl401944f. [DOI] [PubMed] [Google Scholar]
- 46.Abdallah WeA, Nelson A. Characterization of MoSe2 (0001) and ion-sputtered MoSe2 by XPS. Journal of materials science. 2005;40:2679–2681. doi: 10.1007/s10853-005-2104-7. [DOI] [Google Scholar]
- 47.Boscher ND, Carmalt CJ, Parkin IP. Atmospheric pressure chemical vapor deposition of WSe2 thin films on glass—highly hydrophobic sticky surfaces. Journal of Materials Chemistry. 2006;16:122–127. doi: 10.1039/B514440J. [DOI] [Google Scholar]
- 48.Szabó T, et al. Evolution of surface functional groups in a series of progressively oxidized graphite oxides. Chemistry of materials. 2006;18:2740–2749. doi: 10.1021/cm060258+. [DOI] [Google Scholar]
- 49.Jeong H-K, et al. X-ray absorption spectroscopy of graphite oxide. EPL (Europhysics Letters) 2008;82:67004. doi: 10.1209/0295-5075/82/67004. [DOI] [Google Scholar]
- 50.Dreyer DR, Park S, Bielawski CW, Ruoff RS. The chemistry of graphene oxide. Chemical Society Reviews. 2010;39:228–240. doi: 10.1039/B917103G. [DOI] [PubMed] [Google Scholar]
- 51.Zhang L-f, Zhang C-y. Multifunctional Co 0.85 Se/graphene hybrid nanosheets: controlled synthesis and enhanced performances for the oxygen reduction reaction and decomposition of hydrazine hydrate. Nanoscale. 2014;6:1782–1789. doi: 10.1039/C3NR05509D. [DOI] [PubMed] [Google Scholar]
- 52.Wan D, et al. Low-temperature aluminum reduction of graphene oxide, electrical properties, surface wettability, and energy storage applications. ACS nano. 2012;6:9068–9078. doi: 10.1021/nn303228r. [DOI] [PubMed] [Google Scholar]
- 53.Zang Y, Lei J, Hao Q, Ju H. “Signal-On” Photoelectrochemical Sensing Strategy Based on Target-Dependent Aptamer Conformational Conversion for Selective Detection of Lead (II) Ion. ACS applied materials & interfaces. 2014;6(18):15991–15997. doi: 10.1021/am503804g. [DOI] [PubMed] [Google Scholar]
- 54.Bonaccorso F, Sun Z, Hasan T, Ferrari A. Graphene photonics and optoelectronics. Nature photonics. 2010;4(9):611–622. doi: 10.1038/nphoton.2010.186. [DOI] [Google Scholar]
- 55.Zeng, P., Zhang, Q., Peng, T. & Zhang, X. One-pot synthesis of reduced graphene oxide-Cadmium sulfide nanocomposite and its photocatalytic hydrogen production. Physical Chemistry Chemical Physics13, 21496–21502 (2011). [DOI] [PubMed]
- 56.Ali A, Oh W-C. Catalytic reduction of CO2 to alcohol with Cu2Se-combined graphene binary nanocomposites. Fullerenes, Nanotubes and Carbon Nanostructures. 2016;24:555–563. doi: 10.1080/1536383X.2016.1205036. [DOI] [Google Scholar]
- 57.Oh W-c, Zhang F-j. Preparation and characterization of graphene oxide reduced from a mild chemical method. Asian Journal of Chemistry. 2011;23:875. [Google Scholar]
- 58.Chen M-L, Park C-Y, Choi J-G, Oh W-C. Synthesis and characterization of metal (Pt, Pd and Fe)-graphene composites. Journal of the Korean Ceramic Society. 2011;48:147–151. doi: 10.4191/KCERS.2011.48.2.147. [DOI] [Google Scholar]
- 59.Zhai Q, et al. Photocatalytic conversion of carbon dioxide with water into methane: platinum and copper (I) oxide co‐catalysts with a core–shell structure. Angewandte Chemie. 2013;125:5888–5891. doi: 10.1002/ange.201301473. [DOI] [PubMed] [Google Scholar]