

Abstract
Abnormal mitochondrial function has been found in patients with frontotemporal dementia (FTD) and amyotrophic lateral sclerosis (ALS). Mutations in the p62 gene (also known as SQSTM1) which encodes the p62 protein have been reported in both disorders supporting the idea of an ALS/FTD continuum. In this work the role of p62 in energy metabolism was studied in fibroblasts from FTD patients carrying two independent pathogenic mutations in the p62 gene, and in a p62-knock-down (p62 KD) human dopaminergic neuroblastoma cell line (SH-SY5Y). We found that p62 deficiency is associated with inhibited complex I mitochondrial respiration due to lack of NADH for the electron transport chain. This deficiency was also associated with increased levels of NADPH reflecting a higher activation of pentose phosphate pathway as this is accompanied with higher cytosolic reduced glutathione (GSH) levels. Complex I inhibition resulted in lower mitochondrial membrane potential and higher cytosolic ROS production. Pharmacological activation of transcription factor Nrf2 increased mitochondrial NADH levels and restored mitochondrial membrane potential in p62-deficient cells. Our results suggest that the phenotype is caused by a loss-of-function effect, because similar alterations were found both in the mutant fibroblasts and the p62 KD model. These findings highlight the implication of energy metabolism in pathophysiological events associated with p62 deficiency.
Introduction
p62, also known as sequestosome 1, is a scaffold or an adaptor protein involved in multiple cellular activities and is encoded by the p62 gene (also known as SQSTM1). Mutations in the p62 gene have been found to cause both amyotrophic lateral sclerosis (ALS) and frontotemporal dementia (FTD). FTD and ALS are sometimes associated in patients or within families showing ALS and FTD as a pathological continuum (ALS/FTD) as they share common pathological features1. Supporting this idea, mutations in the same disease-causing genes in both disorders have been reported. These include VCP2, p623, OPTN4, UBQLN25 and especially the hexanucleotide repeat expansion in C9orf726. It is worth mentioning that mutations in OPTN, VCP and p62 also cause Paget disease of the bone (PDB)1. p62 has been related to neurodegenerative phenotypes and it has been linked to the ubiquitin-proteasome system and autophagy, main protein degradation mechanisms in cells. Protein aggregates containing p62 have been also found in many disorders, including ALS and FTD7,8, in some cases colocalizing with the transactive response DNA-binding protein 43 (TDP-43)9 and also in ubiquitinated inclusions along with FUS protein and TDP4310.
The link between p62 and neurodegeneration has been further investigated using animal and cell models. Most of them have focused on autophagy, the ubiquitin-proteasome degradation pathway and particularly, the mitochondrial quality control process known as mitophagy11–15. Studies with cell models showed the implication of p62 in mitophagy which is disrupted in some forms of Parkinson’s disease11,15. The silencing of the p62 orthologue in drosophila ref(2)P, resulted in mitochondrial dysfunction, and mitochondrial DNA accumulation and this was linked to the observed locomotor deficits in the flies12,13. In 2014, Seibenhener and colleagues further showed the link between p62 and mitochondrial protein turnover using p62 silenced mouse embryonic fibroblasts (MEFs)14. Mitochondria are essential organelles especially for neurons as they are the main source of ATP due to limited glycolysis. The p62 knockout mouse model as well as p62 silenced MEFs showed impaired mitochondrial function resulting in reduced ATP production14,16,17.
Accumulating evidence from recent studies suggests that mitochondrial dysfunction plays a significant role in both the FTD and ALS etiopathogenesis18–21. This has been demonstrated using different animal and cell models. In particular, we recently demonstrated that mutations in VCP cause mitochondrial uncoupling leading to decreased mitochondrial membrane potential and a significant reduction of cellular ATP production highlighting the pathophysiological events that may occur in FTD and ALS22. In the present study we aimed to analyze mitochondrial function and pathophysiology using fibroblasts from FTD diagnosed patients carrying two independent p62 mutations and the p62-knock-down (p62 KD) human dopaminergic neuroblastoma cell line (SH-SY5Y) model. We found that p62 deficiency induces inhibition of mitochondrial respiration due to a lack of substrate delivery. This inhibition results in higher cytosolic ROS production inducing the cells to increase the pentose phosphate pathway activity (PPP) in order to enhance the reduced glutathione (GSH) levels. We also demonstrated that the p62 mutations cause a loss-of-function effect as the p62 KD shows the same phenotype as the p62 mutations from patients.
Results
p62 deficiency is associated with decreased mitochondrial membrane potential (ΔΨm)
Mitochondrial health and function are reflected in the mitochondrial membrane potential (ΔΨm). The implication of p62 in the mitochondrial function was assessed by transient silencing of the p62 gene in the SH-SY5Y human neuroblastoma cell line using siRNA (p62 KD) (Fig. 1A). The ΔΨm was then measured using tetramethyl-rhodamine methylester (TMRM) as a fluorescent indicator of ΔΨm in the p62 KD cells and in mutant fibroblasts from patients carrying independent p62 mutations (patient 1 = A381V; patient 2 = K238del; for donor’s details see Supplementary Fig. 1 and Table 1). Interestingly, the p62 protein levels in the mutant fibroblasts were reduced in both carriers but more remarkably in patient 1 carrying the A381V mutation (Fig. 1B). A significant decrease in ΔΨm was observed in p62 KD SH-SY5Y cells reducing the TMRM signal to 81 ± 4% (n = 4) compared to either untransfected (100 ± 1%, n = 4) or cells transfected with scrambled (SCR) siRNA control (102 ± 6%, n = 4) (Fig. 1C). Equivalent effects on the ΔΨm were observed in the mutant fibroblasts when compared to age-matched controls (Fig. 1D). The TMRM fluorescence signal was significantly reduced in fibroblasts with the pathogenic p62 mutations, indicating that basal ΔΨm is also reduced in these cells (control 1 = 100 ± 1%, n > 10; control 2 = 97 ± 2%, n = 5; patient 1 = 80 ± 3%, n > 10; patient 2 = 79 ± 3%, n > 10) compared to control fibroblasts (Fig. 1D).
Figure 1.
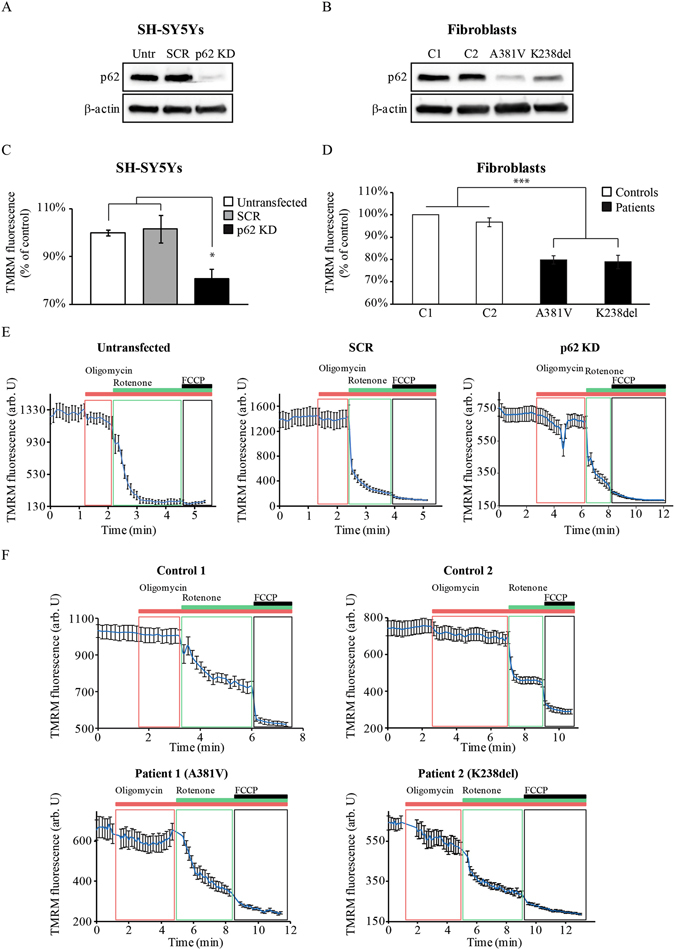
p62 deficiency induces mitochondrial depolarisation. (A,B) Immunoblotting showing the p62 protein levels corresponding to whole cell lysates from untransfected (Untr) and transiently transfected (either with SCR or p62 siRNA) SH-SY5Y cells (A) or fibroblasts from patients carrying p62 mutations and aged-matched controls C1 and C2 (B). In both A and B, β-actin was used as loading control. (C,D) Mitochondrial membrane potential (ΔΨm) was estimated by live cell imaging in untransfected, scramble siRNA KD (SCR) and p62 KD SH-SY5Y cells (C) and in fibroblasts from patients carrying A381V and K238del pathogenic mutations in p62 compared to fibroblasts from two healthy donors (C1, C2) (D) using TMRM in a redistribution mode (40 nM). Data were normalised to control SCR cells (C) and control fibroblasts (D) and are represented as mean ± SEM from at least three independent experiments. (E,F) Representative TMRM traces from untransfected, SCR and p62 KD SH-SY5Y cells (E) and fibroblasts from control donors (F, upper panels) and fibroblasts from patients carrying the p62 pathogenic mutations mentioned above (F, bottom panels). The charts show responses to oligomycin (2 μg/mL), rotenone (5 μM) and FCCP (1 μM). In all cases *indicates p < 0.05 and ***indicates p < 0.001 compared with the values of control cells.
Table 1.
Donors’ information.
| Sex | Current Age | Age of onset | Family history | Clinical features | Clinical diagnosis | p62 mutation | |
|---|---|---|---|---|---|---|---|
| Control 1 | M | 81 | — | — | unaffected | — | — |
| Control 2 | F | 52 | — | — | unaffected | — | — |
| Patient 1 | F | 54 | 48 | yes | Behavioural disturbances (Le Ber et al. 2013) | bvFTD | A381V |
| Patient 2 | F | 82 | 75 | yes | Speech apraxia (Boutoleau-Bretonniere et al. 2015) | nvfFTLD | K238del |
M: male; F: female; nfvFTLD: non-fluent variant of FTLD; bvFTD: behavioural variant of FTD.
Both, p62 KD SH-SY5Y cells and p62 mutant fibroblasts showed a depolarization in response to the F0-F1-ATP synthase (ATPase or complex V) inhibitor oligomycin (2 µg/ml), suggesting a reverse mode function for the ATPase (Fig. 1E and F). Subsequent inhibition of complex I by rotenone (5 µM) caused a rapid loss of potential in all cells (Fig. 1E and F) and a complete depolarisation was assessed by addition of the mitochondrial uncoupler carbonyl cyanide-4-(trifluoromethoxy) phenylhydrazone (FCCP) (1 μM) (Fig. 1E and F). These data suggest that ΔΨm in p62 KD cells is partially maintained by ATP hydrolysis by the ATPase (Fig. 1E and F).
Mitochondrial respiration is inhibited in p62 deficient cells and this is associated with limited substrates for the ETC
The activity of the mitochondrial electron transport chain (ETC) and the rate of substrate supply can be estimated by measurement of mitochondrial NADH and FAD autofluorescence as previously shown22,23 (Figs 2 and 3). Figure 2A shows representative average traces for NADH autofluorescence in untransfected, SCR-transfected and transient p62 KD SH-SY5Ys cells (Fig. 2A). Then, the NADH redox index was estimated as represented in Fig. 2B. The obtained NADH redox index for the transient p62 KD SH-SY5Y cells was significantly higher (63 ± 4%, n = 5) compared to either untransfected (45 ± 4%, n = 5) or SCR-transfected (43 ± 6%, n = 5) cells (Fig. 2C). Equivalent results were obtained in p62 mutant fibroblasts when compared to healthy controls (NADH redox index in patient 1 = 59 ± 5%, n = 9; patient 2 = 50 ± 4%, n = 6; control 1 = 22 ± 2%, n = 8; control 2 = 26 ± 3%, n = 8) (Fig. 2D). The analysis of the FAD autofluorescence (Fig. 3A) was used to generate the FAD redox index (Fig. 3B and C) which was higher in the p62 KD SH-SY5Y cells (91 ± 4%, n = 4) compared to untransfected (53 ± 6%; n = 4) and SCR (63 ± 13%; n = 4) cells (Fig. 3C). Increased NADH and FAD redox indexes in p62 deficient cells reflects inhibition of complex I-driven respiration and suggest more activated complex II dependent respiration as a compensatory mechanism. We were unable to measure the FAD redox state in fibroblasts from both patients and controls due to the very low level of FAD autofluorescence in these cells. Mitochondrial NADH pool obtained as represented in Fig. 2B was found to be reduced in the p62 KD cells (68 ± 5%, n = 5) compared to untransfected (94 ± 5%, n = 5) and SCR (97 ± 2%, n = 5) cells (Fig. 2E) and in the p62 mutant fibroblasts when compared to the control fibroblasts (patient 1: 61 ± 4%, n = 9; patient 2: 68 ± 5%, n = 6; control 1: 98 ± 2%, n = 11; control 2: 93 ± 3%, n = 11) (Fig. 2F) indicating a lack of substrates. Along with this observation, lower FAD pool levels were also found in the p62 KD cells (59 ± 9%, n = 4) compared to untransfected (91 ± 9%, n = 4) and SCR (95 ± 7%, n = 4) confirming an inhibition in complex I and reduced substrate availability (Fig. 3D). Further analysis of complex I activity using an activity microplate assay confirmed the inhibition of complex I in the p62 mutant fibroblasts compared to controls (patient 1 = 74 ± 1%, n = 3; patient 2 = 55 ± 8%, n = 3; control 1 = 99 ± 7%, n = 3; control 2 = 101 ± 4%, n = 3) (Fig. S3). It is possible that the p62 deficient cells try to compensate the inhibition of complex I-driven respiration through activation of complex II as reflected by the lower FAD pool levels in the p62 deficient cells (Fig. 3D).
Figure 2.
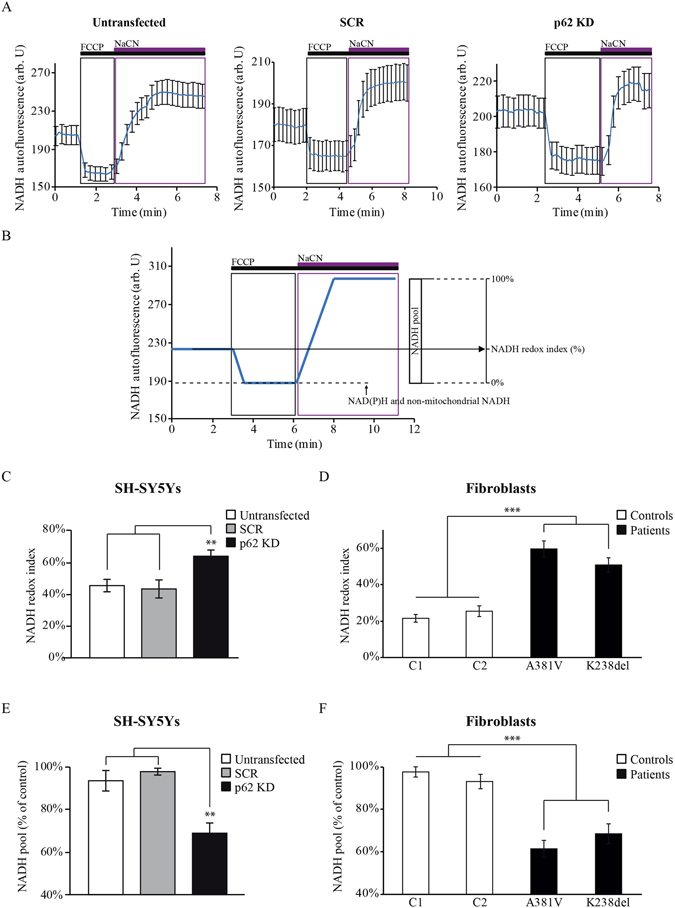
p62 deficiency disrupts the NADH homeostasis. (A) Time-course representative traces of NADH autofluorescence from untransfected, SCR and p62 KD in SH-SY5Y cells. The uncoupler FCCP (1 μM) maximises mitochondrial respiration and therefore minimises mitochondrial NADH (0%). NaCN (1 mM) was then added to block mitochondrial respiration and thereby maximise mitochondrial NADH (100%). The traces represent the mean of at least 20 cells on a single coverslip ±SEM. (B) Graphical description of the NADH homeostasis analysis by monitoring the NADH autofluorescence in cells. NADH redox indexes were obtained by calculating the initial NADH autofluorescence when the minimum NADH autofluorescence is normalised to 0% and the maximum to 100%. Both the NADH redox index (the initial redox level expressed as percentage of the range) and the NADH pool are described graphically. (C,D) NADH redox indexes from untransfected, SCR and p62 KD SH-SY5Y cells (C) and control and p62 deficient fibroblasts (D) representing the mean of at least 3 independent experiments ±SEM. In all cases ** indicates p < 0.01 and ***indicates p < 0.001 compared with the values in control cells. (E,F) The NADH pool was expressed as absolute values between maximal and minimal respiration in untransfected, SCR and p62 KD SH-SY5Y cells (E) and control and p62 mutant fibroblasts (F). Data represent the mean of at least 3 independent experiments ±SEM. In all cases **indicates p < 0.01 and ***indicates p < 0.001 compared with the values in control cells.
Figure 3.
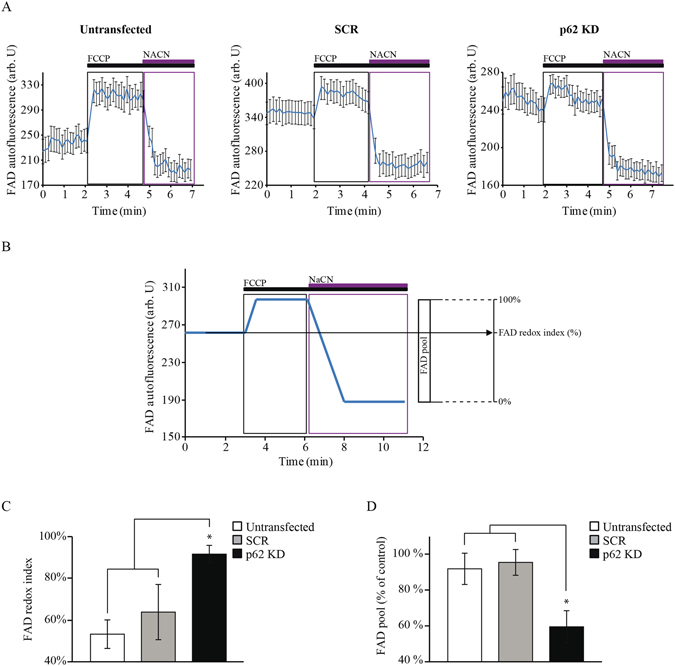
Altered FAD homeostasis is reflected in p62 deficient cells. (A) Time-course representative traces of FAD autofluorescence from untransfected, SCR and p62 KD SH-SY5Y cells. Addition of FCCP (1 μM) maximised respiration and thereby increased FAD autofluorescence to maximal levels (100%). Addition of NaCN (1 mM) then inhibited respiration and reduced the FAD autofluorescence to a minimum (0%). The traces represent the mean of at least 20 cells on a single coverslip ±SEM. (B) Graphical description of the FAD homeostasis analysis by monitoring the FAD autofluorescence using confocal microscopy in p62 deficient cells compared to controls. FAD redox indexes were obtained by calculating the initial FAD autofluorescence when the minimum FAD autofluorescence is normalised to 0% and the maximum to 100%. The FAD redox index generation (the initial redox level expressed as percentage of the range) and the FAD pool are described graphically. (C) FAD redox indexes from untransfected, SCR and p62 KD SH-SY5Y cells representing the mean of at least 3 independent experiments ±SEM. In all cases * indicates p < 0.05 compared with the values in the corresponding control cells. (D) The FAD pool was expressed as absolute values between maximal and minimal respiration in untransfected, SCR and p62 KD SH-SY5Y cells. Data represent the mean of at least 3 independent experiments ±SEM. * indicates p < 0.05 compared with the values in the corresponding control cells.
p62 deficient cells exhibit increased cytosolic ROS production
Altered mitochondrial function could be linked to an overproduction of cytosolic reactive oxygen species (ROS). Cytosolic ROS production was analyzed in the p62 deficient cells using dihydroethidium (Het). Figure 4 shows representative Het fluorescence rates in SH-SY5Y cells (Fig. 4A) and in fibroblasts (Fig. 4B). The p62 KD cells showed higher Het rates (122 ± 6%, n = 5) compared to the untransfected (100 ± 0%, n = 5) or SCR cells (101 ± 7%, n = 5) (Fig. 4C). Equivalent results were obtained in the p62 mutant fibroblasts (patient 1 = 135 ± 7%, n = 4; patient 2 = 133 ± 6%, n = 4) compared to controls (control 1 = 103 ± 5%, n = 4; control 2 = 90 ± 8%, n = 4) (Fig. 4D). Together, all the p62 deficient cells showed cytosolic ROS overproduction in agreement with the inhibited respiration found in these cells.
Figure 4.
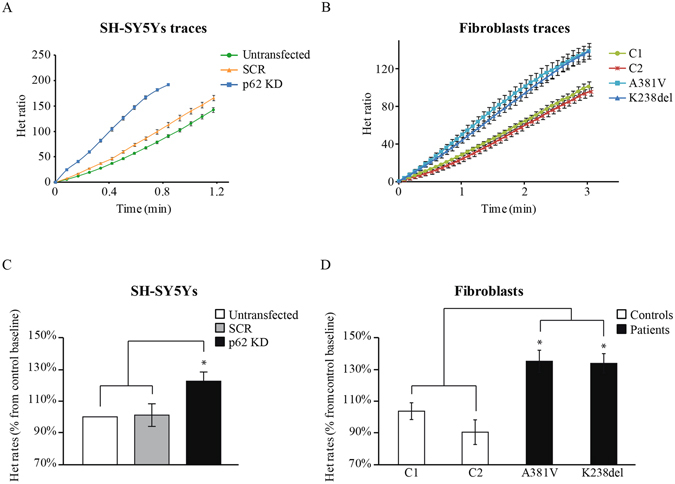
p62 deficiency results in increased oxidative stress. (A,B) Cellular oxidative stress was evaluated analysing the oxidation rates of the superoxide indicator dihydroethidium (Het) which initially exhibits cytosolic blue fluorescence and when oxidised, it shows bright red fluorescence in the nucleus. These changes can be detected by live-cell imaging. Time-course representative traces showing the Het oxidation slopes in untransfected, SCR and p62 KD SH-SY5Y cells (A) and fibroblasts from control donors and patients carrying the p62 pathogenic mutations mentioned above (B). In all cases the traces represent the mean of at least 20 cells on a single coverslip ±SEM. (C,D) Het oxidation rates from untransfected, SCR and p62 KD SH-SY5Y cells (C) and control and p62 mutant fibroblasts (D). Rates were calculated as the change in fluorescence over a period of time and are expressed as percentage of a basic rate. Data represent the mean of at least 3 independent experiments ±SEM. In all cases * indicates p < 0.05 compared with the values in control cells.
Nrf2 activators restored the phenotype in mutant p62 cells
Previous work from our group showed that the nuclear factor erythroid-derived 2 (NF-E2)-related factor 2 (Nrf2) directly regulates cellular energy metabolism by modulating the availability of substrates for mitochondrial respiration24,25. It was reported that p62 and Nrf2 form a positive feed-forward regulatory loop, whereby p62 activates Nrf2 by competing for binding with the negative regulator Kelch-like ECH associated protein 1 (Keap1), and Nrf2 activates the transcription of p6226. These observations, together with the fact that both models of p62 deficiency show similar mitochondrial alterations to the ones we had previously shown in Nrf2-deficient cells24 prompted us to evaluate the role of Nrf2 activation on mitochondrial function in p62-deficient cells. To this end we used three different Nrf2 activators, the synthetic acetylenic tricyclic bis(cyanoenone) (TBE-31), the naturally occurring isothiocyanate sulforaphane (SFN) and the synthetic triterpenoid RTA-408 (RTA). Each of the three pharmacological Nrf2 activators rescued the respiration deficiencies in the fibroblasts carrying the p62 mutations (Fig. 5A and B). The NADH redox index was significantly reduced in p62 mutant fibroblasts treated with Nrf2 activators compared to the same fibroblasts without treatment (patient 1 TBE = 34 ± 5%, n = 6; patient 2 TBE = 34 ± 3%, n = 7; patient 1 SFN = 37 ± 2%, n = 5; patient 2 SFN = 35 ± 3%, n = 5; patient 1 RTA = 42 ± 10%, n = 3; patient 2 RTA = 31 ± 5%, n = 4) (Fig. 5A) and the NADH pool was restored reaching equivalent values to the control fibroblasts (Fig. 5B) (patient 1 TBE = 113 ± 10%, n = 6; patient 2 TBE = 118 ± 9%, n = 7; patient 1 SFN = 110 ± 8%, n = 5; patient 2 SFN = 103 ± 4%, n = 5; patient 1 RTA = 99 ± 7%, n = 3; patient 2 RTA = 112 ± 8%, n = 4). Consequently, the restoration of the mitochondrial NADH pool increased the ΔΨm in the p62 fibroblasts (Fig. 5C), (patient 1 TBE = 114 ± 7%, n = 7; patient 2 TBE = 95 ± 7%, n = 4; patient 1 SFN = 113 ± 5%, n = 7; patient 2 SFN = 97 ± 8%, n = 5; patient 1 RTA = 106 ± 7%, n = 3; patient 2 RTA = 102 ± 7%, n = 5). Taken together, these results suggest that Nrf2 activation restores cellular metabolism in the p62-deficient cells by increasing the availability of substrates for mitochondrial respiration.
Figure 5.
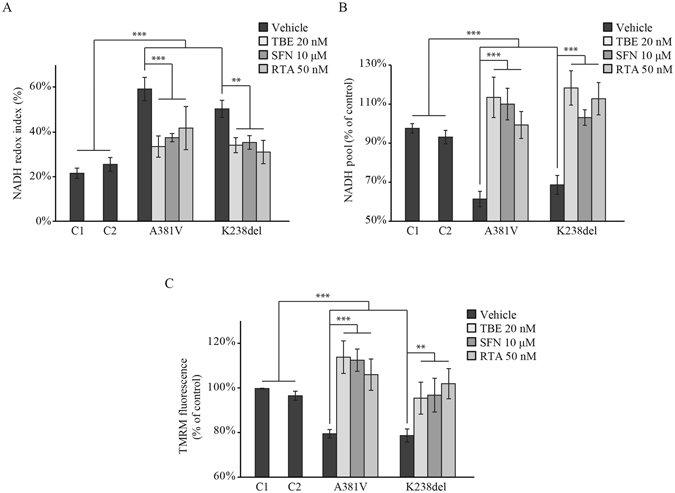
Nrf2 activators restore the p62 deficient phenotype. (A) NADH redox index was evaluated after incubation with the Nrf2 activators TBE-31(TBE, 20 nM), sulphoraphane (SFN, 10 μM) and the synthetic triterpenoid RTA-408 (RTA, 50 nM). Cells were plated on 25 mm coverslips in 6 well plates. When they reached 70% confluency, cells were treated 24 hours with TBE, SFN and RTA separately. NADH redox index was calculated as the basal level relative to maximal respiration after FCCP (1 mM) (0%) and inhibited respiration after NaCN (1 mM) (100%) (see Fig. 2B) in fibroblasts from patients carrying the A381V and K238del pathogenic mutations in p62 compared to two control fibroblasts (C1, C2) in presence of the Nrf2 activators. All data represents the mean of at least 3 independent experiments ±SEM. In all cases ** indicates p < 0.01 and *** indicates p < 0.001 compared with the values in control cells. (B) NADH pool expressed as absolute values between maximal and minimal respiration (see Fig. 2B) in control and patient fibroblasts in presence of the Nrf2 activators. Experimental conditions were the same as in (A). All data represents the mean of at least 3 independent experiments ±SEM. In all cases *** indicates p < 0.001 compared with the values in control cells. (C) The ΔΨm was analyzed in fibroblasts from patients and controls upon activation of Nrf2. Experimental conditions were the same as in (A). All data represents the mean of at least 3 independent experiments ±SEM. In all cases ** indicates p < 0.01 and *** indicates p < 0.001 compared with the values in control cells.
p62 deficiency is associated with higher pentose phosphate pathway (PPP) activity
Upon oxidative stress, cells may react by increasing the levels of reduced glutathione (GSH), which is one of the major endogenous antioxidants in the cell. During an oxidative insult, neurons divert part of their glucose pool towards the PPP, thereby increasing the production of NAD(P)H, a necessary cofactor in the regeneration of GSH. PPP activity can be estimated by analysing the basal levels of NAD(P)H autofluorescence after addition of 1 μM FCCP, which maximises respiration (Fig. 2A). This basal fluorescence reflects the non-mitochondrial NADH and the NADPH levels. The NAD(P)H levels in the p62 KD SH-SY5Y cells (125 ± 6%, n = 4) were significantly increased compared to untransfected (106 ± 3%, n = 4) and SCR-transfected (104 ± 4%, n = 4) SH-SY5Y cells indicating an increased activity in the PPP due to p62 deficiency (Fig. 6A). Similar results were obtained in the p62 mutant fibroblasts when compared to controls (patient 1 = 127 ± 3%, n > 10; patient 2 = 122 ± 3%, n > 10; control 1 = 99 ± 1%, n > 10; control 2 = 102 ± 1%, n > 10) (Fig. 6B). We found no changes between control and patient fibroblasts in the glucose 6 phosphate dehydrogenase protein levels, a rate limiting enzyme in the PPP, indicating the PPP increased activity observed was not related to higher expression levels of this enzyme (Fig. S2). Finally, using the monochlorobimane (MCB) fluorescent probe to determine GSH levels (Fig. 6C) we found increased cytosolic (Fig. 6D) but not mitochondrial (Fig. 6E) GSH levels in the fibroblasts carrying the p62 mutations (cytosolic: control 1 = 99 ± 1%, n = 7; control 2 = 99 ± 1%, n = 9; patient 1 = 110 ± 2%, n = 5; patient 2 = 114 ± 7%, n = 5; mitochondrial: control 1 = 98 ± 1%, n = 7; control 2 = 102 ± 1%, n = 9; patient 1 = 105 ± 2%, n = 5; patient 2 = 104 ± 11%, n = 5). The increased GSH levels in patients fibroblasts were confirmed using a quantitative fluorometric assay (control 1 = 102 ± 2%, n = 3; control 2 = 98 ± 2%, n = 3; patient 1 = 153 ± 14%, n = 3; patient 2 = 156 ± 21%, n = 3) (Fig. S2). These data, along with the higher NADPH levels, revealed an increased PPP activity in the p62-deficient cells compared to the healthy controls, possibly due to a switch from glycolysis to PPP.
Figure 6.
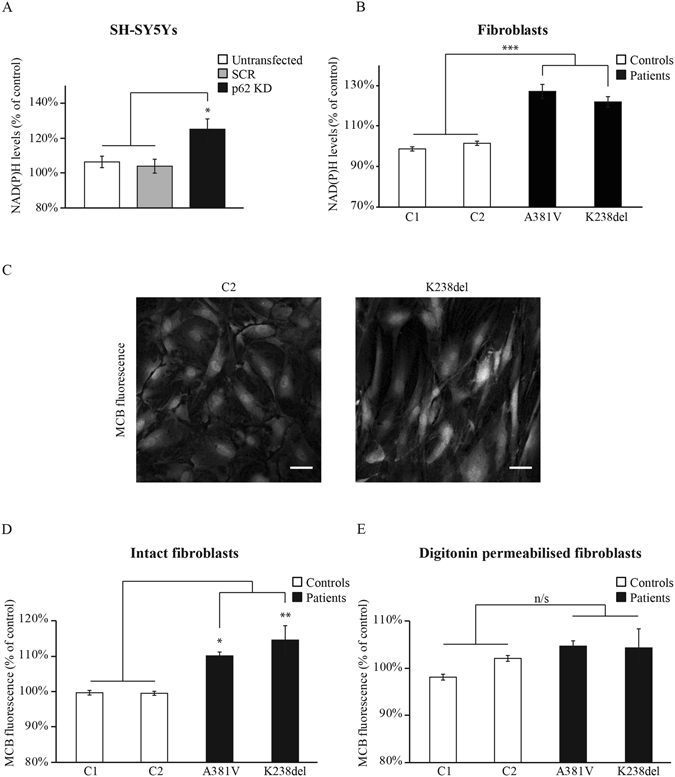
Pentose phosphate pathway activity is increased upon p62 deficiency. (A,B) NAD(P)H levels were obtained through the analysis of NADH autofluorescence. The NAD(P)H values were calculated by subtracting the background from the minimum fluorescence after addition of FCCP (1 μM) which oxidises all the mitochondrial NADH minimising the NADH fluorescence (see Fig. 2B). NAD(P)H levels from untransfected, SCR and p62 KD SH-SY5Y cells (A) and control and p62-deficient fibroblasts (B) representing the mean of at least 3 independent experiments ±SEM. * indicates p < 0.05 and *** indicates p < 0.001 compared with the values in control cells. (C–E) GSH levels were analyzed by measuring the monochlorobimane (MCB) fluorescence. Representative images showing the cell fluorescence after MCB incubation (50 μM) in fibroblasts from control 2 (C2) and patient 2 carrying the K238del mutation (C). Scale bar represents 44 μm. The GSH levels were obtained after evaluation of the MCB fluorescence in fibroblasts from all p62 mutant carriers and the obtained values were compared to those from the control fibroblasts before (D) and after digitonin treatment (40 nM) (E). All data represents the mean of at least 3 independent experiments ±SEM. In all cases * indicates p < 0.05 and ** indicates p < 0.01 compared with the values in control cells.
Discusion
Mitochondria are the main source of energy in neurons due to their limited glycolytic capacity. Harnessing the proton gradient generated in the respiration through complexes I to IV, neurons rely on the oxidative phosphorylation process to generate ATP through the ATP synthase in the mitochondria. Mutations in FTD and ALS have been found to induce impairments in crucial mitochondrial metabolic processes causing a fatal fate for cells, organs and patients27. Previous works presented p62 protein as one of the main regulators of mitochondrial function14,16,17. In this study, the mitochondrial bioenergetics in p62 deficient cells and fibroblasts from FTD patients carrying independent p62 mutations was investigated. Reduced p62 levels are associated with reduced ΔΨm in both p62 SH-SY5Y deficient cells and mutant fibroblasts. These cells also exhibit inhibited mitochondrial respiration through complex I due to the lack of substrates for the ETC complexes and higher superoxide production. The boost in the cytosolic ROS levels leads to activation of the pentose phosphate pathway, thereby increasing the GSH levels in order to counteract the oxidative stress environment.
Mitochondrial dysfunction in ALS has been thoroughly demonstrated28–30 but not much is known about this topic in FTD. Recent studies found mitochondrial alterations in FTD cases together with ALS supporting the idea of the FTD/ALS continuum18–20,31–34. Other works showing mitochondrial alterations were carried out in different cohorts of patients with variations in the CHCH10 gene, a common cause of both FTD and ALS31,35. A number of studies have demonstrated that mitochondrial activity is compromised in FTD and ALS using animal models and cells from patients22,36. In this study, a reduction in the ΔΨm is observed in the p62 deficient cell models. The ΔΨm reflects mitochondrial health and function and mitochondrial viability and it is defined as the proton gradient generated in the intermembrane space during respiration. This proton gradient is harnessed by the ATPase to synthesise ATP through the oxidative phosphorylation (OXPHOS) process. Here it is also shown that ATP hydrolysis by the ATPase maintains the ΔΨm in the p62 deficient cells since these cells exhibited depolarised mitochondria when oligomycin, the inhibitor of the F1-F0 ATPase, was added. Under normal conditions the process of respiration maintains the ΔΨm but mitochondria can also hydrolyze the ATP forcing the ATPase to work in a reverse mode in order to maintain the ΔΨm37. This has been thoroughly described in other neurodegenerative models in which an inhibition of respiration hampers the normal ΔΨm maintenance forcing the reversal ATPase38–40.
In combination with the reduced ΔΨm an inhibition in the respiration process was detected in p62 deficient cells. This was reflected by both the elevated NADH redox index and the decreased FAD redox index, pointing to the inhibition of complex I. This inhibition is a consequence of lack of substrates as demonstrated by the lower NADH pool observed in the p62 deficient cells as well as the lower FAD pool. The inhibition of the respiration through the complex I induces an increase in ROS production in the cells. Damaged mitochondrial respiration including reduced complex I and II activities were previously found in mitochondria from p62 KO mice brains16. These authors also found an exacerbated oxidative stress due to inhibition of respiration. On the other hand, in 2012 Kwon and colleagues showed mitochondrial impairments in a p62 KO model reflected in reduced mitochondrial membrane potential and reduced oxygen consumption together with increased cellular oxidant levels17. Increased ROS generation has been found to be related to inhibited mitochondrial respiration in neurodegenerative disorders41–43. In AD, it has been found that an inhibition in mitochondrial respiration through complex I increased ROS generation44. Increased ROS production is also a demonstrated feature in some forms of PD. This has been related to inhibition in the complex I dependent respiration both in cells and PD animal models39,45,46.
The results presented herein show that Nrf2 activators restore the inhibition of the respiration and the NADH pool in the p62 deficient cells. Nrf2 is a transcription factor implicated in the activation of antioxidant genes, providing cytoprotection against oxidative stress and inflammation47. More recently, new roles regarding the maintenance of mitochondrial function and bioenergetics have been attributed to Nrf224,47–49. It has been shown that cells from Nrf2-deficient mice have impaired mitochondrial function. Specifically, it was demonstrated that Nrf2 is a main regulator in the substrates supply to both complex I and complex II as the rate of NADH and FADH2 production was much lower in the Nrf2 KO cells compared to controls24. Nrf2 and p62 were shown to intersect through the direct interaction between p62 and Keap126. Under normal conditions Nrf2 is ubiquitinated and degraded by the proteasome as it is bound to the E3-ubiquitin ligase adaptor protein Keap1. When Keap1 is challenged with ROS or electrophiles, Nrf2 degradation is blocked, activating the antioxidant response elements (ARE)-mediated transcription. In the noncanonical pathway of Nrf2 regulation, Keap1 is sequestered by p62 and can no longer bind Nrf2, leading to increased Nrf2 signalling with the subsequent activation of the ARE-mediated transcription. Our findings point to a disruption in the Keap1 sequestration by p62, leading to enhanced degradation of Nrf2. The consequence would be inhibition in respiration due to low Nrf2 levels, which could be restored by Nrf2 pharmacological activators.
Finally, it is shown that p62 deficiency is associated to an increased activity in the pentose phosphate pathway as demonstrated by the elevated levels of NAD(P)H and reduced glutathione. It has been demonstrated that elevated ROS levels in cells induce the activation of the PPP to generate the antioxidant GSH50. The expression levels of the rate limiting enzyme responsible for GSH biosynthesis, the glutamate-cysteine ligase, are very low in neurons. This fact makes neurons more vulnerable to oxidative stress as the GSH-dependent antioxidant system is very weak in these cells. Neurons can compensate their oxidative stress vulnerability by diverting part of the glucose pool to the PPP, which generates NAD(P)H and increases the GSH levels51. It is possible that p62 deficient cells divert part of their glucose to the PPP to increase GSH levels after an oxidative stress stimulus, as has been shown in neurons52.
In summary, our results show that p62 deficiency induces mitochondrial respiration inhibition by deficient delivery of substrates to the mitochondrial complexes, which subsequently results in elevated cytosolic oxidative stress. The rise in the oxidative stress could partially trigger glucose diversion to the PPP in order to increase the GSH levels.
Even though our results were obtained using fibroblasts from FTD patients, they have been also validated using the SH-SY5Y p62 KD model, suggesting a loss-of-function effect upon p62 deficiency. This point makes the results applicable not only to FTD patients carrying p62 mutations but also to ALS patients with mutations in p62, and therefore supports the idea of FTD/ALS continuum. The data presented here along with recent works showing functional mitochondrial impairments linked to mutations causing both FTD and ALS provides significant basis to support the hypothesis that mitochondrial dysfunction is involved in the underlying pathogenic mechanisms within the FTD/ALS spectrum. Additionally, the pharmacological activation of Nrf2 needs to be further explored as therapeutic tool for the p62-associated ALS/FTD prevention and treatment.
Methods
All methods were performed following the relevant guidelines and regulations approved by the local ethical review committee from the National Hospital for Neurology and Neurosurgery and the Institute of Neurology.
Donors
Written informed consent was obtained from the donors for publication of their individual details. The consent form is held by the authors’ institution within the patients’ clinical notes and is available for review by the Editor-in-Chief. Donors gave written consent and the project was approved by the local ethical review committee from the National Hospital for Neurology and Neurosurgery and the Institute of Neurology (London, UK). Fibroblasts from two patients carrying independent p62 mutations and two non-related healthy donors used as controls were generated from a 4-mm skin punch biopsy taken under local anesthetic following informed consent. Biopsies were dissected into ~1-mm pieces and cultured in 5-cm2 petri dishes in DMEM, 10% FBS, 1% L-Glutamine until fibroblasts were seen to grow out from the explants. When fibroblasts reached confluency, they were detached from culture dishes using TrypleE from Thermo Fisher Scientific (Waltham, MA, USA) and transferred to larger culture vessels for further expansion and cryopreservation. Age, sex, age of onset, clinical features, clinical diagnosis, and p62 mutations carried by the patients as well as healthy donors characteristics are given in Table 1. Family trees from patient 1 and patient 2 are provided in (Supplementary Fig. S1).
Cell culture
Human neuroblastoma (SH-SY5Y) cells were purchased from the European Collection of Cell Cultures (Health Protection Agency, Salisbury, UK) and maintained as previously described53. Unless otherwise stated, SH-SY5Y cells and fibroblasts were seeded at a density of 4 × 10⁴ cells/cm2, grown to 75–80% confluence and maintained at 37 °C and 5% CO2 in Dulbecco’s modified Eagle’s medium (DMEM) medium supplemented with 10% (v/v) foetal bovine serum (FBS), 2 mM L-glutamine and 1% (v/v) penicillin/streptomycin.
Immunoblotting and antibodies
Cells lysates were obtained after 2 minutes of incubation with the lysis buffer NP-40 (50 mM Tris-base pH 7.4, 150 mM NaCl, 0.5% Nonidet P-40, 1 mM EDTA, protease inhibitors cocktail) and the lysates were immediately frozen. 10 μg of denatured protein previously estimated (Pierce BCA Protein Assay Kit, Thermo Fisher, Waltham, MA, USA) from each sample were loaded in a precast 4–20% Tris-Glycine SDS-PAGE (Bio Rad Laboratories, Inc., Hercules, CA). After electrophoresis, proteins were transferred to 0.45 μm PVDF membranes (IPVH00010, Immobilon Millipore) and identified by the appropriate primary and secondary antibodies and visualised using Enhanced Chemiluminescence (ECL Clarity; BioRad) with the ImageQuant LAS4000 (GE Healthcare). Anti-human p62 rabbit monoclonal antibody (1:20000) and anti-human glucose 6 phosphate dehydrogenase (1:1000) were obtained from Abcam (Cambridge, UK). Anti-human β-Actin rabbit polyclonal antibody (1:5000) was obtained from Sigma-Aldrich (Poole, UK).The anti-rabbit secondary antibodies (1:5000) coupled to horseradish peroxidase and bovine immunoglobulins (IgG) were from Bio-Rad (Richmond, CA).
Plasmids and reagents
The non-targeting scramble siRNA, the targeted siRNA (siGenome SMARTpool) against human p62 and the Dharmafect transfection reagent were purchased from Dharmacon, Thermo Fisher Scientific (Waltham, MA, USA). The siRNA transfection was performed following the manufacturer’s instructions once the plated cells reached 60% confluence. Cells were ready for subsequent experiments after 48 h post transfection 37 °C and 5% CO2.
Nrf2 activators
Three different activators for the transcription factor Nrf2 were used: the synthetic acetylenic tricyclic bis(cyanoenone) TBE-3154, the triterpenoid RTA-408 (RTA)55, and the naturally occurring isothiocyanate sulforaphane (SFN)56. The concentration of each compound was optimized based on the potency in inducing NAD(P)H:quinone oxidoreductase 1 (NQO1), a prototypic Nrf2 target gene, without causing any cytotoxicity, using a quantitative bioassay57. The compounds were prepared as stock solutions in acetonitrile and diluted (1:1000) in the cell culture medium, such that the final concentration of acetonitrile was maintained at 0.1% (v/v). Cells were exposed to the Nrf2 activators for 24 h.
Measurement of mitochondrial membrane potential (ΔΨm)
ΔΨm was measured as was described previously22. Briefly, cells were plated on 25 mm coverslips and loaded with 40 nM tetramethyl-rhodamine methyl ester (TMRM) in a HEPES-buffered salt solution (HBSS) (composed of 156 mM NaCl, 3 mM KCl, 2 mM MgSO4, 1.25 mM KH2PO4, 2 mM CaCl2, 10 mM glucose and 10 mM HEPES; pH adjusted to 7.35 with NaOH) for 40 minutes at room temperature and keeping the dye present in the chamber at the time of recording. TMRM is a cell-permeant fluorescent dye used in the redistribution mode to assess ΔΨm, and therefore a reduction in TMRM fluorescence represents ΔΨm depolarization. Confocal images were obtained using a Zeiss 710 VIS CLSM (Zeiss, Oberkochen, Germany) equipped with a META detection system and a × 40 oil immersion objective. TMRM was excited using the 560 nm laser line and fluorescence was measured above 580 nm. The Z-stack images were analyzed using the Volocity software (PerkinElmer, Waltham, MA) and TMRM values for control cases were set to 100% and the p62 deficient cells values were expressed relative to controls. For analysis of response to mitochondrial toxins, images were recorded in a time course-dependent manner from a single focal plane and analyzed using ZEN Zeiss software (Zeiss).
Measurement of NADH-FAD autofluorescence
NADH autofluorescence was measured using an epifluorescence inverted microscope equipped with a 20× fluorite objective. Excitation light at a wavelength of 350 nm was provided by a Xenon arc lamp, with the beam passing through a monochromator (Cairn Research, Faversham, Kent, UK). Emitted fluorescence light was reflected through a 455 nm long-pass filter to a cooled CCD camera (Retiga, QImaging, Surrey, BC, Canada) and digitised to 12 bit resolution. Imaging data were collected and analyzed using software from Andor (Belfast, UK). FAD autofluorescence was monitored using a Zeiss 710 VIS CLSM equipped with a META detection system and a × 40 oil immersion objective. Excitation was measured using the 454 nm Argon laser line and fluorescence was measured from 505 to 550 nm. Illumination intensity was kept to a minimum (at 0.1–0.2% of laser output) to avoid phototoxicity and the pinhole set to give an optical slice of ~2 μm.
Complex I activity assay
The NADH dehydrogenase activity of isolated complex I was measured using the complex I enzyme activity microplate assay kit (Abcam, ab109721). Cell lysis was carried out using the lysis buffer provided by the manufacturer and left on ice for 20 min to allow protein extraction. Samples were then centrifuged at 12, 000 × g for 20 min at 4 °C and total protein concentration in the supernatant was estimated using the Pierce BCA Protein Assay Kit (Thermo Fisher, Waltham, MA, USA). Samples were then diluted in Incubation Solution (provided by the manufacturer) to reach a final protein concentration of 0.5 μg/μl. 200 μl of each sample were transferred to each well of the microplate containing immobilised anti-complex I antibody bound to the wells and incubated for 3 hr at RT. After the incubation period, the wells were rinsed twice in 300 μl of Buffer, provided by the manufacturer, and 200 μl of Assay Solution containing NADH and a reporter dye were added to each well. NADH dehydrogenase activity was determined by measuring the oxidation of exogenous NADH to NAD+, coupled to the 1:1 reduction of the reporter dye of which product concentration was proportional to the increase in absorbance at 450 nm, measured over time using a spectrophotometer. Complex I activity was expressed as the rate of increase in absorbance per amount of sample loaded in the well.
ROS measurements
Cellular ROS generation was measured using dihydroethidium (Het, DHE; 2 μM for superoxide) from Life Technologies (Paisley, UK). All imaging was performed in HBSS and the dye was present in the solution during the experiment. No preincubation (“loading”) was used for Het to limit the intracellular accumulation of oxidized products. Fluorescence images were collected with a 12-bit resolution cooled CCD camera coupled to an epifluorescence inverted microscope equipped with a 20× fluorite objective (Leica Microsystems). The excitation wavelength for the oxidised form (ethidium) was 530 nm collected at 605 nm while excitation to measure changes in the reduced form (hydroethidium) was 380 nm collecting the emission at 405–470 nm. Ratiometric Het fluorescence was recorded with excitation light at 380 and 530 nm. All imaging data were collected and analyzed using the Metamorph software (Molecular Devices, US).
GSH measurements
The reduced glutathione (GSH) levels were determined in live cells after incubation with 50 μM monochlorobimane (MCB) for 40 minutes at room temperature in HBSS until a steady state was reached. MCB is a nonfluorescent probe until conjugated with GSH. Once the cytosolic GSH was analyzed, HBSS was removed and a hypotonic medium (135 mM KCl, 10 mM NaCl, 20 mM HEPES, 0.5 mM KH2PO4, 1 mM MgCl2, 5 mM EGTA and 1.86 mM CaCl2 at pH 7.1) including digitonin (40μM) was added to permeabilise the cells allowing us to measure the mitochondrial GSH. The fluorescence images of the MCB-GSH adduct were acquired using the cooled CCD imaging system as described above using excitation at 380 nm and emission at >400 nm. The fluorescence was then quantified using the Metamorph analysis software (Molecular Devices, US). Additionally, quantitative GSH analysis was performed in live cells in a modified protocol as was previously described58. Briefly, cells were plated in 96 well plates. Once they reached 70–80% of confluence they were loaded for 30 minutes with 2 mM MCB allowing the formation of the MCB-GSH fluorescent adduct inside cells. The fluorescence was then quantified using the Varioskan plate reader (Thermo Fisher, Waltham, MA, USA) with excitation wavelength at 380 nm and emission at 470 nm. Fluorescence values were then related to the protein content (Pierce BCA Protein Assay Kit, Thermo Fisher, Waltham, MA, USA).
Statistical Analysis
Data were generated from a minimum of three independent replicate per experiment (n ≥ 3) performed in different days. Each replicate consisted of at least 1 coverslip per condition where a number of 15–30 cells per coverslip were analyzed. Statistical analysis and exponential curve fitting were performed using GraphPad Prism 6.01 (GraphPad Software, La Jolla, CA) software. Statistical significance for multiple comparisons was performed by one-way ANOVA followed by Fisher’s LSD correction. All results are related to healthy control fibroblasts or untransfected cells accordingly and expressed as percentage. In all cases, P < 0.05 was considered significant (*p < 0.05, **p < 0.01, ***p < 0.001). For all graphs, error bars represent mean ± SEM.
Ethical Approval and Informed Consent
Primary fibroblast lines were generated from skin punch biopsies. Donors gave written consent, and the project was approved by the local ethical review committee from the National Hospital for Neurology and Neurosurgery and the Institute of Neurology.
Electronic supplementary material
Acknowledgements
We are grateful to the patients and donors without which these work would not have been possible. We thank Patricio Aller and Elena de Blas in the assessment of GSH levels. We also thank the i+12 Proteomic Unit, in particular Ines Garcia-Consuegra for her advice in the Complex I activity measurement in fibroblasts. We also thank Maria Teresa Seisdedos from the CIB Microscopy Unit helping to setup the fluorescence measurements in living cells. FB is supported by a Sara Borrell fellowship from the Spanish Instituto de Salud Carlos III. N.E. holds a postdoctoral fellowship from the Spanish Fundación Alfonso Martín Escudero. This work was supported by a career development award from the MRC (G0700183), by an ALS Association Initiated award (ID#2109) by the Motor Neuron Disease Association, partially by the Wellcome Trust/MRC Joint Call in Neurodegeneration award (WT089698) to the UK Parkinson’s Disease Consortium (UKPDC) whose members are from the UCL/Institute of Neurology, the University of Sheffield and the MRC Protein Phosphorylation Unit at the University of Dundee and supported by the National Institute for Health Research University College London Hospitals Biomedical Research Centre. AMR is supported by grant CTQ2015-66313-R from MINECO, Spain. ILB has received funding from the program “Investissements d’avenir” ANR-10-IAIHU-06, FP7-Neuromics, PHRC FTLD-exomes. EC is supported by grants from the Instituto de Salud Carlos III (FIS2012/00486; BA14/00058), FEDER, Fundación Investigación Médica Mutua Madrileña (2010/0004), Fundación Ramón Areces (CIVP16A1825), and CIBERNED.
Author Contributions
F.B. performed the experiments and wrote the manuscript. NE carried out the experiments involving Nrf2 activation. A.Y.A., J.H. and E.C. directed the research. C.B.B., M.V., A.G. and I.L.B carried out the patient’s clinical characterisation and provided the patient fibroblasts. TH and ATDK provided the Nrf2 activators. A.M.R., J.H., E.C. and A.Y.A. obtained part of the funding for this project. All authors contributed writing the final draft of this manuscript.
Competing Interests
The authors declare that they have no competing interests.
Footnotes
A correction to this article is available online at https://doi.org/10.1038/s41598-018-22152-9.
Electronic supplementary material
Supplementary information accompanies this paper at doi:10.1038/s41598-017-01678-4
Publisher's note: Springer Nature remains neutral with regard to jurisdictional claims in published maps and institutional affiliations.
Contributor Information
Fernando Bartolome, Email: fbartolome.imas12@h12o.es.
Andrey Y. Abramov, Email: a.abramov@ucl.ac.uk
References
- 1.Hardy J, Rogaeva E. Motor neuron disease and frontotemporal dementia: sometimes related, sometimes not. Experimental neurology. 2014;262(Pt B):75–83. doi: 10.1016/j.expneurol.2013.11.006. [DOI] [PubMed] [Google Scholar]
- 2.Johnson JO, et al. Exome sequencing reveals VCP mutations as a cause of familial ALS. Neuron. 2010;68:857–864. doi: 10.1016/j.neuron.2010.11.036. [DOI] [PMC free article] [PubMed] [Google Scholar]
- 3.Le Ber I, et al. SQSTM1 mutations in French patients with frontotemporal dementia or frontotemporal dementia with amyotrophic lateral sclerosis. JAMA neurology. 2013;70:1403–1410. doi: 10.1001/jamaneurol.2013.3849. [DOI] [PMC free article] [PubMed] [Google Scholar]
- 4.Pottier C, et al. Whole-genome sequencing reveals important role for TBK1 and OPTN mutations in frontotemporal lobar degeneration without motor neuron disease. Acta neuropathologica. 2015;130:77–92. doi: 10.1007/s00401-015-1436-x. [DOI] [PMC free article] [PubMed] [Google Scholar]
- 5.Vengoechea J, David MP, Yaghi SR, Carpenter L, Rudnicki SA. Clinical variability and female penetrance in X-linked familial FTD/ALS caused by a P506S mutation in UBQLN2. Amyotrophic lateral sclerosis & frontotemporal degeneration. 2013;14:615–619. doi: 10.3109/21678421.2013.824001. [DOI] [PubMed] [Google Scholar]
- 6.DeJesus-Hernandez M, et al. Expanded GGGGCC hexanucleotide repeat in noncoding region of C9ORF72 causes chromosome 9p-linked FTD and ALS. Neuron. 2011;72:245–256. doi: 10.1016/j.neuron.2011.09.011. [DOI] [PMC free article] [PubMed] [Google Scholar]
- 7.Gal J, et al. Sequestosome 1/p62 links familial ALS mutant SOD1 to LC3 via an ubiquitin-independent mechanism. J Neurochem. 2009;111:1062–1073. doi: 10.1111/j.1471-4159.2009.06388.x. [DOI] [PMC free article] [PubMed] [Google Scholar]
- 8.Pikkarainen M, Hartikainen P, Alafuzoff I. Neuropathologic Features of Frontotemporal Lobar Degeneration With Ubiquitin-Positive Inclusions Visualized With Ubiquitin-Binding Protein p62 Immunohistochemistry. Journal of Neuropathology & Experimental Neurology. 2008;67:280–298. doi: 10.1097/NEN.0b013e31816a1da2. [DOI] [PubMed] [Google Scholar]
- 9.Hiji M, et al. White matter lesions in the brain with frontotemporal lobar degeneration with motor neuron disease: TDP-43-immunopositive inclusions co-localize with p62, but not ubiquitin. Acta neuropathologica. 2008;116:183–191. doi: 10.1007/s00401-008-0402-2. [DOI] [PubMed] [Google Scholar]
- 10.Deng HX, et al. FUS-immunoreactive inclusions are a common feature in sporadic and non-SOD1 familial amyotrophic lateral sclerosis. Ann Neurol. 2010;67:739–748. doi: 10.1002/ana.22051. [DOI] [PMC free article] [PubMed] [Google Scholar]
- 11.Narendra D, Kane LA, Hauser DN, Fearnley IM, Youle RJ. p62/SQSTM1 is required for Parkin-induced mitochondrial clustering but not mitophagy; VDAC1 is dispensable for both. Autophagy. 2010;6:1090–1106. doi: 10.4161/auto.6.8.13426. [DOI] [PMC free article] [PubMed] [Google Scholar]
- 12.Pimenta de Castro I, et al. Genetic analysis of mitochondrial protein misfolding in Drosophila melanogaster. Cell death and differentiation. 2012;19:1308–1316. doi: 10.1038/cdd.2012.5. [DOI] [PMC free article] [PubMed] [Google Scholar]
- 13.de Castro IP, et al. Drosophila ref(2)P is required for the parkin-mediated suppression of mitochondrial dysfunction in pink1 mutants. Cell death & disease. 2013;4:e873. doi: 10.1038/cddis.2013.394. [DOI] [PMC free article] [PubMed] [Google Scholar]
- 14.Seibenhener ML, et al. A role for sequestosome 1/p62 in mitochondrial dynamics, import and genome integrity. Biochim Biophys Acta. 2013;1833:452–459. doi: 10.1016/j.bbamcr.2012.11.004. [DOI] [PMC free article] [PubMed] [Google Scholar]
- 15.East DA, et al. PMI: A ΔΨm Independent Pharmacological Regulator of Mitophagy. Chemistry & Biology. 2014;21:1585–1596. doi: 10.1016/j.chembiol.2014.09.019. [DOI] [PMC free article] [PubMed] [Google Scholar]
- 16.Lee M, Shin J. Triage of oxidation-prone proteins by Sqstm1/p62 within the mitochondria. Biochem Biophys Res Commun. 2011;413:122–127. doi: 10.1016/j.bbrc.2011.08.067. [DOI] [PubMed] [Google Scholar]
- 17.Kwon J, et al. Assurance of mitochondrial integrity and mammalian longevity by the p62-Keap1-Nrf2-Nqo1 cascade. EMBO reports. 2012;13:150–156. doi: 10.1038/embor.2011.246. [DOI] [PMC free article] [PubMed] [Google Scholar]
- 18.Lopez-Gonzalez R, et al. Poly(GR) in C9ORF72-Related ALS/FTD Compromises Mitochondrial Function and Increases Oxidative Stress and DNA Damage in iPSC-Derived Motor Neurons. Neuron. 2016;92:383–391. doi: 10.1016/j.neuron.2016.09.015. [DOI] [PMC free article] [PubMed] [Google Scholar]
- 19.Onesto E, et al. Gene-specific mitochondria dysfunctions in human TARDBP and C9ORF72 fibroblasts. Acta neuropathologica communications. 2016;4:47. doi: 10.1186/s40478-016-0316-5. [DOI] [PMC free article] [PubMed] [Google Scholar]
- 20.Stoica R, et al. ER-mitochondria associations are regulated by the VAPB-PTPIP51 interaction and are disrupted by ALS/FTD-associated TDP-43. Nat Commun. 2014;5:3996. doi: 10.1038/ncomms4996. [DOI] [PMC free article] [PubMed] [Google Scholar]
- 21.Stoica R, et al. ALS/FTD-associated FUS activates GSK-3beta to disrupt the VAPB-PTPIP51 interaction and ER-mitochondria associations. EMBO reports. 2016;17:1326–1342. doi: 10.15252/embr.201541726. [DOI] [PMC free article] [PubMed] [Google Scholar]
- 22.Bartolome F, et al. Pathogenic VCP mutations induce mitochondrial uncoupling and reduced ATP levels. Neuron. 2013;78:57–64. doi: 10.1016/j.neuron.2013.02.028. [DOI] [PMC free article] [PubMed] [Google Scholar]
- 23.Bartolome F, Abramov AY. Measurement of mitochondrial NADH and FAD autofluorescence in live cells. Methods in molecular biology. 2015;1264:263–270. doi: 10.1007/978-1-4939-2257-4_23. [DOI] [PubMed] [Google Scholar]
- 24.Holmstrom KM, et al. Nrf2 impacts cellular bioenergetics by controlling substrate availability for mitochondrial respiration. Biology open. 2013;2:761–770. doi: 10.1242/bio.20134853. [DOI] [PMC free article] [PubMed] [Google Scholar]
- 25.Ludtmann MH, Angelova PR, Zhang Y, Abramov AY, Dinkova-Kostova AT. Nrf2 affects the efficiency of mitochondrial fatty acid oxidation. The Biochemical journal. 2014;457:415–424. doi: 10.1042/BJ20130863. [DOI] [PMC free article] [PubMed] [Google Scholar]
- 26.Komatsu M, et al. The selective autophagy substrate p62 activates the stress responsive transcription factor Nrf2 through inactivation of Keap1. Nat Cell Biol. 2010;12:213–223. doi: 10.1038/ncb2021. [DOI] [PubMed] [Google Scholar]
- 27.Cozzolino M, Carri MT. Mitochondrial dysfunction in ALS. Progress in neurobiology. 2012;97:54–66. doi: 10.1016/j.pneurobio.2011.06.003. [DOI] [PubMed] [Google Scholar]
- 28.Bastow EL, et al. New links between SOD1 and metabolic dysfunction from a yeast model of amyotrophic lateral sclerosis. Journal of cell science. 2016;129:4118–4129. doi: 10.1242/jcs.190298. [DOI] [PMC free article] [PubMed] [Google Scholar]
- 29.Engelen-Lee, J. et al. Proteomic profiling of the spinal cord in ALS: decreased ATP5D levels suggest synaptic dysfunction in ALS pathogenesis. Amyotrophic lateral sclerosis & frontotemporal degeneration, 1–11, doi:10.1080/21678421.2016.1245757 (2016). [DOI] [PubMed]
- 30.Magri A, et al. Hexokinase I N-terminal based peptide prevents the VDAC1-SOD1 G93A interaction and re-establishes ALS cell viability. Scientific reports. 2016;6:34802. doi: 10.1038/srep34802. [DOI] [PMC free article] [PubMed] [Google Scholar]
- 31.Bannwarth S, et al. A mitochondrial origin for frontotemporal dementia and amyotrophic lateral sclerosis through CHCHD10 involvement. Brain: a journal of neurology. 2014;137:2329–2345. doi: 10.1093/brain/awu138. [DOI] [PMC free article] [PubMed] [Google Scholar]
- 32.Nalbandian A, et al. In vitro studies in VCP-associated multisystem proteinopathy suggest altered mitochondrial bioenergetics. Mitochondrion. 2015;22:1–8. doi: 10.1016/j.mito.2015.02.004. [DOI] [PMC free article] [PubMed] [Google Scholar]
- 33.Paillusson S, et al. There’s Something Wrong with my MAM; the ER-Mitochondria Axis and Neurodegenerative Diseases. Trends Neurosci. 2016;39:146–157. doi: 10.1016/j.tins.2016.01.008. [DOI] [PMC free article] [PubMed] [Google Scholar]
- 34.Wang W, et al. The inhibition of TDP-43 mitochondrial localization blocks its neuronal toxicity. Nat Med. 2016;22:869–878. doi: 10.1038/nm.4130. [DOI] [PMC free article] [PubMed] [Google Scholar]
- 35.Johnson JO, et al. Mutations in the CHCHD10 gene are a common cause of familial amyotrophic lateral sclerosis. Brain: a journal of neurology. 2014;137:e311. doi: 10.1093/brain/awu265. [DOI] [PMC free article] [PubMed] [Google Scholar]
- 36.Kim NC, et al. VCP is essential for mitochondrial quality control by PINK1/Parkin and this function is impaired by VCP mutations. Neuron. 2013;78:65–80. doi: 10.1016/j.neuron.2013.02.029. [DOI] [PMC free article] [PubMed] [Google Scholar]
- 37.Campanella M, et al. Regulation of mitochondrial structure and function by the F1Fo-ATPase inhibitor protein, IF1. Cell metabolism. 2008;8:13–25. doi: 10.1016/j.cmet.2008.06.001. [DOI] [PubMed] [Google Scholar]
- 38.Duberley KE, et al. Human neuronal coenzyme Q10 deficiency results in global loss of mitochondrial respiratory chain activity, increased mitochondrial oxidative stress and reversal of ATP synthase activity: implications for pathogenesis and treatment. Journal of inherited metabolic disease. 2013;36:63–73. doi: 10.1007/s10545-012-9511-0. [DOI] [PubMed] [Google Scholar]
- 39.Gandhi S, et al. PINK1-associated Parkinson’s disease is caused by neuronal vulnerability to calcium-induced cell death. Molecular cell. 2009;33:627–638. doi: 10.1016/j.molcel.2009.02.013. [DOI] [PMC free article] [PubMed] [Google Scholar]
- 40.Rego AC, Vesce S, Nicholls DG. The mechanism of mitochondrial membrane potential retention following release of cytochrome c in apoptotic GT1-7 neural cells. Cell death and differentiation. 2001;8:995–1003. doi: 10.1038/sj.cdd.4400916. [DOI] [PubMed] [Google Scholar]
- 41.Angelova PR, et al. Lipid peroxidation is essential for alpha-synuclein-induced cell death. J Neurochem. 2015;133:582–589. doi: 10.1111/jnc.13024. [DOI] [PMC free article] [PubMed] [Google Scholar]
- 42.Deas E, et al. Alpha-synuclein oligomers interact with metal ions to induce oxidative stress and neuronal death in Parkinson’s disease. Antioxidants & redox signaling. 2015 doi: 10.1089/ars.2015.6343. [DOI] [PMC free article] [PubMed] [Google Scholar]
- 43.Leuner K, et al. Mitochondrion-derived reactive oxygen species lead to enhanced amyloid beta formation. Antioxidants & redox signaling. 2012;16:1421–1433. doi: 10.1089/ars.2011.4173. [DOI] [PMC free article] [PubMed] [Google Scholar]
- 44.Bobba A, et al. Mitochondrial respiratory chain Complexes I and IV are impaired by beta-amyloid via direct interaction and through Complex I-dependent ROS production, respectively. Mitochondrion. 2013;13:298–311. doi: 10.1016/j.mito.2013.03.008. [DOI] [PubMed] [Google Scholar]
- 45.Reeve AK, et al. Aggregated alpha-synuclein and complex I deficiency: exploration of their relationship in differentiated neurons. Cell death & disease. 2015;6:e1820. doi: 10.1038/cddis.2015.166. [DOI] [PMC free article] [PubMed] [Google Scholar]
- 46.Gandhi S, et al. Dopamine induced neurodegeneration in a PINK1 model of Parkinson’s disease. PLoS One. 2012;7:e37564. doi: 10.1371/journal.pone.0037564. [DOI] [PMC free article] [PubMed] [Google Scholar]
- 47.Hayes JD, Dinkova-Kostova AT. The Nrf2 regulatory network provides an interface between redox and intermediary metabolism. Trends in biochemical sciences. 2014;39:199–218. doi: 10.1016/j.tibs.2014.02.002. [DOI] [PubMed] [Google Scholar]
- 48.Esteras N, Dinkova-Kostova AT, Abramov AY. Nrf2 activation in the treatment of neurodegenerative diseases: a focus on its role in mitochondrial bioenergetics and function. Biological chemistry. 2016;397:383–400. doi: 10.1515/hsz-2015-0295. [DOI] [PubMed] [Google Scholar]
- 49.Kovac S, et al. Nrf2 regulates ROS production by mitochondria and NADPH oxidase. Biochim Biophys Acta. 2015;1850:794–801. doi: 10.1016/j.bbagen.2014.11.021. [DOI] [PMC free article] [PubMed] [Google Scholar]
- 50.Fernandez-Fernandez S, Almeida A, Bolanos JP. Antioxidant and bioenergetic coupling between neurons and astrocytes. The Biochemical journal. 2012;443:3–11. doi: 10.1042/BJ20111943. [DOI] [PubMed] [Google Scholar]
- 51.Flohe L, Toppo S, Cozza G, Ursini F. A comparison of thiol peroxidase mechanisms. Antioxidants & redox signaling. 2011;15:763–780. doi: 10.1089/ars.2010.3397. [DOI] [PubMed] [Google Scholar]
- 52.Rodriguez-Rodriguez P, Fernandez E, Almeida A, Bolanos JP. Excitotoxic stimulus stabilizes PFKFB3 causing pentose-phosphate pathway to glycolysis switch and neurodegeneration. Cell death and differentiation. 2012;19:1582–1589. doi: 10.1038/cdd.2012.33. [DOI] [PMC free article] [PubMed] [Google Scholar]
- 53.Muqit MM, et al. Altered cleavage and localization of PINK1 to aggresomes in the presence of proteasomal stress. J Neurochem. 2006;98:156–169. doi: 10.1111/j.1471-4159.2006.03845.x. [DOI] [PubMed] [Google Scholar]
- 54.Honda T, et al. Novel tricyclic compounds having acetylene groups at C-8a and cyano enones in rings A and C: highly potent anti-inflammatory and cytoprotective agents. Journal of medicinal chemistry. 2007;50:1731–1734. doi: 10.1021/jm070141c. [DOI] [PMC free article] [PubMed] [Google Scholar]
- 55.Reisman SA, Lee CY, Meyer CJ, Proksch JW, Ward KW. Topical application of the synthetic triterpenoid RTA 408 activates Nrf2 and induces cytoprotective genes in rat skin. Archives of dermatological research. 2014;306:447–454. doi: 10.1007/s00403-013-1433-7. [DOI] [PubMed] [Google Scholar]
- 56.Zhang Y, Talalay P, Cho CG, Posner GH. A major inducer of anticarcinogenic protective enzymes from broccoli: isolation and elucidation of structure. Proceedings of the National Academy of Sciences of the United States of America. 1992;89:2399–2403. doi: 10.1073/pnas.89.6.2399. [DOI] [PMC free article] [PubMed] [Google Scholar]
- 57.Fahey JW, Dinkova-Kostova AT, Stephenson KK, Talalay P. The “Prochaska” microtiter plate bioassay for inducers of NQO1. Methods in enzymology. 2004;382:243–258. doi: 10.1016/S0076-6879(04)82014-7. [DOI] [PubMed] [Google Scholar]
- 58.Kamencic H, Lyon A, Paterson PG, Juurlink BH. Monochlorobimane fluorometric method to measure tissue glutathione. Analytical biochemistry. 2000;286:35–37. doi: 10.1006/abio.2000.4765. [DOI] [PubMed] [Google Scholar]
Associated Data
This section collects any data citations, data availability statements, or supplementary materials included in this article.