Abstract
A synthetic lethal interaction is a type of genetic interaction where the disruption of either of two genes individually has little effect but their combined disruption is lethal. Knowledge of synthetic lethal interactions can allow for elucidation of network structure and identification of candidate drug targets for human diseases such as cancer. In Drosophila, combinatorial gene disruption has been achieved previously by combining multiple RNAi reagents. Here we describe a protocol for high-throughput combinatorial gene disruption by combining CRISPR and RNAi. This approach previously resulted in the identification of highly reproducible and conserved synthetic lethal interactions ( Housden et al., 2015 ).
Keywords: Synthetic lethality, Screening, RNAi, Drosophila, S2R+ cells, Cell culture, CRISPR
Background
Knowledge of genetic interactions such as synthetic lethality can be invaluable for determining the functional relationships between genes. For example, large scale genetic interaction screens in yeast were recently used to assemble a global ‘wiring diagram of cellular function’ ( Costanzo et al., 2016 ). Alternatively, specific types of genetic interaction such as synthetic lethal interactions can be used to identify drug targets for diseases including cancer (Kaelin, 2005).
Identification of synthetic interactions requires combinatorial disruption of two genes. A previous method to achieve this in Drosophila cell culture was to deliver multiple dsRNA reagents simultaneously (e.g., Fisher et al., 2015). However, RNAi reagents have limitations including off-target effects and incomplete target knockdown, which are compounded when multiple reagents are delivered together. By combining CRISPR mutagenesis with single dsRNA treatments, these issues are avoided, leading to simpler interpretation of screen results and robust identification of ‘hits’.
Materials and Reagents
10 cm dish (e.g., Corning, catalog number: 430167)
T75 flasks (Corning, catalog number: 430641U)
0.2 μm filter (Thermo Fisher Scientific, catalog number: 156-4020)
6-well tissue culture plates (Corning, catalog number: 3516)
96-well clear bottom tissue culture plates (Corning, catalog number: 3610)
40 μm cell strainer (Corning, Falcon®, catalog number: 352340)
Parafilm (Parafilm, catalog number: PM-999)
24-well plate
15 ml conical tube
Tips
S2R+ cells (Drosophila Genomics Resource Center, catalog number: 150)
sgRNA expression plasmid (pl18 - available from author on request)
act-GFP plasmid (available from author on request)
Chemically competent E. coli cells (e.g., Thermo Fisher Scientific, InvitrogenTM, catalog number: C404003)
Effectene Transfection Reagent Kit (QIAGEN, catalog number: 301427)
PBS (Thermo Fisher Scientific, GibcoTM, catalog number: 10010023) with 1% FBS (GE Healthcare, HyCloneTM, catalog number: SH30541.03)
HRMA reagents (Housden and Perrimon, 2016)
Zero-Blunt TOPO PCR Cloning Kit (Thermo Fisher Scientific, InvitrogenTM, catalog number: 450245)
M13F and M13R primers
dsRNA library in 384-well opaque, white tissue culture plates with 5 μl dsRNA at 50 ng/μl per well (see the Drosophila RNAi Screening Center [http://fgr.hms.harvard.edu/fly-cell-rnai-libraries] for available libraries). Note that this protocol focuses on dsRNA libraries available from the DRSC but additional libraries are also available from other sources.
CellTiter-Glo reagent (Promega, catalog number: G7570)
Schneider’s Drosophila media (Thermo Fisher Scientific, GibcoTM, catalog number: 21720)
Penicillin/streptomycin (Thermo Fisher Scientific, Invitrogen, catalog number: 15070063)
Complete media (10% FBS) (see Recipes)
High-serum media (20% FBS) (see Recipes)
Serum-free Schneider’s media (see Recipes)
Equipment
10 ml pipette
Humidity chamber (a tupperware box lined with damp paper towels is fine)
25 °C cell culture incubator (any brand – CO2 regulation is not necessary)
Microscope (e.g., Leica Microsystems, model: DMIL, with 10x objective and any brand of camera)
12-channel 100 μl pipette (e.g., Thermo Labsystems)
12-channel 10-50 μl pipette (e.g., Thermo Labsystems)
Centrifuge with plate-compatible rotor (any brand)
Pasteur pipette
Haemocytometer (any brand)
Multichannel reservoir
Timer
Rotator
Plate reader with luminescence reading capability (e.g., Molecular Devices, model: SpectraMax Paradigm)
Fluorescence-activated cell sorter (e.g., BD FACSAria)
Thermal cycler (any brand)
Procedure
-
Preparation of conditioned media
Grow S2R+ cells to 100% confluency in a 10 cm dish or T75 flask in complete media. Cells should be cultured under standard conditions: 25 °C, with ambient CO2 levels.
Split cells 1:5 using complete media and culture for 3 days (or until almost 100% confluent but without overlapping cells).
Remove all media and replace with 10 ml complete media.
Immediately detach cells by gently pipetting the complete media using a 10 ml pipette to wash the cells off the bottom of the dish/flask, then transfer 5 ml of cell suspension to a new dish or flask and add an additional 5 ml complete media.
Grow for 16 h (no longer). Check to ensure that the cells look healthy at this point.
Collect media and sterilize using a 0.2 μm filter to remove all cells.
Dilute media 1:1 using high-serum media. Store at 4 °C up to four weeks.
-
Generation of mutant cell lines
Design and generate a sgRNA expression plasmid using the pl18 vector as described previously ( Housden et al., 2016 ).
Seed S2R+ cells in complete media into a 6-well plate such that cells will be 40-80% confluent upon attachment (2-8 x 10⁵ cells per well in 1 ml complete media). Allow to attach for ~20 min at 25 °C.
Transfect cells with 40 ng act-GFP plasmid and 360 ng of sgRNA expression plasmid from step B1 using 10 μl Effectene reagent according to the standard Effectene Transfection Reagent protocol.
Incubate cells at 25 °C for 4 days.
Place 100 μl conditioned media in each well of three clear-bottom 96-well tissue culture plates.
Aspirate spent media from transfected cells and detach by gentle pipetting with 1 ml PBS/1% FBS. Filter cell suspension through a 40 μm filter to remove cell aggregates.
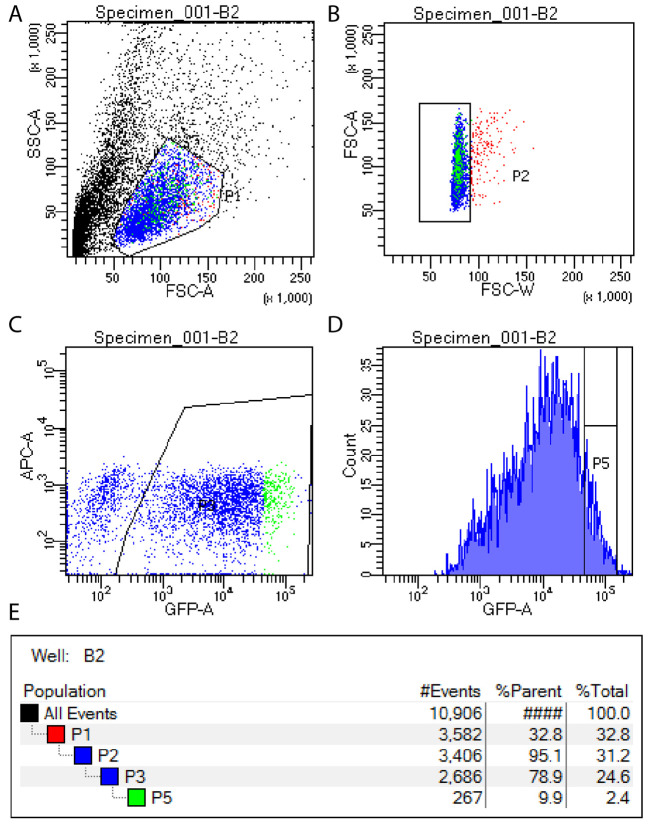
Use FACS to isolate the top 10% of GFP expressing cells, excluding the top 1% of GFP cells (which are generally not viable). See Note 1 and Figure 1.
Seed 100 cells into well A1 of each 96-well culture plate (this will be used to find the focal plane in step B10) and a single cell into the remaining 95 wells of each plate.
Seal plate edges with Parafilm and place in a humidity chamber inside a 25 °C incubator.
Incubate plates for 2 weeks and then examine each well under a microscope to identify those containing colonies, using well A1 to focus the microscope.
For wells containing colonies that have grown to a sufficient size (see Figure 2 for examples of suitable colonies), resuspend the colony in the media already in the well by gentle pipetting with a 100 μl pipette. Mix 50 μl of the cell suspension with 75 μl conditioned media and transfer to a well of a new 96-well plate. Use the remaining 50 μl cell suspension for a genomic DNA preparation for analysis of mutations.
Identify mutant colonies using the previously described genomic DNA and HRMA protocols (Housden and Perrimon, 2016).
Confirm that mutations are homozygous frameshifts by sequencing TOPO-cloned PCR product from step B12 using M13F and M13R primers. We recommend sequencing at least 20 TOPO-cloned constructs for each sample to ensure that all allele sequences of the target gene are identified.
Following identification of mutant clones, the relevant cell population can be expanded by serially transferring from the 96-well plate to a 24-well plate and then a 6-well plate and finally a 10 cm dish or T75 flask. Cells should be transferred using conditioned media until they reach a 6-well plate, at which point complete media can be used. Transfers should be performed when cells reach confluence at each stage.
-
dsRNA screen
Defrost the 384-well dsRNA assay plates from -80 °C storage and centrifuge at 805 × g for 2 min before use.
Remove media from cells cultured in T75 flasks or 10 cm dishes using a Pasteur pipette while taking care not to detach the cells. Note that S2R+ cells are adherent but will detach easily when disturbed.
Add 10 ml serum-free media warmed to room temperature to each T75 flask or 10 cm dish. Use this media to detach the cells by gentle pipetting and transfer to a 15 ml conical tube.
Count cells using a haemocytometer and dilute to 500,000 cells per ml with fresh serum-free media.
Remove seals from each assay plate, holding the plate down while the seal is pulled away.
Transfer diluted cell suspension to a multichannel reservoir and dispense 10 μl (5,000 cells) into each well of each 384-well dsRNA assay plate. Tips do not need to be changed between each well but cell suspension should be pipetted onto the well walls to avoid transferring dsRNA reagents between wells. Start a timer when the first cells are added to the first plate.
Centrifuge plates briefly (130 × g for 5 sec) to move the cell suspension to the bottom of the wells, then place in a sterile hood at room temperature to incubate.
At 45 min after adding the first set of cells, begin to add 35 μl complete media (10% FBS) to each well. Add the complete media to the plates in the same order as the cells were previously added.
Seal plate edges with Parafilm and place into a humidity chamber.
Incubate at 25 °C for 5 days.
Add 30 μl of CellTiter-Glo reagent to each well of the assay plates and gently mix CellTiter-Glo reagent with cells (by placing on a rotator or with gentle shaking for 5 min at room temperature) to allow cells to lyse. Take care not to mix too vigorously to avoid splashing of samples between wells or creation of bubbles.
Read luminescence using a suitable plate reader.
Figure 1. FACS setup for isolation of single GFP positive cells.
GFP positive cells are isolated by first selecting viable cells (A), then removing doublets (B), then identifying all GFP positive cells (C) and finally selecting the top 10% of GFP expressing cells for sorting (D). Gating hierarchy is shown in panel E.
Figure 2. Examples of suitable colonies for expansion and sequence analysis.
Data analysis
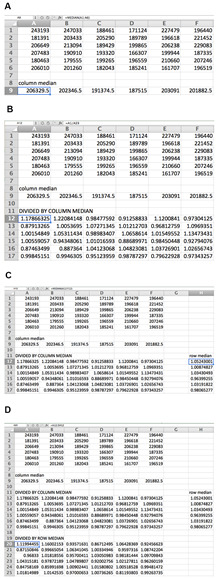
For each plate, remove data for all edge wells (see Note 2) and divide the recorded luminescence values by the median of the respective column, then further divide the new values by the median of each respective row. These transformations account for human error in pipetting and normal variance. See Figure 3 for an illustration of the normalization strategy.
Convert plate data layout into a single column (a tool for this purpose is available at http://www.flyrnai.org/cgi-bin/DRSC_serialize.pl). Convert all values to log2 to normalize distributions.
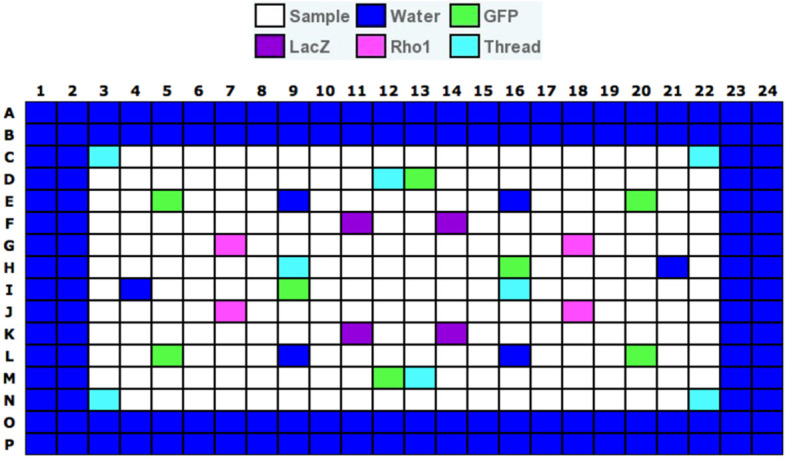
Calculate the mean and standard deviation of negative control dsRNA reagents (known non-lethal gene targets and non-targeting dsRNAs – see Note 2 and Figure 4 for details of example negative control locations) for each replicate of the screen in each cell line to identify dsRNAs with viability effects above assay noise (see Notes 3 and 4).
Calculate Z-scores for all data points using mean and standard deviation of controls as calculated in Data analysis step 3 for the respective replicate and cell line: Z = (X-mean)/standard deviation. See http://www.statisticshowto.com/probability-and-statistics/z-score/ for a more detailed description of Z-scores and their interpretation.
Identify hits as dsRNA reagents that reduce viability (Z ≤ -1.5) of at least replicates in the mutant cell line and have no viability effect (Z > -1.5) in at least replicates in the wildtype cells.
Figure 3. Data normalization by columns and rows for 36-well example plate.

The median of each column is first calculated (A), and each value is then divided by the median of its column (B). The median of each row of transformed data is then calculated (C), and each transformed value is divided by the median of its row (D). The formula for each calculation is shown for the data point in the box.
Figure 4. Example of a plate layout for a Drosophila RNAi Screening Center test plate.

Layout of wells varies between libraries. GFP and LacZ do not affect viability of S2R+ cells, and Rho1 and Thread are lethal. Image provided by the DRSC.
Notes
We recommend performing the FACS isolation of individual cells with an experienced FACS technician. In addition, untransfected cells should be used to determine autofluorescence levels before gating to isolate GFP positive cells.
Edge wells are wells that contain water instead of dsRNA reagents around the edge of each assay plate. These are included because edge wells tend to have higher variability than central wells. See Drosophila RNAi Screening Center (http://fgr.hms.harvard.edu/plate-layouts) for details of typical assay plate layouts. Layout for a test plate is depicted in Figure 4 as an example.
We recommend performing three replicate screens. However, given the high costs associated with large scale screens, two replicates can be performed to save time and resources. In this case, additional validation of results may be necessary to identify false positive results.
Z-scores can be calculated using only negative control samples or the entire dataset. For small screens (less than 1,000 genes), we recommend using only negative controls because true hits can have a significant effect on the standard deviation of the whole dataset and therefore reduce sensitivity of hit calling. For large screens, such as with a genome-wide library, calculating Z-scores using the whole dataset provides a better representation of noise within the data.
Recipes
-
Complete media
Schneider’s Drosophila media
10% FBS
1% penicillin/streptomycin
-
High serum media
Schneider’s Drosophila media
20% FBS
1% penicillin/streptomycin
-
Serum-free Schneider’s media
Schneider’s Drosophila media
1% penicillin/streptomycin
Acknowledgments
RNAi protocols used here are modified from those developed by the Drosophila RNAi Screening Center (DRSC) (fgr.hms.harvard.edu). Work in the Perrimon lab is supported by the NIH and the Howard Hughes Medical Institute.
Citation
Readers should cite both the Bio-protocol article and the original research article where this protocol was used.
References
- 1.Costanzo M., VanderSluis B., Koch E. N., Baryshnikova A., Pons C., Tan G., Wang W., Usaj M., Hanchard J., Lee S. D., Pelechano V., Styles E. B., Billmann M., van Leeuwen J., van Dyk N., Lin Z. Y., Kuzmin E., Nelson J., Piotrowski J. S., Srikumar T., Bahr S., Chen Y., Deshpande R., Kurat C. F., Li S. C., Li Z., Usaj M. M., Okada H., Pascoe N., San Luis B. J., Sharifpoor S., Shuteriqi E., Simpkins S. W., Snider J., Suresh H. G., Tan Y., Zhu H., Malod-Dognin N., Janjic V., Przulj N., Troyanskaya O. G., Stagljar I., Xia T., Ohya Y., Gingras A. C., Raught B., Boutros M., Steinmetz L. M., Moore C. L., Rosebrock A. P., Caudy A. A., Myers C. L., Andrews B. and Boone C.(2016). A global genetic interaction network maps a wiring diagram of cellular function. Science 353(6306). [DOI] [PMC free article] [PubMed] [Google Scholar]
- 2.Fischer B., Sandmann T., Horn T., Billmann M., Chaudhary V., Huber W. and Boutros M.(2015). A map of directional genetic interactions in a metazoan cell. Elife 4. [DOI] [PMC free article] [PubMed] [Google Scholar]
- 3.Housden B. E., Hu Y. and Perrimon N.(2016). Design and generation of Drosophila single guide RNA expression constructs . Cold Spring Harb Protoc 2016(9): pdb prot090779. [DOI] [PubMed] [Google Scholar]
- 4.Housden B. E. and Perrimon N.(2016). Detection of indel mutations in Drosophila by high-resolution melt analysis(HRMA) . Cold Spring Harb Protoc 2016(9): pdb prot090795. [DOI] [PubMed] [Google Scholar]
- 5.Housden B. E., Valvezan A. J., Kelley C., Sopko R., Hu Y., Roesel C., Lin S., Buckner M., Tao R., Yilmazel B., Mohr S. E., Manning B. D. and Perrimon N.(2015). Identification of potential drug targets for tuberous sclerosis complex by synthetic screens combining CRISPR-based knockouts with RNAi. Sci Signal 8(393): rs9. [DOI] [PMC free article] [PubMed] [Google Scholar]
- 6.Kaelin W. G., Jr (2005). The concept of synthetic lethality in the context of anticancer therapy. Nat Rev Cancer 5(9): 689-98. [DOI] [PubMed] [Google Scholar]


