Abstract
Purpose
To present a three-dimensional (3D) segmented echoplanar imaging (EPI) pulse sequence implementation that provides simultaneously the proton resonance frequency shift temperature of aqueous tissue and the longitudinal relaxation time (T1) of fat during thermal ablation.
Methods
The hybrid sequence was implemented by combining a 3D segmented flyback EPI sequence, the extended two-point Dixon fat and water separation, and the double flip angle T1 mapping techniques. High-intensity focused ultrasound (HIFU) heating experiments were performed at three different acoustic powers on excised human breast fat embedded in ex vivo porcine muscle. Furthermore, T1 calibrations with temperature in four different excised breast fat samples were performed, yielding an estimate of the average and variation of dT1/dTacross subjects.
Results
The water only images were used to mask the complex original data before computing the proton resonance frequency shift. T1 values were calculated from the fat-only images. The relative temperature coefficients were found in five fat tissue samples from different patients and ranged from 1.2% to 2.6%/°C.
Conclusion
The results demonstrate the capability of realtime simultaneous temperature mapping in aqueous tissue and T1 mapping in fat during HIFU ablation, providing a potential tool for treatment monitoring in organs with large fat content, such as the breast.
Keywords: temperature, aqueous tissue, fat
Introduction
MR-guided high-intensity focused ultrasound (HIFU) is a noninvasive technique for thermal ablation of solid tumors with real-time image guidance. For thermal therapy to be successful, it is essential that sufficient heat to cause ablation is delivered to the tumor while the heating of healthy surrounding tissue is minimized. Therefore, accurate temperature mapping in the tumor and surrounding tissue throughout a thermal therapy procedure is essential to ensure the safety and efficacy of the treatment.
MRI temperature measurement methods based on the temperature dependency of the water proton resonance frequency (PRF) shift have shown the best ability to quantify temperature rises in aqueous tissues (1,2). Furthermore, the temperature dependency of PRF shows little dependence on the tissue changes that occur when the tissue is rapidly heated, such as with HIFU.
Unfortunately, the PRF shift with temperature does not apply to lipid protons, since there is no hydrogen bonding among the methylene protons that supply the bulk of the fat signal (3). For tissues with large fat content, such as breast tissue (4), a thermometry technique for fat and aqueous tissues is desired. This can be technically challenging, particularly due to the complex chemical structure of the fat molecule. In vivo MR spectroscopy indicates that human breast fat is composed of a number of different fatty acids (5) that yield different chemical shifts. The dominant components in fat are methylene (CH2) and methyl radicals (CH3).
The relaxation times (T1 and T2) of tissues, which are sensitive to the dynamic structure and amount of water in the biological system, are also sensitive to temperature. The temperature sensitivity of the spin-lattice relaxation time, T1, has been measured for a number of fatty tissues, and has been found to obey a nearly linear relationship with temperature (6,7). T1 of CH2, the dominant component of fat, was shown to be promising in terms of reliability and reproducibility for measuring temperature changes (8).
In this study, we present an MRI sequence for simultaneous three-dimensional (3D) fat and water temperature imaging based on the extended two-point Dixon fat and water separation and the double flip angle (DFA) T1 mapping techniques. The technique was implemented using a 3D segmented flyback echoplanar imaging (EPI) sequence for real-time temperature monitoring during HIFU sonication of a phantom consisting of human breast fat embedded in ex vivo porcine muscle. The mixture of these tissues was used as a substitute for the human breast.
Methods
Extended Two-Point Dixon
The extended two-point Dixon method, which provides fat and water separation comparable to the three-point Dixon method (9), was applied for two flip angles (α1 and α2) as follows:
| [1] |
| [2] |
| [3] |
| [4] |
where I1 and I2 represent the two in-phase images acquired at echo time (TE) and I3 and I4 are the two out-of-phase images acquired at TE+Δ. W and F are real, nonnegative, and proportional to the amount of water and fat magnetization in each voxel, respectively. The flip angles α1 and α2 were computed to minimize the variance in fat T1 as described previously (10). ϕ1 is the phase accumulation induced by B0 field inhomogeneity during the time Δ. ϕ0 is the phase that accumulates from all sources during time TE.
Equations [1] and [3] can be solved for W and F by first eliminating ϕ0 using:
The phase of the image ( ) was unwrapped (11) before extracting the phase as: . The final water and fat images were obtained as:
where W and F are the resulting water and fat-only images at flip angle α1. Similarly, I2 and I4 were used to obtain fat and water images at flip angle α2.
PRF Temperature Measurement
The PRF shift uses the temperature-dependent change of the proton chemical shift relative to a baseline value (nonheated). The phase difference is converted to temperature change as (12–14):
| [5] |
where γ is the gyromagnetic ratio, β is the thermal coefficient, B0 is the main magnetic field, and Δϕ is the phase change. Phase subtraction was performed to exclude nonthermal contributions to the phase (e.g., radiofrequency [RF] coil sensitivity or B0 field inhomogeneities), leaving only the spatially resolved phase shift attributable to temperature-induced PRF shift. PRF temperature changes were estimated in aqueous tissue by using the water-only images, derived from the Dixon water/fat separation, as a mask on the original complex data.
Furthermore, in the regions where fat and water voxels overlapped due to the chemical shift (usually at the fat/water interface regions), the water phase was calculated in a straightforward manner based on the fraction of the fat and water in each voxel, the fat background phase, and the resulting signal intensity in those voxels before the fat/water separation. From a schematic representation of fat (F⃗) and water (W⃗) magnetization vectors as well as the resultant signal vector (S⃗I) in a single overlapped fat/water voxel, one can obtain the scalar form as:
| [6] |
where (w, ϕw) and (f, ϕf) are the magnitudes and phases of the vectors F⃗ and W⃗, respectively. Similarly, SI and ϕ are the magnitude and phase of the resultant signal. The fat background phase, ϕf, for a mixed fat/water voxel is set equal to the phase of the nearest fat-only voxel.
From Equation [6], one can solve for the water phase as:
| [7] |
where is the fat fraction in the mixed fat/water voxel.
Because the fat phase changes very little with a rise in temperature, it can be assumed that ϕf remains constant and ϕw can be extracted for measuring the PRF temperature throughout the treatment. However, it is important to note that if a small change in fat phase were to occur, this would be a source of error in the computation of the water phase in mixed fat/water voxels.
Furthermore, it has been shown that the susceptibility change in fat is a source of error in the PRF temperatures in mixed fat/water tissue (15). These errors are not eliminated by fat suppression, and they originate from several factors, which range from the shape and orientation of the heating pattern to the water and fat distribution inside the heated area. In general, they are small and difficult to quantify and should be evaluated on an experiment-by-experiment basis for tissues with large fat content.
T1 Temperature Measurement Using the DFA Method
The DFA method uses the equation describing the T1 dependence of the signal of an ideally spoiled steady state gradient echo sequence. We calculated a single longitudinal relaxation time assuming that fat can be represented by its dominant methylene peak.
Two measurements made at different flip angles are used to linearize the signal equation and therefore T1 can be extracted by linear regression as described in Deoni et al. (10). The two flip angles must be chosen carefully to optimize the precision of the measurement. Deoni et al (16) and Schabel and Morrell (17) have each shown that the precision is best when the flip angles chosen are on either side of the Ernst angle and the signal for each is 71% of the signal intensity produced at the Ernst angle. Measurement accuracy is compromised when the flip angles used in the calculations do not equal the actual flip angles applied. Because B1 is not homogeneous, a B1 field map for accurate flip angle determination needs to be obtained prior to the measurement. In gradient echo sequences, the B1 field map at a given flip angle, α, can be obtained by dividing two acquisitions performed with flip angles α and 2α (18). This approach of the B1 field mapping is T1-dependent and requires that the repetition time (TR) during the acquisition at the two flip angles is long (e.g. 5 times T1) compared with T1 of the sample. Because the goal of these experiments was to determine T1 in fat, the TR used for B1 determination was five times the T1 of fat. B1 is then determined from the local flip angle:
| [8] |
Furthermore, T1 can be simultaneously calculated in fat and water with minimum loss of T1 precision in fat. In this case, our simulations (Fig. 1) show that a good precision in T1 in both fat and water can be achieved by solely considering the optimum two flip angles of water and setting the TR to equal five times T1 of the water for B1 field mapping. The simulation was performed using the parameters TR = 20 ms, T1,fat = 300 ms, and T1,water- = 1200 ms, which yielded two sets of optimal flip angles (9°, 48°) and (5°, 25°) for fat and water, respectively. The plot of the relative variance of T1 versus the second flip angles of fat and water in Figure 1 was obtained by setting the first flip angle of fat equal to the first optimal flip angle of water (a1fat = a1water = 5°), and changing the second flip angle from 6° to 180° in 2° increments for fat and water, respectively.
Fig. 1.
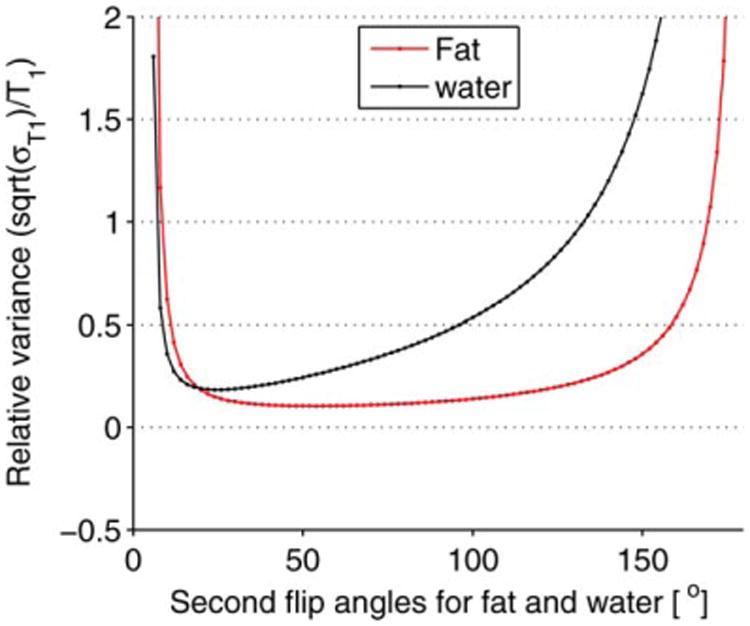
Simulation result of the relative variance of T1 when the two optimal flip angles of water are used to estimate T1 in mixed fat/water tissue. For the simulation, the first flip angle for fat was set equal to the first optimum flip angle of water (a1water = a1fat = 5°) and the second flip angles for fat a2fat and water a2water were found by varying the flip angles from 6° to 180° in 2° increments. The plot shows that T1 can be computed simultaneously in fat and water with minimal loss in T1 precision in fat by just using the two optimal flip angles of water.
The dependence of T1 with temperature has been demonstrated experimentally (19,20) and can be approximated as:
| [9] |
where is tissue-dependent, T is the absolute temperature during heating, and Tref is the absolute temperature of the reference time point where no heating has occurred.
Experimental Setup and Pulse Sequences Design
We conducted experiments on excised human breast fat embedded in ex vivo porcine muscle using a Siemens TIM Trio 3T MRI scanner (Siemens Healthcare, Erlangen, Germany). The sample was sandwiched between two custom-built two-channel RF receiver surface coils for better imaging signal-to-noise ratio (SNR) at the ultrasound focus and was placed in a sample holder. For the experiment, the excised breast fat was kept refrigerated and was used within the first 2 days after excision. To provide proper acoustic coupling, a layer of degassed water was poured between the bottom of the container made of mylar film, and the tissue sample and water filled any space between the excised fat and porcine tissue. Sample heating was performed using a 256-element MRI compatible phased-array ultrasound transducer (Imasonic, Besançon, France) that was housed in a bath of deionized and degassed water. The transducer (1 MHz, 13 cm focal length) was mounted in a computer-controlled, mechanically driven, MRI-compatible positioning system (Image Guided Therapy, Bordeaux, France). The ultrasound power was controlled outside the MR room via the controller computer. A fiber optic temperature probe (OpSens, Inc, Quebec, Canada) was placed at the interface between the fat and the aqueous tissue and high-resolution images of the sample were taken to position the ultrasound focus near the tip of the probe but outside of the direct ultrasound beam path. Figure 2 shows a schematic of the experimental setup used in our experiment.
Fig. 2.
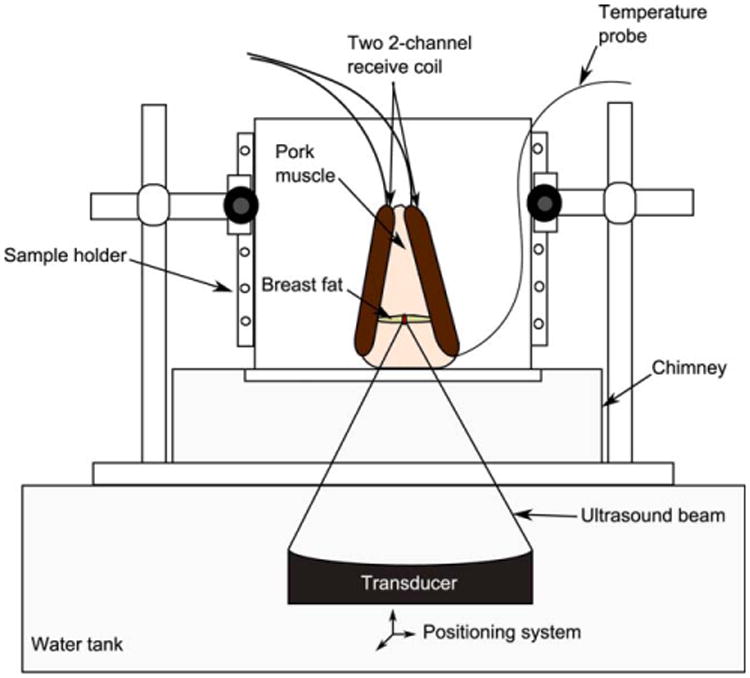
Experimental setup. Human breast fat, embedded in porcine muscle, was used as a substitute for human breast. The sample was sandwiched between the two custom-built two-channel RF receiver surface coils and placed within the sample holder container. A chimney filled with degassed water ensured an acoustic beam path to the tissues sample.
To simultaneously measure PRF and T1, the new hybrid Dixon PRF-T1 sequence was implemented as a modification of a standard segmented EPI sequence. The sequence was implemented by alternating two flip angles every other time frame and two TEs (TE, TE+Δ) every other two time frames, respectively. TE and TE+Δ (where Δ = 1.15 ms at 3T) represent the echo times when water and fat are in phase and 180° out phase, respectively. Finally, flyback lobes were added to the readout echo train to ensure that all k-space lines were acquired in one direction, therefore providing a highly efficient method for acquiring extended 2-point Dixon data in the presence of fat and aqueous tissue. The temperature maps were acquired in four measurements as described in Figure 3.
Fig. 3.
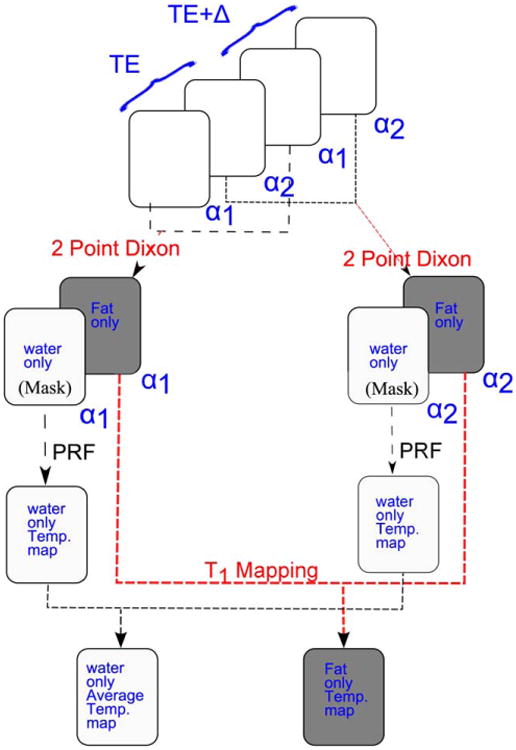
Schematic diagram of the simultaneous fat and aqueous tissue temperature imaging using the two-point Dixon hybrid PRF-T1 acquisition method. The two temperature maps, PRF and T1, are acquired in a series of four images. Images acquired at the same flip angle are combined using the extended two-point Dixon methods to separate fat and aqueous tissues. The water-based tissue-only images are used to mask the original complex images to remove the fat signal. The phases of the aqueous tissue in regions where fat and water voxels overlapped due the chemical shift were computed using Equation [7]. A high SNR PRF temperature map was obtained by averaging over the phase maps of the two FAs. The T1 map of the fat was computed from the fat-only images using the DFA method.
In practice, temperature quantification using T1 method necessitates the calibration of T1 with temperature. Therefore, T1 calibrations with temperature in breast fat samples for four different patients were performed to determine the variability of the average temperature coefficient dT1/dT and consequently the average relative temperature coefficient (%/°C). These calibration experiments consisted of imaging two vials (inside diameter = 2 cm, height = 5.5 cm) containing breast fat sample while they were cooling. The vials were preheated in a water bath and placed within a thermal insulating Styrofoam block. The temperature of the fat samples were recorded during the cooling phase using two temperature probes (OpSens, Inc, Quebec, Canada) that were inserted in the vials before placing the ensemble within a 16-channel Siemens head coil (Siemens Healthcare, Erlangen, Germany). The temperatures were sampled every 3 minutes for all experiments for 105 minutes on average. Table 1 lists the imaging parameters of the different experiments.
Table 1. Temperature Dependence of the Spin-Lattice Relaxation Time (T1) in Breast Fat of Four Patients Acquired during Cooling Experiments.
| Patient 1 | Patient 2 | Patient 3 | Patient 4 | |
|---|---|---|---|---|
| TR/TE (ms) | 30/8 | 30/11 | 30/9.8 | 30/8.6 |
| Image matrix | 128 × 31 | 128 × 39 | 128 × 31 | 128 × 31 |
| Voxel size (mm3) | 1.3 × 1.3 × 3 | 1 × 1 × 3 | 1.2 × 1.2 × 3 | 2 × 2 × 3 |
| EPI factor | 3 | 3 | 3 | 3 |
| Bandwidth (Hz/pixels) | 550 | 454 | 368 | 448 |
| Slices | 10 | 18 | 18 | 8 |
| Averages | 5 | 5 | 5 | 10 |
| Flip angles (°) | 13/57 | 16/63 | 15/58 | 15/66 |
| ROI size | 5 × 5 | 5 × 5 | 5 × 5 | 5 × 5 |
| Average temperature coefficient (ms/°) | 10.97 | 8.15 | 6.76 | 6.21 |
| Average relative temperature coefficient (%/°C) | 1.58 | 1.20 | 1.37 | 1.29 |
| Temperature range (°C) | 24–65 | 26–78 | 25–67 | 25–68 |
| Correlation coefficient R | 0.9875 | 0.9980 | 0.9973 | 0.9956 |
Experiment and Data Processing
T1 values of the sample were obtained at the beginning of the experiment using the null-point (21) of a conventional two-dimensional inversion recovery (IR) turbo spin echo pulse sequence (TR/TE = 5000/17 ms, 2 × 2 × 3 mm resolution, 7 slices, 128 × 90 image matrix, echo train = 11, TI = [50 200 300 400 800 1000 1200]).
The T1 values obtained were used to select a minimum TR that provided a good SNR for the two optimum flip angles. The prescribed flip angles that would result in the best T1 measurement precision were empirically determined from the signal intensity averaged over a large region of interest using the 3D segmented flyback EPI sequence with a range of flip angles from 7° to 87° in 10° increments. The two optimum flip angles were derived from the plot of the normalized signal intensity versus the prescribed flip angles (Fig. 4). To minimize error in T1, a correct flip angle map of each selected optimum flip angle was obtained using the steps described for Equation [8].
Fig. 4.
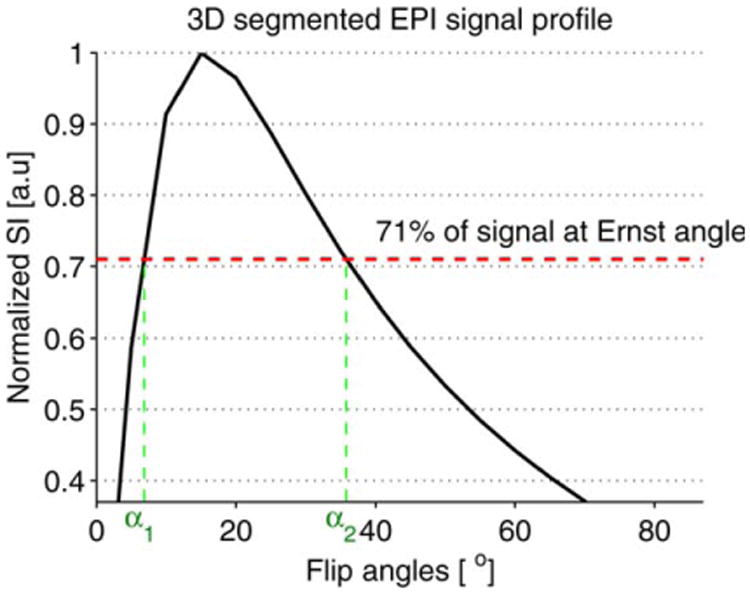
Plot of the normalized signal intensity (SI) of the 3D segmented flyback EPI sequence versus the flip angles. The maximum T1 precision is achieved by choosing the flip angles such that SIa1=SIa2= 71% of the SI at Ernst angle αE. The plot is zoomed in to show the locations of the two optimal flip angles.
The HIFU heating experiment was performed at three different acoustic powers: 10, 20, and 26 W. The sequence was used to acquire images with coronal slice orientation during the heating and the cooling phases. Scan parameters for the three heating runs were as follows: TR/TE = 20/9.8 ms, readout bandwidth = 640 Hz/pixel, echo train length = 5, image matrix = 128 × 90, 8 slices, and 2 × 2 × 3 mm resolution for a scan time of 3.7 s for a single flip angle. The scan time of 3.7 s included a prescan time of 0.8 s to reach steady state in addition to the actual acquisition time [(90 × 8 × 20)/5 = 2.88 s]. The prescan time was needed before acquiring each time frame, because the flip angles were alternating from time frame to time frame. Although short TR and TE allow for fast measurement, the PRF method yields the best precision if (22–25). The value for the muscle is approximately 25 ms (26); therefore, a compromise between short measurement time (short TE, high SNR) and accuracy of the temperature map was necessary.
The readout bandwidth and the echo spacing used in this experiment resulted in a chemical shift of the fat with respect to the aqueous tissue of 1 pixel along the readout direction and 4 pixels in the phase-encoding direction. The empirically determined optimum flip angles were 8° and 35°, respectively. The first two heating runs (10 W and 20 W) focused the beam on a single point and were performed for a duration of 2 min each. The last run of the experiment (26 W) heated a circular trajectory (radius = 2 mm, 13 points, 50 ms/point) for 3 min. A variable time delay, ranging from 10 to 15 min was applied between ultrasound sonications to allow the heated region to cool to within about 5°C of the starting temperature.
Image reconstruction, fat-water image processing, and the calculation of temperature maps were performed offline with MATLAB (MathWorks, Natick, MA). The individual coil images of each heating run were decomposed into fat and water magnitude images using the extended two-point Dixon method. The decomposed fat and water magnitude images from each coil were then combined using the “sum-of-squares” method (27), which effectively computes the root-mean-square average of the images associated with the different coils. To calculate the PRF temperature maps, the original complex images were reconstructed using a multicoil algorithm that combines the phase differences between adjacent time frames weighted by the square of the magnitudes. The water-only images were used to mask the combined complex images before computing the PRF shift. Averaging of the phase maps of the two optimum flip angles was used to improve the SNR of the temperature maps. The thermal coefficient β = −0.01 ppm/°C was used for PRF thermometry calculation.
The values of the spin-lattice relaxation time T1 were calculated from the fat-only images at the two optimum flip angles following the steps described earlier. Before obtaining the T1 maps, the image noise was reduced by applying a Hanning filter to the raw data.
Results
Temperature images of the 3D volume of the phantom were obtained with a 14.8 s temporal resolution and 2 × 2 × 3 mm spatial resolution. Figure 5 shows the T1 maps of the fat in slices 4, 5, and 6, which were computed using the DFA method as described earlier. Figure 5b shows T1 rise with temperature at the focal point in the fat sample during the HIFU heating.
Fig. 5.
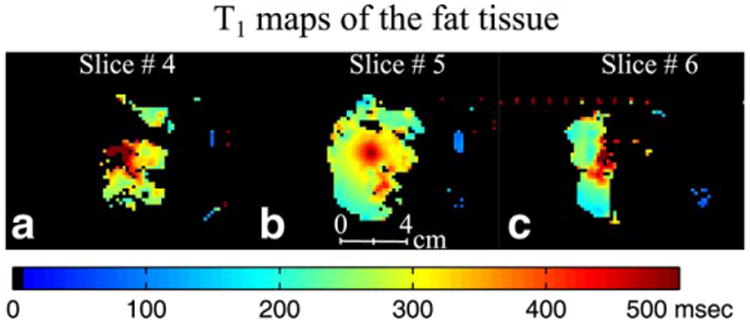
HIFU heating experiment results for run 2 (20 watts). T1 maps at the peak temperature of the fat in slice 4 (a), slice 5 (b), and slice 6 (c). After separating water and fat signals using the extended two-point Dixon method, the T1 maps of fat were obtained using the DFA method.
Figure 6 shows on the top row the zoomed in PRF temperature maps of the eight coronal slices of the aqueous tissue of the phantom during the HIFU heating run 2. All coronal slices show temperature rise at the focus of the ultrasound beam except slice 5 (Fig. 6e) which contains fat at that location. Because fat does not show a temperature-dependent frequency shift, the localized fat signals have been removed from slices 4, 5, and 6 (Fig. 6d, 6e, and 6f) using the extended two-point Dixon method beforehand. The locations of the fat signal in these slices are indicated by arrows. All the slices are shown in the plane perpendicular to the HIFU beam path. The bottom row of Figure 6 shows the temperature maps of the fat tissue obtained from the T1 maps from Figure 5 using the results of the calibration of T1 with temperature in Figure 8.
Fig. 6.
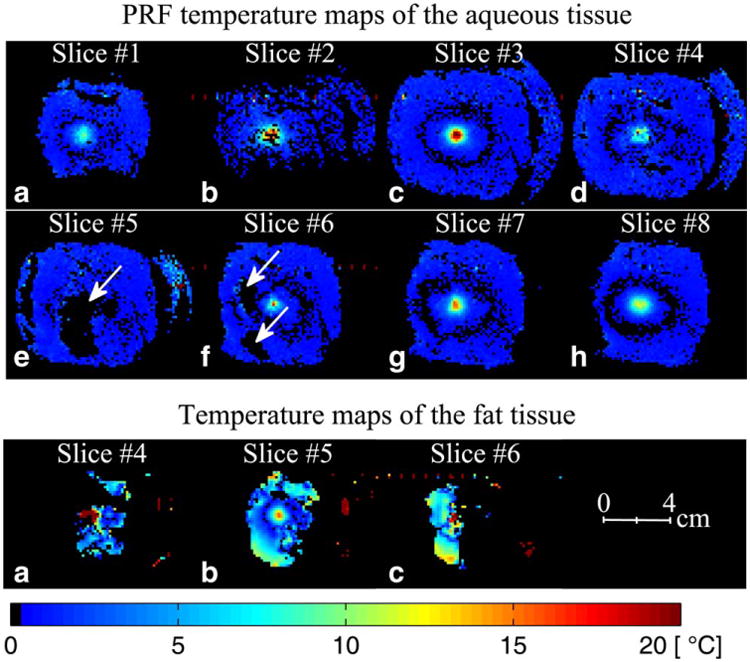
HIFU heating experiment results for run 2 (20 W). The top two rows show PRF temperature maps at the peak temperature of the eight coronal slices (perpendicular to the HIFU beam) of the aqueous tissue in the 3D volume. PRF temperature maps of these coronal slices were obtained by removing the fat signal using the extended two-point Dixon methods. The arrows indicate the locations of the removed fat signal. In the regions where fat and water voxels overlapped due to the chemical shift, the water phase was calculated based on the fraction of fat and water in each voxel, the fat background phase, and the resulting signal intensity in those voxels before the fat/water separation. The bottom row shows temperature maps of the fat tissue in slices 4, 5, and 6 obtained from the T1 maps in Figure 5. The temperature maps were calculated using the average T1 calibration coefficients obtained in Figure 8.
Fig. 8.
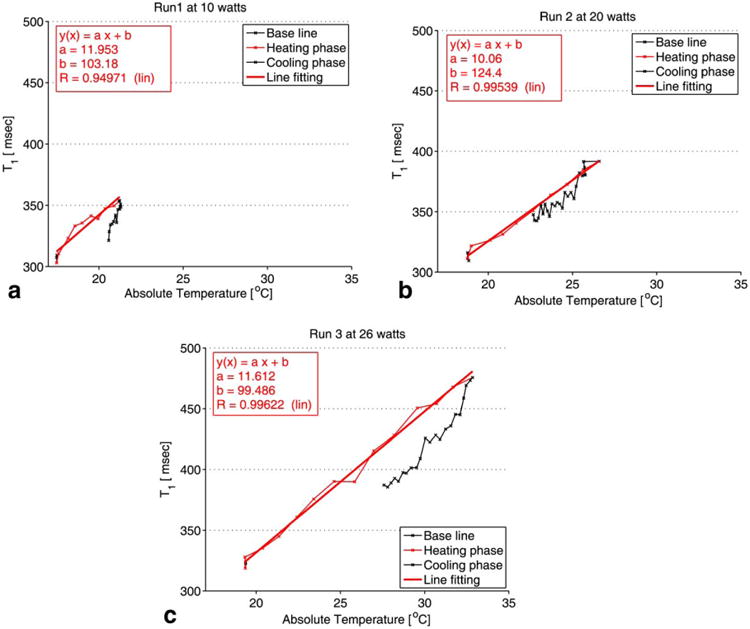
T1 profile in slice 5. All measurements were performed in adipose tissue. The plot of the absolute T1 versus the temperature reading of the fiber optic temperature probe is shown for each of the three HIFU heating runs: 10W (a), 20 W (b), and 26 W (c). T1 was computed over an ROI of 2 × 2 pixels near the tip of the fiber optic temperature probe. The standard deviation of the absolute T1 change was ±5 ms.
To validate T1 values derived from the DFA method, T1 maps were calculated using the IR and the DFA methods of the 10 coronal slices of the two samples of the breast fat tissue from patient 1 (Fig. 7a). The images of IR and DFA were acquired with the same spatial resolution (1.3 × 1.3 × 0.3 mm), and the locations of the slices were identical. Although the fat sample did not contain a large amount of water (<5%), T1 images using DFA were computed on fat-only images as described in Figure 3, while IR images were computed in mixed fat and water. Figure 7b shows the line plots along the green dashed line in Figure 7a. Figure 7c shows the error bar plots of the means and the standard deviations of T1 computed over a 7 × 7 pixel region of interest (ROI) in the 10 coronal slices using the IR and the DFA methods, respectively. The means and standard deviations were calculated from the combined T1 values from the two vials over the ROIs shown by the black squares on the T1 maps of slice 2 derived from the IR and the DFA methods. The average mean values of T1 from the 10 slices were found to be 280 ± 25 ms for IR and 282 ± 18 ms for DFA.
Fig. 7.
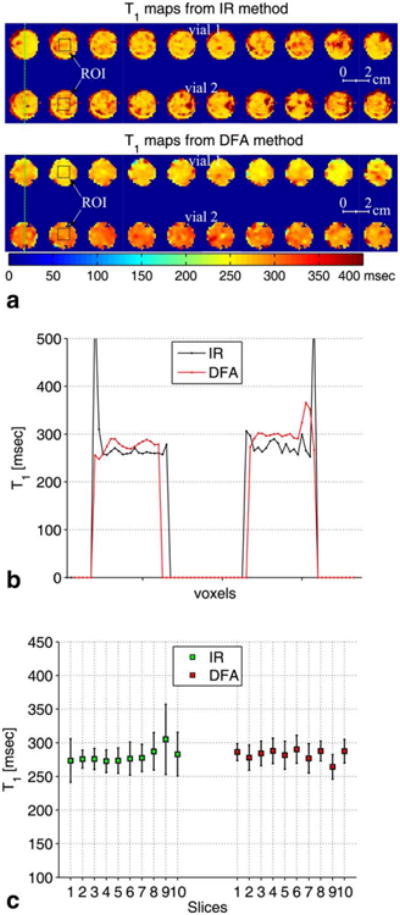
a: The top row shows zoomed-in T1 maps of the 10 coronal slices in ascending order of the breast fat tissue from patient 1 (see Table 1) computed using the inversion recovery (IR) method. The bottom row shows T1 maps of the same coronal slices using the DFA method. b: Line plots along the green dashed lines on the IR and the DFA T1 maps of slice 1. c: Error bar plots of the T1 maps of the 10 slices. The error bar plots show the mean and the standard deviation of T1 calculated over an ROI of 7 × 7 pixels shown by the black squares on slice 2 of the T1 maps obtained from the IR and the DFA methods.
T1 calibration with temperature for the HIFU experiment was performed in fat over a 2× voxel ROI chosen near the tip of the fiber optic temperature probe. Figure 8 is a plot of the absolute T1 versus the temperature reading of the fiber optic temperature probe during the HIFU heating and cooling phases of the sample for the heating runs at 10, 20 and 26 watts respectively. The recorded temperatures via the fiber optic temperature probe during the experiment have a precision of ±0.5°C below 40°C according to the temperature probe manufacturer. To estimate the precision of T1 values, the standard deviation of the absolute T1 have been measured in a uniform, non-heated region and was found to be ±5 ms. From Figure 8a-c, it can be seen that T1 changes linearly with temperature with an average temperature coefficient of 11.2 ms/°C.
Similarly, PRF temperature rise in aqueous tissue for the three HIFU heating runs over the same ROI location in all eight slices was calculated and plotted versus the time in Figure 9. The offset between the location of the fat and water spins due to the chemical shift was corrected while choosing the corresponding ROI in aqueous tissue. The plots of the PRF temperature versus the time show that the fat voxels in slice 5 experienced a small change of PRF temperature over time, which is either the result of the B0 field drift of the MRI scanner or to the result of a susceptibility change due to heating of the tissue sample.
Fig. 9.

(a-c) Plots of the PRF temperature versus the time of the corresponding ROI of 2 × 2 pixels described in Figure 8. All of the measurements were made in the aqueous tissue for each of the three heating runs: 10W (a), 20 W (b), and 26 W (c). The offset between the location of the fat and the water voxels due to the chemical shift was corrected while choosing the ROI in aqueous tissue.
The cooling experiments show that T1 of breast fat is linear with temperature over a larger temperature range up to 78°C. Similarly, the temperature coefficients vary from 6.21 to 10.97 ms/°C, which confirms the tissue dependence of T1. To compensate for tissue variability of T1, the relative temperature coefficients were also calculated and ranged from 1.2 to 1.58 %/°C.
Discussion and Conclusion
The results presented herein demonstrate the 3D fat and water temperature imaging capability of a new acquisition scheme based on an extended two-point Dixon fat and water separation and the DFA T1 mapping techniques. Visual inspection of the PRF temperature maps of the eight slices in Figure 5 and the T1 map values of the fat in Figure 6 demonstrate the effectiveness of the extended two-point Dixon method in separating fat and water signals.
The carefully chosen TE value used for this experiment provided high imaging SNR, which has improved the accuracy of the fat water decomposition method. Furthermore, in voxels where fat and water signals overlap due to the chemical shift, the method presented in this paper allows the phase of water to be calculated with minimum error. The calculation is made possible by assuming that the fat phase is the same as that of the nearest fat-only voxel and remains constant throughout the treatment. This assumption appears reasonable from the results shown in Figure 9, as the phase from the fat region in slice 5 (the only slice without partial water signal) changes very little during heating and only slightly more during cooling. These small changes will induce only a small error in the water phase calculation and affect only mixed fat/water voxels.
Although B1 mapping can be challenging and is prone to errors in DFA T1 calculation, the comparison of our T1 maps with the ones derived from the IR method (Fig. 7) shows that the DFA method achieved the same bulk of T1 values in the 10 coronal slices of the fat sample from patient 1.
Additionally, one of the prerequisites for successful T1 monitoring of thermal therapy is stability over the entire treatment period. The data from our study demonstrate the stability of T1 determination during the application of several individual sonications. Moreover, the average temperature coefficients dT1/dT was found to be 11.2 ms/°C with a relative value of 2.6%/°C in the HIFU heating experiments and values ranging from 6.21 to 10.97 ms/°C with relative values from 1.2 to 1.58 %/°C in the water bath cooling experiments. Although the voxels for T1 measurement were chosen to be as close as possible to the fiber optic probe location, uncertainty in that location also has an effect on the value of the slope obtained. To reduce that error, the voxels were chosen to minimize the hysteresis in the plot of T1 versus the probe temperature. When the T1 measurement and the probe are not in the same location, hysteresis occurs because of the difference in time for the heat from the ultrasound focus to diffuse to the two locations.
A small variation was noted in the T1 dependence on temperature for the four subjects included in Table 1. If this range of sensitivities is typical of the population of women to be encountered in thermal therapies, this intersubject variation could result in some error in the fat temperatures estimated during thermal procedures. For example, using the T1 thermal coefficient of patient 4 to estimate the temperature change in the 40°C range in the fat tissue of patients 1, 2, and 3 could result in 43%, 23%, and 8% overestimation, respectively, of the temperature of the fat in those patients during real-time thermal therapy. Note that breast cancer usually originates in the fibroglandular tissue, and the goal of T1 estimation is to monitor and minimize temperature rise in the surrounding healthy fatty tissue. However, if the range of T1 dependencies is large, it may be useful to find a way to calibrate the temperature dependence on each subject. This calibration might be done by using voxels that contain both fat and water. In fact, it might be possible to use the knowledge of PRF temperature in water in mixed fat/water voxels to calibrate the temperature dependence of T1 in fat. The accuracy of this method will require (a) a voxel that is large enough to yield sufficient signal from both fat and water and (b) a small temperature gradient across the voxel.
Imaging time is often a concern with any MR thermometry technique requiring multiple image acquisitions. Therefore, real-time control of thermal ablation procedures in immobilized organs such as the human breast (28) requires a method that has good temporal and spatial resolution, provides sufficient thermometry precision, and is easy to implement. The pulse sequence used in our study is easy to implement and has good spatial resolution. Although the proposed technique for simultaneous temperature mapping in fat and water is not currently practical for clinical applications due to the long acquisition time (14.8 s for the four image volumes of one complete set of temperature maps), the temporal resolution can be considerably improved by calculating PRF temperatures from each pair of flip angles and also by implementing a parallel acquisition technique. For instance, GRAPPA [GeneRalized Autocalibrating Partially Parallel Acquisitions (29–31)] with an accelerated factor of 4, which is common for 3D sequences in the clinical setting, can reduce the acquisition time by four-fold with little sacrifice in accuracy of the temperature maps. In addition to increased temporal resolution at a given spatial resolution, the time savings of a parallel acquisition technique can also be used to improve the spatial resolution in a given imaging time. However, the time can also be reduced by having more echoes in the EPI echotrain.
The precision of T1 measurements using the variable flip angle technique depends on using an accurate estimate of the actual local flip angles. B1 inhomogeneity causes a spatial variation in the flip angle and therefore needs to be corrected. Simulations investigating T1 accuracy as a function of the nominal flip angle, demonstrated that the results were highly sensitive to imprecision in flip angle, with T1 error > 10% with a 5% deviation in flip angle (32). Although B1 mapping over the entire volume requires several minutes of acquisition and processing, it has to be performed only once and then can be used throughout the procedure. Moreover, in 3D imaging, RF pulse profile errors are minimal if the region of interest is centered in the excited 3D slab, like the fat slices in this experiment, or if the slab-select gradient is turned off. Additionally, a custom-designed Shinnar-Le Roux selective excitation pulse (33) or fast passage adiabatic pulses can be used to optimize T1 accuracy.
In conclusion, the ability of real-time simultaneous temperature mapping in fat and aqueous tissue during HIFU ablation has been demonstrated in ex vivo tissue samples. The sequence uses a segmented EPI read-out to shorten the scanning time and an acquisition method to produce simultaneous temperature maps of fat and aqueous tissue during thermal therapy. The technique has shown stability and reliability during the thermal ablation. Studies demonstrating the applicability of this new technique in vivo are ongoing. The results of this investigation in conjunction with reducing the acquisition time of the temperature maps will be presented in future work.
Acknowledgments
The authors appreciate helpful contributions from Joshua de Bever, Leigh Neumayer, and other collaborators at the University of Utah.
Grant sponsor: National Institutes of Health; Grant number: R01 CA134599; Grant sponsor: The Ben B. and Iris M. Margolis Foundation; Grant sponsor: Siemens Medical Solutions.
References
- 1.Hynynen K, McDannold N, Mulkern RV, Jolesz FA. Temperature monitoring in fat with MRI. Magn Reson Med. 2000;43:901–904. doi: 10.1002/1522-2594(200006)43:6<901::aid-mrm18>3.0.co;2-a. [DOI] [PubMed] [Google Scholar]
- 2.Graham SJ, Bronskill MJ, Henkelman RM. Time and temperature dependence of MR parameters during thermal coagulation of ex vivo rabbit muscle. Magn Reson Med. 1998;39:198–203. doi: 10.1002/mrm.1910390206. [DOI] [PubMed] [Google Scholar]
- 3.Kuroda KOK, Mulkern RV, Jolesz FA. Optimization of chemical shift selective suppression of fat. Magn Reson Med. 1996;40:505–510. doi: 10.1002/mrm.1910400402. [DOI] [PubMed] [Google Scholar]
- 4.Vandeweyer E, Hertens D. Quantification of glands and fat in breast tissue: an experimental determination. Ann Anat. 2002;184:181–184. doi: 10.1016/S0940-9602(02)80016-4. [DOI] [PubMed] [Google Scholar]
- 5.Dimitrov IE, Douglas D, Ren J, Smith NB, Webb AG, Sherry AD, Malloy CR. In vivo determination of human breast fat composition by 1H magnetic resonance spectroscopy at 7 T. Magn Reson Med. 2012;67:20–26. doi: 10.1002/mrm.22993. [DOI] [PMC free article] [PubMed] [Google Scholar]
- 6.Gandhi S, Daniel B, Butts K. Proceedings of the 6th Annual Meeting of ISMRM. Sydney, Australia: 1998. Temperature Dependence of Relaxation Times in Bovine Adipose Tissue; p. 701. [Google Scholar]
- 7.Lam MK, I T, Saito K, Kuruda K. Proceedings of the 19th Annual Meeting of ISMRM. Stockholm, Sweden: 2010. Effect of Water Resonace Thermal Shift on Methylene T1 Estimation with Multiple Flip Angle Multipoint Dixon Technique for Fat Temperature Imaging; p. 4128. [Google Scholar]
- 8.Kuroda K, Iwabuchi T, Obara M, Honda M, Saito K, Imai Y. Temperature dependence of relaxation times in proton components of fatty acids. Magn Reson Med Sci. 2011;10:177–183. doi: 10.2463/mrms.10.177. [DOI] [PubMed] [Google Scholar]
- 9.Skinner TE, Glover GH. An extended two-point Dixon algorithm for calculating separate water, fat, and B0 images. Magn Reson Med. 1997;37:628–630. doi: 10.1002/mrm.1910370426. [DOI] [PubMed] [Google Scholar]
- 10.Deoni SC, Rutt BK, Peters TM. Rapid combined T1 and T2 mapping using gradient recalled acquisition in the steady state. Magn Reson Med. 2003;49:515–526. doi: 10.1002/mrm.10407. [DOI] [PubMed] [Google Scholar]
- 11.Cusack R, Papadakis N. New robust 3-D phase unwrapping algorithms: application to magnetic field mapping and undistorting echoplanar images. Neuroimage. 2002;16:754–764. doi: 10.1006/nimg.2002.1092. [DOI] [PubMed] [Google Scholar]
- 12.Quesson B, de Zwart JA, Moonen CT. Magnetic resonance temperature imaging for guidance of thermotherapy. J Magn Reson Imaging. 2000;12:525–533. doi: 10.1002/1522-2586(200010)12:4<525::aid-jmri3>3.0.co;2-v. [DOI] [PubMed] [Google Scholar]
- 13.Rieke V, Butts Pauly K. MR thermometry. J Magn Reson Imaging. 2008;27:376–390. doi: 10.1002/jmri.21265. [DOI] [PMC free article] [PubMed] [Google Scholar]
- 14.Ishahara Y, Calderon A, Watanabe H, Okamoto K, Suzuki Y, Kuroda K, Suzuki Y. A precise and fast temperature mapping using water proton chemical shift. Magn Reson Med. 1995;34:814–823. doi: 10.1002/mrm.1910340606. [DOI] [PubMed] [Google Scholar]
- 15.Sprinkhuizen SM, Bakker CJ, Ippel JH, Boelens R, Viergever MA, Bartels LW. Temperature dependence of the magnetic volume susceptibility of human breast fat tissue: an NMR study. MAGMA. 2012;25:33–39. doi: 10.1007/s10334-011-0250-2. [DOI] [PubMed] [Google Scholar]
- 16.Deoni SC, Peters TM, Rutt BK. Determination of optimal angles for variable nutation proton magnetic spin-lattice, T1, and spin-spin, T2, relaxation times measurement. Magn Reson Med. 2004;51:194–199. doi: 10.1002/mrm.10661. [DOI] [PubMed] [Google Scholar]
- 17.Schabel MC, Morrell GR. Uncertainty in T(1) mapping using the variable flip angle method with two flip angles. Phys Med Biol. 2009;54:N1–N8. doi: 10.1088/0031-9155/54/1/N01. [DOI] [PubMed] [Google Scholar]
- 18.Stollberger Rudolf, Paul W. Imaging of the active B1 field in vivo. Magn Reson Med. 2005;35:246–251. doi: 10.1002/mrm.1910350217. [DOI] [PubMed] [Google Scholar]
- 19.Parker DL. Applications of NMR imaging in hyperthermia: an evaluation of the potential for localized tissue heating and noninvasive temperature monitoring. IEEE Trans Biomed Eng. 1984;31:161–167. doi: 10.1109/TBME.1984.325382. [DOI] [PubMed] [Google Scholar]
- 20.Cline HE, Schenck JF, Watkins RD, Hynynen K, Jolesz FA. Magnetic resonance-guided thermal surgery. Magn Reson Med. 1993;30:98–106. doi: 10.1002/mrm.1910300115. [DOI] [PubMed] [Google Scholar]
- 21.Melhem ER, Jara H, Shakir H, Gagliano TA. Fast inversion-recovery MR: the effect of hybrid RARE readout on the null points of fat and cerebrospinal fluid. AJNR Am J Neuroradiol. 1997;18:1627–1633. [PMC free article] [PubMed] [Google Scholar]
- 22.Stafford RJ, Price RE, Diederich CJ, Kangasniemi M, Olsson LE, Hazle JD. Interleaved echo-planar imaging for fast multiplanar magnetic resonance temperature imaging of ultrasound thermal ablation therapy. J Magn Reson Imaging. 2004;20:706–714. doi: 10.1002/jmri.20157. [DOI] [PubMed] [Google Scholar]
- 23.Kuroda K, Mulkern RV, Oshio K, Panych LP, Nakai T, Moriya T, Okuda S, Hynynen K, Jolesz FA. Temperature mapping using the water proton chemical shift: self-referenced method with echo-planar spectroscopic imaging. Magn Reson Med. 2000;44:167. doi: 10.1002/1522-2594(200007)44:1<167::aid-mrm24>3.0.co;2-6. [DOI] [PubMed] [Google Scholar]
- 24.de Zwart JA, van Gelderen P, Kelly DJ, Moonen CT. Fast magnetic-resonance temperature imaging. J Magn Reson B. 1996;112:86–90. doi: 10.1006/jmrb.1996.0115. [DOI] [PubMed] [Google Scholar]
- 25.Oros-Peusquens AM, Laurila M, Shah NJ. Magnetic field dependence of the distribution of NMR relaxation times in the living human brain. MAGMA. 2008;21:131–147. doi: 10.1007/s10334-008-0107-5. [DOI] [PubMed] [Google Scholar]
- 26.Chung AH, Hynynen K, Colucci V, Oshio K, Cline HE, Jolesz FA. Optimization of spoiled gradient-echo phase imaging for in vivo localization of a focused ultrasound beam. Magn Reson Med. 1996;36:745–752. doi: 10.1002/mrm.1910360513. [DOI] [PubMed] [Google Scholar]
- 27.Roemer PB, Edelstein WA, Hayes CE, Souza SP, Mueller OM. The NMR phased array. Magn Reson Med. 1990;16:192–225. doi: 10.1002/mrm.1910160203. [DOI] [PubMed] [Google Scholar]
- 28.de Senneville BD, Ries M, Bartels LW, Moonen CTW. MRI-guided high-intensity focused ultrasound sonication of liver and kidney. In: Kahn T, Busse H, editors. Interventional magnetic resonance imaging. Heidelberg, Germany: Springer-Verlag; 2011. pp. 349–366. [Google Scholar]
- 29.Blaimer M, Breuer F, Mueller M, Heidemann RM, Griswold MA, Jakob PM. SMASH, SENSE, PILS, GRAPPA: how to choose the optimal method. Top Magn Reson Imaging. 2004;15:223–236. doi: 10.1097/01.rmr.0000136558.09801.dd. [DOI] [PubMed] [Google Scholar]
- 30.Blaimer M, Breuer FA, Mueller M, Seiberlich N, Ebel D, Heidemann RM, Griswold MA, Jakob PM. 2D-GRAPPA-operator for faster 3D parallel MRI. Magn Reson Med. 2006;56:1359–1364. doi: 10.1002/mrm.21071. [DOI] [PubMed] [Google Scholar]
- 31.Blaimer M, Breuer FA, Seiberlich N, Mueller MF, Heidemann RM, Jellus V, Wiggins G, Wald LL, Griswold MA, Jakob PM. Accelerated volumetric MRI with a SENSE/GRAPPA combination. J Magn Reson Imaging. 2006;24:444–450. doi: 10.1002/jmri.20632. [DOI] [PubMed] [Google Scholar]
- 32.Deoni SC, Peters TM, Rutt BK. High-resolution T1 and T2 mapping of the brain in a clinically acceptable time with DESPOT1 and DESPOT2. Magn Reson Med. 2005;53:237–241. doi: 10.1002/mrm.20314. [DOI] [PubMed] [Google Scholar]
- 33.Pauly J, Le Roux P, Nishimura D, Macovski A. Parameter relations for the Shinnar-Le Roux selective excitation pulse design algorithm (NMR imaging) IEEE Trans Med Imaging. 1991;10:53–65. doi: 10.1109/42.75611. [DOI] [PubMed] [Google Scholar]


