
Figure 4. Application of 3D high content assay to test compounds known to target XIAP and NFκB pathways in parental SUM149 and isotype matched drug-resistant isolate, rSUM149, cells.
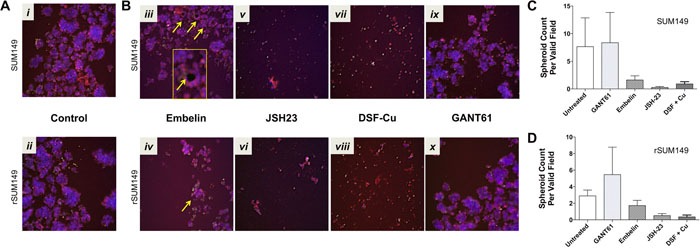
Representative images (merged overlay of all channels, 10x – scale bar = 100 microns) from spheroids derived from SUM149 and rSUM149 cells A. DMSO treated controls (i – SUM149, ii – rSUM149); B. treated with inhibitors that target XIAP (25 μM embelin [iii – SUM149, iv – rSUM149]), NFκB (100 μM JSH-23 [v – SUM149, vi – rSUM149] or 100nM DSF in combination with copper [vii – SUM149, viii – rSUM149)] or GLI1 as a non-targeting control (10 μM GANT61[xi – SUM149, x – rSUM149]). Quantitative graphical analysis of spheroid numbers derived from SUM149 C. and rSUM149 D.